Non-pvc IV Bags Market Analysis, Size, and Forecast 2025-2029: North America (US, Canada, and Mexico), APAC (China, Japan, and India), Europe (Germany, UK, and France), South America (Brazil, Argentina, and Colombia), Middle East and Africa (Saudi Arabia, UAE, and Turkey), Asia, Rest of World (ROW)

Non-pvc IV Bags Market Analysis, Size, and Forecast 2025-2029:
North America (US, Canada, and Mexico), APAC (China, Japan, and India), Europe (Germany, UK, and France), South America (Brazil, Argentina, and Colombia), Middle East and Africa (Saudi Arabia, UAE, and Turkey), Asia, Rest of World (ROW)

Published: Dec 2025 279 Pages SKU: IRTNTR73135

Market Overview at a Glance

$714.7 Mn
Market Opportunity
6.3%
CAGR 2024 - 2029
33%
North America Growth
$1.13 B
Single chamber segment 2023

Non-pvc IV Bags Market Size 2025-2029

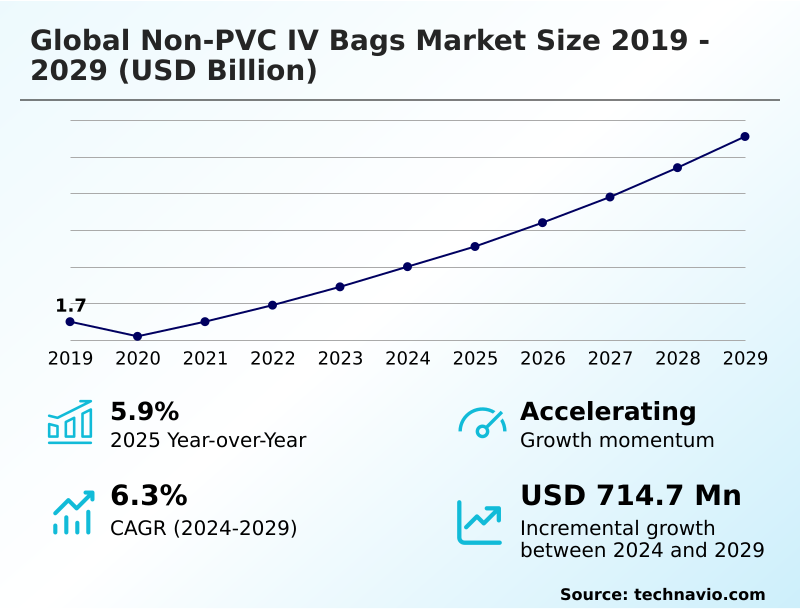
The non-pvc iv bags market size is valued to increase by USD 714.7 million, at a CAGR of 6.3% from 2024 to 2029. Regulatory and clinical focus on patient safety will drive the non-pvc iv bags market.

Major Market Trends & Insights

  • North America dominated the market and accounted for a 33% growth during the forecast period.
  • By Product - Single chamber segment was valued at USD 1.13 billion in 2023
  • By Material Type - Ethylene vinyl acetate segment accounted for the largest market revenue share in 2023

Market Size & Forecast

  • Market Opportunities: USD 1.01 billion
  • Market Future Opportunities: USD 714.7 million
  • CAGR from 2024 to 2029 : 6.3%

Market Summary

What will be the Size of the Non-pvc IV Bags Market during the forecast period?

Get Key Insights on Market Forecast (PDF) Request Free Sample

How is the Non-pvc IV Bags Market Segmented?

The non-pvc iv bags industry research report provides comprehensive data (region-wise segment analysis), with forecasts and estimates in "USD million" for the period 2025-2029, as well as historical data from 2019-2023 for the following segments.

  • Product
    • Single chamber
    • Multi chamber
  • Material type
    • Ethylene vinyl acetate
    • Polypropylene
    • Copolyester ether
  • Application
    • Chemotherapy
    • Electrolyte and glucose infusion
    • Parenteral nutrition
  • Geography
    • North America
      • US
      • Canada
      • Mexico
    • Asia
    • Europe
      • Germany
      • UK
      • France
    • Rest of World (ROW)

By Product Insights

The single chamber segment is estimated to witness significant growth during the forecast period.

Request Free Sample

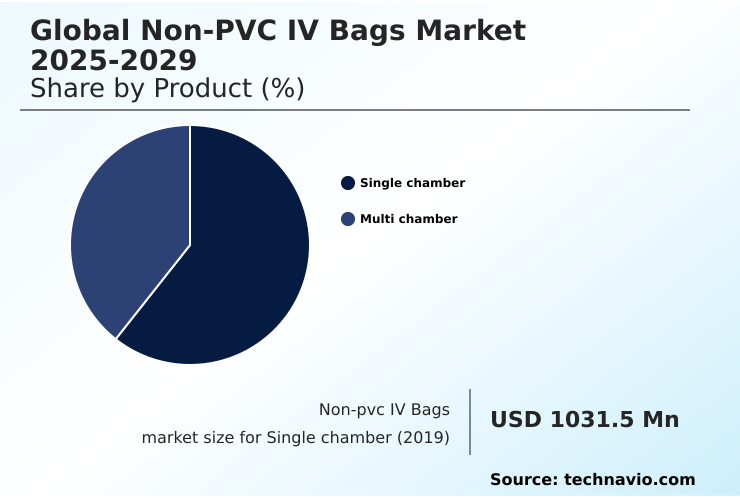
The Single chamber segment was valued at USD 1.13 billion in 2023 and showed a gradual increase during the forecast period.

Request Free Sample

Regional Analysis

North America is estimated to contribute 33% to the growth of the global market during the forecast period.Technavio’s analysts have elaborately explained the regional trends and drivers that shape the market during the forecast period.

See How Non-pvc IV Bags Market Demand is Rising in North America Request Free Sample

Market Dynamics

Our researchers analyzed the data with 2024 as the base year, along with the key drivers, trends, and challenges. A holistic analysis of drivers will help companies refine their marketing strategies to gain a competitive advantage.

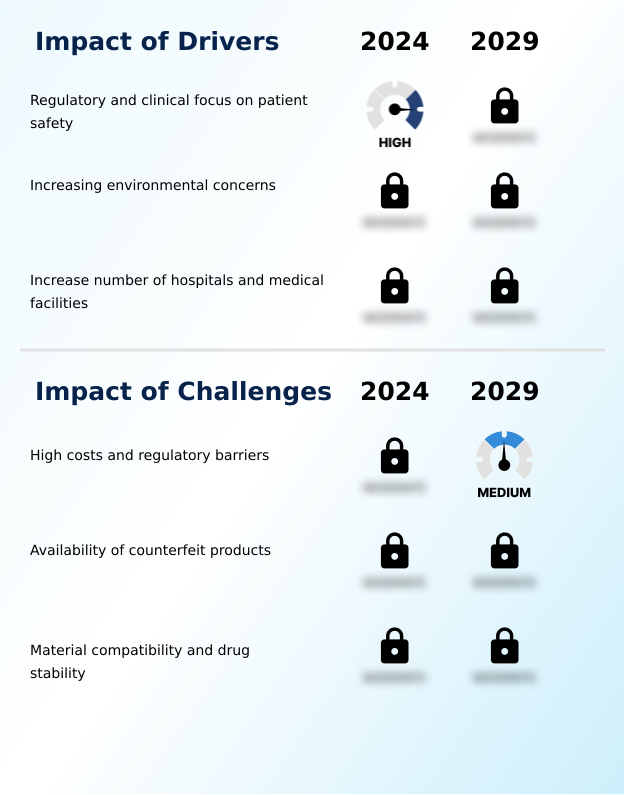
What are the key market drivers leading to the rise in the adoption of Non-pvc IV Bags Industry?

What are the market trends shaping the Non-pvc IV Bags Industry?

What challenges does the Non-pvc IV Bags Industry face during its growth?

Exclusive Technavio Analysis on Customer Landscape

The non-pvc iv bags market forecasting report includes the adoption lifecycle of the market, covering from the innovator’s stage to the laggard’s stage. It focuses on adoption rates in different regions based on penetration. Furthermore, the non-pvc iv bags market report also includes key purchase criteria and drivers of price sensitivity to help companies evaluate and develop their market growth analysis strategies.

Customer Landscape of Non-pvc IV Bags Industry

Competitive Landscape

Companies are implementing various strategies, such as strategic alliances, non-pvc iv bags market forecast, partnerships, mergers and acquisitions, geographical expansion, and product/service launches, to enhance their presence in the industry.

ANGIPLAST Pvt. Ltd. -

The industry research and growth report includes detailed analyses of the competitive landscape of the market and information about key companies, including:

  • ANGIPLAST Pvt. Ltd.
  • B.Braun SE
  • Baxter International Inc.
  • Fresenius SE and Co. KGaA
  • Haemotronic Spa
  • ICU Medical Inc.
  • JW Life Science Corp.
  • Medline Industries LP
  • Ningbo Siny Medical Technology
  • Otsuka Holdings Co. Ltd.
  • POLYCINE GmbH
  • RENOLIT SE
  • Rusoma Laboratories Pvt. Ltd.
  • Sartorius AG
  • Shanghai IVEN Pharmatech
  • Silica Healthcare Pvt. Ltd.
  • Spirit Medical Ltd.
  • SSY Group Ltd.
  • Taj Pharmaceuticals Ltd.
  • Technoflex

Qualitative and quantitative analysis of companies has been conducted to help clients understand the wider business environment as well as the strengths and weaknesses of key industry players. Data is qualitatively analyzed to categorize companies as pure play, category-focused, industry-focused, and diversified; it is quantitatively analyzed to categorize companies as dominant, leading, strong, tentative, and weak.

Recent Development and News in Non-pvc iv bags market

Dive into Technavio’s robust research methodology, blending expert interviews, extensive data synthesis, and validated models for unparalleled Non-pvc IV Bags Market insights. See full methodology.

Market Scope
Page number 279
Base year 2024
Historic period 2019-2023
Forecast period 2025-2029
Growth momentum & CAGR Accelerate at a CAGR of 6.3%
Market growth 2025-2029 USD 714.7 million
Market structure Fragmented
YoY growth 2024-2025(%) 5.9%
Key countries US, Canada, Mexico, China, Japan, India, South Korea, Indonesia, Thailand, Germany, UK, France, Italy, Spain, The Netherlands, Brazil, Saudi Arabia, UAE, Turkey, Argentina, Colombia, South Africa and Israel
Competitive landscape Leading Companies, Market Positioning of Companies, Competitive Strategies, and Industry Risks

Request Free Sample

Research Analyst Overview

What are the Key Data Covered in this Non-pvc IV Bags Market Research and Growth Report?

  • What is the expected growth of the Non-pvc IV Bags Market between 2025 and 2029?

    • USD 714.7 million, at a CAGR of 6.3%

  • What segmentation does the market report cover?

    • The report is segmented by Product (Single chamber, and Multi chamber), Material Type (Ethylene vinyl acetate, Polypropylene, and Copolyester ether), Application (Chemotherapy, Electrolyte and glucose infusion, and Parenteral nutrition) and Geography (North America, Asia, Europe, Rest of World (ROW))

  • Which regions are analyzed in the report?

    • North America, Asia, Europe and Rest of World (ROW)

  • What are the key growth drivers and market challenges?

    • Regulatory and clinical focus on patient safety, High costs and regulatory barriers

  • Who are the major players in the Non-pvc IV Bags Market?

    • ANGIPLAST Pvt. Ltd., B.Braun SE, Baxter International Inc., Fresenius SE and Co. KGaA, Haemotronic Spa, ICU Medical Inc., JW Life Science Corp., Medline Industries LP, Ningbo Siny Medical Technology, Otsuka Holdings Co. Ltd., POLYCINE GmbH, RENOLIT SE, Rusoma Laboratories Pvt. Ltd., Sartorius AG, Shanghai IVEN Pharmatech, Silica Healthcare Pvt. Ltd., Spirit Medical Ltd., SSY Group Ltd., Taj Pharmaceuticals Ltd. and Technoflex

Market Research Insights

We can help! Our analysts can customize this non-pvc iv bags market research report to meet your requirements.

Get in touch

1. Executive Summary

1.1 Market overview

Executive Summary - Chart on Market Overview
Executive Summary - Data Table on Market Overview
Executive Summary - Chart on Global Market Characteristics
Executive Summary - Chart on Market by Geography
Executive Summary - Chart on Market Segmentation by Product
Executive Summary - Chart on Market Segmentation by Material Type
Executive Summary - Chart on Market Segmentation by Application
Executive Summary - Chart on Incremental Growth
Executive Summary - Data Table on Incremental Growth
Executive Summary - Chart on Company Market Positioning

2. Technavio Analysis

2.1 Analysis of price sensitivity, lifecycle, customer purchase basket, adoption rates, and purchase criteria

2.2 Criticality of inputs and Factors of differentiation

Chart on Overview on criticality of inputs and factors of differentiation

2.3 Factors of disruption

Chart on Overview on factors of disruption

2.4 Impact of drivers and challenges

Chart on Impact of drivers and challenges in 2024 and 2029

3. Market Landscape

3.1 Market ecosystem

Chart on Parent Market
Data Table on - Parent Market

3.2 Market characteristics

Chart on Market characteristics analysis

3.3 Value chain analysis

Chart on Value chain analysis

4. Market Sizing

4.1 Market definition

Data Table on Offerings of companies included in the market definition

4.2 Market segment analysis

Market segments

4.3 Market size 2024

4.4 Market outlook: Forecast for 2024-2029

Chart on Global - Market size and forecast 2024-2029 ($ million)
Data Table on Global - Market size and forecast 2024-2029 ($ million)
Chart on Global Market: Year-over-year growth 2024-2029 (%)
Data Table on Global Market: Year-over-year growth 2024-2029 (%)

5. Historic Market Size

5.1 Global Non-PVC IV Bags Market 2019 - 2023

Historic Market Size - Data Table on Global Non-PVC IV Bags Market 2019 - 2023 ($ million)

5.2 Product segment analysis 2019 - 2023

Historic Market Size - Product Segment 2019 - 2023 ($ million)

5.3 Material Type segment analysis 2019 - 2023

Historic Market Size - Material Type Segment 2019 - 2023 ($ million)

5.4 Application segment analysis 2019 - 2023

Historic Market Size - Application Segment 2019 - 2023 ($ million)

5.5 Geography segment analysis 2019 - 2023

Historic Market Size - Geography Segment 2019 - 2023 ($ million)

5.6 Country segment analysis 2019 - 2023

Historic Market Size - Country Segment 2019 - 2023 ($ million)

6. Qualitative Analysis

6.1 The Impact of AI on the Global Non-PVC IV Bags Market

7. Five Forces Analysis

7.1 Five forces summary

Five forces analysis - Comparison between 2024 and 2029

7.2 Bargaining power of buyers

Bargaining power of buyers - Impact of key factors 2024 and 2029

7.3 Bargaining power of suppliers

Bargaining power of suppliers - Impact of key factors in 2024 and 2029

7.4 Threat of new entrants

Threat of new entrants - Impact of key factors in 2024 and 2029

7.5 Threat of substitutes

Threat of substitutes - Impact of key factors in 2024 and 2029

7.6 Threat of rivalry

Threat of rivalry - Impact of key factors in 2024 and 2029

7.7 Market condition

Chart on Market condition - Five forces 2024 and 2029

8. Market Segmentation by Product

8.1 Market segments

Chart on Product - Market share 2024-2029 (%)
Data Table on Product - Market share 2024-2029 (%)

8.2 Comparison by Product

Chart on Comparison by Product
Data Table on Comparison by Product

8.3 Single chamber - Market size and forecast 2024-2029

Chart on Single chamber - Market size and forecast 2024-2029 ($ million)
Data Table on Single chamber - Market size and forecast 2024-2029 ($ million)
Chart on Single chamber - Year-over-year growth 2024-2029 (%)
Data Table on Single chamber - Year-over-year growth 2024-2029 (%)

8.4 Multi chamber - Market size and forecast 2024-2029

Chart on Multi chamber - Market size and forecast 2024-2029 ($ million)
Data Table on Multi chamber - Market size and forecast 2024-2029 ($ million)
Chart on Multi chamber - Year-over-year growth 2024-2029 (%)
Data Table on Multi chamber - Year-over-year growth 2024-2029 (%)

8.5 Market opportunity by Product

Market opportunity by Product ($ million)
Data Table on Market opportunity by Product ($ million)

9. Market Segmentation by Material Type

9.1 Market segments

Chart on Market Segmentation by Material Type - Market share 2024-2029 (%)
Data Table on Market Segmentation by Material Type - Market share 2024-2029 (%)

9.2 Comparison by Market Segmentation by Material Type

Chart on Comparison by Market Segmentation by Material Type
Data Table on Comparison by Market Segmentation by Material Type

9.3 Ethylene vinyl acetate - Market size and forecast 2024-2029

Chart on Ethylene vinyl acetate - Market size and forecast 2024-2029 ($ million)
Data Table on Ethylene vinyl acetate - Market size and forecast 2024-2029 ($ million)
Chart on Ethylene vinyl acetate - Year-over-year growth 2024-2029 (%)
Data Table on Ethylene vinyl acetate - Year-over-year growth 2024-2029 (%)

9.4 Polypropylene - Market size and forecast 2024-2029

Chart on Polypropylene - Market size and forecast 2024-2029 ($ million)
Data Table on Polypropylene - Market size and forecast 2024-2029 ($ million)
Chart on Polypropylene - Year-over-year growth 2024-2029 (%)
Data Table on Polypropylene - Year-over-year growth 2024-2029 (%)

9.5 Copolyester ether - Market size and forecast 2024-2029

Chart on Copolyester ether - Market size and forecast 2024-2029 ($ million)
Data Table on Copolyester ether - Market size and forecast 2024-2029 ($ million)
Chart on Copolyester ether - Year-over-year growth 2024-2029 (%)
Data Table on Copolyester ether - Year-over-year growth 2024-2029 (%)

9.6 Market opportunity by Market Segmentation by Material Type

Market opportunity by Market Segmentation by Material Type ($ million)
Data Table on Market opportunity by Market Segmentation by Material Type ($ million)

10. Market Segmentation by Application

10.1 Market segments

Chart on Application - Market share 2024-2029 (%)
Data Table on Application - Market share 2024-2029 (%)

10.2 Comparison by Application

Chart on Comparison by Application
Data Table on Comparison by Application

10.3 Chemotherapy - Market size and forecast 2024-2029

Chart on Chemotherapy - Market size and forecast 2024-2029 ($ million)
Data Table on Chemotherapy - Market size and forecast 2024-2029 ($ million)
Chart on Chemotherapy - Year-over-year growth 2024-2029 (%)
Data Table on Chemotherapy - Year-over-year growth 2024-2029 (%)

10.4 Electrolyte and glucose infusion - Market size and forecast 2024-2029

Chart on Electrolyte and glucose infusion - Market size and forecast 2024-2029 ($ million)
Data Table on Electrolyte and glucose infusion - Market size and forecast 2024-2029 ($ million)
Chart on Electrolyte and glucose infusion - Year-over-year growth 2024-2029 (%)
Data Table on Electrolyte and glucose infusion - Year-over-year growth 2024-2029 (%)

10.5 Parenteral nutrition - Market size and forecast 2024-2029

Chart on Parenteral nutrition - Market size and forecast 2024-2029 ($ million)
Data Table on Parenteral nutrition - Market size and forecast 2024-2029 ($ million)
Chart on Parenteral nutrition - Year-over-year growth 2024-2029 (%)
Data Table on Parenteral nutrition - Year-over-year growth 2024-2029 (%)

10.6 Market opportunity by Application

Market opportunity by Application ($ million)
Data Table on Market opportunity by Application ($ million)

11. Customer Landscape

11.1 Customer landscape overview

Analysis of price sensitivity, lifecycle, customer purchase basket, adoption rates, and purchase criteria

12. Geographic Landscape

12.1 Geographic segmentation

Chart on Market share by geography 2024-2029 (%)
Data Table on Market share by geography 2024-2029 (%)

12.2 Geographic comparison

Chart on Geographic comparison
Data Table on Geographic comparison

12.3 North America - Market size and forecast 2024-2029

Chart on North America - Market size and forecast 2024-2029 ($ million)
Data Table on North America - Market size and forecast 2024-2029 ($ million)
Chart on North America - Year-over-year growth 2024-2029 (%)
Data Table on North America - Year-over-year growth 2024-2029 (%)
Chart on Regional Comparison - North America
Data Table on Regional Comparison - North America

12.3.1 US - Market size and forecast 2024-2029

Chart on US - Market size and forecast 2024-2029 ($ million)
Data Table on US - Market size and forecast 2024-2029 ($ million)
Chart on US - Year-over-year growth 2024-2029 (%)
Data Table on US - Year-over-year growth 2024-2029 (%)

12.3.2 Canada - Market size and forecast 2024-2029

Chart on Canada - Market size and forecast 2024-2029 ($ million)
Data Table on Canada - Market size and forecast 2024-2029 ($ million)
Chart on Canada - Year-over-year growth 2024-2029 (%)
Data Table on Canada - Year-over-year growth 2024-2029 (%)

12.3.3 Mexico - Market size and forecast 2024-2029

Chart on Mexico - Market size and forecast 2024-2029 ($ million)
Data Table on Mexico - Market size and forecast 2024-2029 ($ million)
Chart on Mexico - Year-over-year growth 2024-2029 (%)
Data Table on Mexico - Year-over-year growth 2024-2029 (%)

12.4 Asia - Market size and forecast 2024-2029

Chart on Asia - Market size and forecast 2024-2029 ($ million)
Data Table on Asia - Market size and forecast 2024-2029 ($ million)
Chart on Asia - Year-over-year growth 2024-2029 (%)
Data Table on Asia - Year-over-year growth 2024-2029 (%)
Chart on Regional Comparison - Asia
Data Table on Regional Comparison - Asia

12.4.1 China - Market size and forecast 2024-2029

Chart on China - Market size and forecast 2024-2029 ($ million)
Data Table on China - Market size and forecast 2024-2029 ($ million)
Chart on China - Year-over-year growth 2024-2029 (%)
Data Table on China - Year-over-year growth 2024-2029 (%)

12.4.2 Japan - Market size and forecast 2024-2029

Chart on Japan - Market size and forecast 2024-2029 ($ million)
Data Table on Japan - Market size and forecast 2024-2029 ($ million)
Chart on Japan - Year-over-year growth 2024-2029 (%)
Data Table on Japan - Year-over-year growth 2024-2029 (%)

12.4.3 India - Market size and forecast 2024-2029

Chart on India - Market size and forecast 2024-2029 ($ million)
Data Table on India - Market size and forecast 2024-2029 ($ million)
Chart on India - Year-over-year growth 2024-2029 (%)
Data Table on India - Year-over-year growth 2024-2029 (%)

12.4.4 South Korea - Market size and forecast 2024-2029

Chart on South Korea - Market size and forecast 2024-2029 ($ million)
Data Table on South Korea - Market size and forecast 2024-2029 ($ million)
Chart on South Korea - Year-over-year growth 2024-2029 (%)
Data Table on South Korea - Year-over-year growth 2024-2029 (%)

12.4.5 Indonesia - Market size and forecast 2024-2029

Chart on Indonesia - Market size and forecast 2024-2029 ($ million)
Data Table on Indonesia - Market size and forecast 2024-2029 ($ million)
Chart on Indonesia - Year-over-year growth 2024-2029 (%)
Data Table on Indonesia - Year-over-year growth 2024-2029 (%)

12.4.6 Thailand - Market size and forecast 2024-2029

Chart on Thailand - Market size and forecast 2024-2029 ($ million)
Data Table on Thailand - Market size and forecast 2024-2029 ($ million)
Chart on Thailand - Year-over-year growth 2024-2029 (%)
Data Table on Thailand - Year-over-year growth 2024-2029 (%)

12.5 Europe - Market size and forecast 2024-2029

Chart on Europe - Market size and forecast 2024-2029 ($ million)
Data Table on Europe - Market size and forecast 2024-2029 ($ million)
Chart on Europe - Year-over-year growth 2024-2029 (%)
Data Table on Europe - Year-over-year growth 2024-2029 (%)
Chart on Regional Comparison - Europe
Data Table on Regional Comparison - Europe

12.5.1 Germany - Market size and forecast 2024-2029

Chart on Germany - Market size and forecast 2024-2029 ($ million)
Data Table on Germany - Market size and forecast 2024-2029 ($ million)
Chart on Germany - Year-over-year growth 2024-2029 (%)
Data Table on Germany - Year-over-year growth 2024-2029 (%)

12.5.2 UK - Market size and forecast 2024-2029

Chart on UK - Market size and forecast 2024-2029 ($ million)
Data Table on UK - Market size and forecast 2024-2029 ($ million)
Chart on UK - Year-over-year growth 2024-2029 (%)
Data Table on UK - Year-over-year growth 2024-2029 (%)

12.5.3 France - Market size and forecast 2024-2029

Chart on France - Market size and forecast 2024-2029 ($ million)
Data Table on France - Market size and forecast 2024-2029 ($ million)
Chart on France - Year-over-year growth 2024-2029 (%)
Data Table on France - Year-over-year growth 2024-2029 (%)

12.5.4 Italy - Market size and forecast 2024-2029

Chart on Italy - Market size and forecast 2024-2029 ($ million)
Data Table on Italy - Market size and forecast 2024-2029 ($ million)
Chart on Italy - Year-over-year growth 2024-2029 (%)
Data Table on Italy - Year-over-year growth 2024-2029 (%)

12.5.5 Spain - Market size and forecast 2024-2029

Chart on Spain - Market size and forecast 2024-2029 ($ million)
Data Table on Spain - Market size and forecast 2024-2029 ($ million)
Chart on Spain - Year-over-year growth 2024-2029 (%)
Data Table on Spain - Year-over-year growth 2024-2029 (%)

12.5.6 The Netherlands - Market size and forecast 2024-2029

Chart on The Netherlands - Market size and forecast 2024-2029 ($ million)
Data Table on The Netherlands - Market size and forecast 2024-2029 ($ million)
Chart on The Netherlands - Year-over-year growth 2024-2029 (%)
Data Table on The Netherlands - Year-over-year growth 2024-2029 (%)

12.6 Rest of World (ROW) - Market size and forecast 2024-2029

Chart on Rest of World (ROW) - Market size and forecast 2024-2029 ($ million)
Data Table on Rest of World (ROW) - Market size and forecast 2024-2029 ($ million)
Chart on Rest of World (ROW) - Year-over-year growth 2024-2029 (%)
Data Table on Rest of World (ROW) - Year-over-year growth 2024-2029 (%)
Chart on Regional Comparison - Rest of World (ROW)
Data Table on Regional Comparison - Rest of World (ROW)

12.6.1 Brazil - Market size and forecast 2024-2029

Chart on Brazil - Market size and forecast 2024-2029 ($ million)
Data Table on Brazil - Market size and forecast 2024-2029 ($ million)
Chart on Brazil - Year-over-year growth 2024-2029 (%)
Data Table on Brazil - Year-over-year growth 2024-2029 (%)

12.6.2 Saudi Arabia - Market size and forecast 2024-2029

Chart on Saudi Arabia - Market size and forecast 2024-2029 ($ million)
Data Table on Saudi Arabia - Market size and forecast 2024-2029 ($ million)
Chart on Saudi Arabia - Year-over-year growth 2024-2029 (%)
Data Table on Saudi Arabia - Year-over-year growth 2024-2029 (%)

12.6.3 UAE - Market size and forecast 2024-2029

Chart on UAE - Market size and forecast 2024-2029 ($ million)
Data Table on UAE - Market size and forecast 2024-2029 ($ million)
Chart on UAE - Year-over-year growth 2024-2029 (%)
Data Table on UAE - Year-over-year growth 2024-2029 (%)

12.6.4 Turkey - Market size and forecast 2024-2029

Chart on Turkey - Market size and forecast 2024-2029 ($ million)
Data Table on Turkey - Market size and forecast 2024-2029 ($ million)
Chart on Turkey - Year-over-year growth 2024-2029 (%)
Data Table on Turkey - Year-over-year growth 2024-2029 (%)

12.6.5 Argentina - Market size and forecast 2024-2029

Chart on Argentina - Market size and forecast 2024-2029 ($ million)
Data Table on Argentina - Market size and forecast 2024-2029 ($ million)
Chart on Argentina - Year-over-year growth 2024-2029 (%)
Data Table on Argentina - Year-over-year growth 2024-2029 (%)

12.6.6 Colombia - Market size and forecast 2024-2029

Chart on Colombia - Market size and forecast 2024-2029 ($ million)
Data Table on Colombia - Market size and forecast 2024-2029 ($ million)
Chart on Colombia - Year-over-year growth 2024-2029 (%)
Data Table on Colombia - Year-over-year growth 2024-2029 (%)

12.6.7 South Africa - Market size and forecast 2024-2029

Chart on South Africa - Market size and forecast 2024-2029 ($ million)
Data Table on South Africa - Market size and forecast 2024-2029 ($ million)
Chart on South Africa - Year-over-year growth 2024-2029 (%)
Data Table on South Africa - Year-over-year growth 2024-2029 (%)

12.6.8 Israel - Market size and forecast 2024-2029

Chart on Israel - Market size and forecast 2024-2029 ($ million)
Data Table on Israel - Market size and forecast 2024-2029 ($ million)
Chart on Israel - Year-over-year growth 2024-2029 (%)
Data Table on Israel - Year-over-year growth 2024-2029 (%)

12.7 Market opportunity by geography

Market opportunity by geography ($ million)
Data Tables on Market opportunity by geography ($ million)

13. Drivers, Challenges, and Opportunity

13.1 Market drivers

Regulatory and clinical focus on patient safety
Increasing environmental concerns
Increase number of hospitals and medical facilities

13.2 Market challenges

High costs and regulatory barriers
Availability of counterfeit products
Material compatibility and drug stability

13.3 Impact of drivers and challenges

Impact of drivers and challenges in 2024 and 2029

13.4 Market opportunities

Integration of smart technology and sustainability
Increasing product launches by key players
Healthcare infrastructure growth

14. Competitive Landscape

14.1 Overview

14.2

Overview on criticality of inputs and factors of differentiation

14.3 Landscape disruption

Overview on factors of disruption

14.4 Industry risks

Impact of key risks on business

15. Competitive Analysis

15.1 Companies profiled

Companies covered

15.2 Company ranking index

15.3 Market positioning of companies

Matrix on companies position and classification

15.4 ANGIPLAST Pvt. Ltd.

ANGIPLAST Pvt. Ltd. - Overview
ANGIPLAST Pvt. Ltd. - Product / Service
ANGIPLAST Pvt. Ltd. - Key offerings
SWOT

15.5 B.Braun SE

B.Braun SE - Overview
B.Braun SE - Product / Service
B.Braun SE - Key news
B.Braun SE - Key offerings
SWOT

15.6 Baxter International Inc.

Baxter International Inc. - Overview
Baxter International Inc. - Business segments
Baxter International Inc. - Key news
Baxter International Inc. - Key offerings
Baxter International Inc. - Segment focus
SWOT

15.7 Fresenius SE and Co. KGaA

Fresenius SE and Co. KGaA - Overview
Fresenius SE and Co. KGaA - Business segments
Fresenius SE and Co. KGaA - Key news
Fresenius SE and Co. KGaA - Key offerings
Fresenius SE and Co. KGaA - Segment focus
SWOT

15.8 Haemotronic Spa

Haemotronic Spa - Overview
Haemotronic Spa - Product / Service
Haemotronic Spa - Key offerings
SWOT

15.9 ICU Medical Inc.

ICU Medical Inc. - Overview
ICU Medical Inc. - Product / Service
ICU Medical Inc. - Key offerings
SWOT

15.10 JW Life Science Corp.

JW Life Science Corp. - Overview
JW Life Science Corp. - Product / Service
JW Life Science Corp. - Key offerings
SWOT

15.11 Medline Industries LP

Medline Industries LP - Overview
Medline Industries LP - Product / Service
Medline Industries LP - Key offerings
SWOT

15.12 Ningbo Siny Medical Technology

Ningbo Siny Medical Technology - Overview
Ningbo Siny Medical Technology - Product / Service
Ningbo Siny Medical Technology - Key offerings
SWOT

15.13 Otsuka Holdings Co. Ltd.

Otsuka Holdings Co. Ltd. - Overview
Otsuka Holdings Co. Ltd. - Business segments
Otsuka Holdings Co. Ltd. - Key news
Otsuka Holdings Co. Ltd. - Key offerings
Otsuka Holdings Co. Ltd. - Segment focus
SWOT

15.14 POLYCINE GmbH

POLYCINE GmbH - Overview
POLYCINE GmbH - Product / Service
POLYCINE GmbH - Key offerings
SWOT

15.15 RENOLIT SE

RENOLIT SE - Overview
RENOLIT SE - Product / Service
RENOLIT SE - Key offerings
SWOT

15.16 Rusoma Laboratories Pvt. Ltd.

Rusoma Laboratories Pvt. Ltd. - Overview
Rusoma Laboratories Pvt. Ltd. - Product / Service
Rusoma Laboratories Pvt. Ltd. - Key offerings
SWOT

15.17 Sartorius AG

Sartorius AG - Overview
Sartorius AG - Business segments
Sartorius AG - Key news
Sartorius AG - Key offerings
Sartorius AG - Segment focus
SWOT

15.18 Shanghai IVEN Pharmatech

Shanghai IVEN Pharmatech - Overview
Shanghai IVEN Pharmatech - Product / Service
Shanghai IVEN Pharmatech - Key offerings
SWOT

16. Appendix

16.1 Scope of the report

Market definition
Objectives
Notes and caveats

16.2 Inclusions and exclusions checklist

Inclusions checklist
Exclusions checklist

16.3 Currency conversion rates for US$

16.4 Research methodology

16.5 Data procurement

Information sources

16.6 Data validation

16.7 Validation techniques employed for market sizing

16.8 Data synthesis

16.9 360 degree market analysis

16.10 List of abbreviations

Research Methodology

Technavio presents a detailed picture of the market by way of study, synthesis, and summation of data from multiple sources. The analysts have presented the various facets of the market with a particular focus on identifying the key industry influencers. The data thus presented is comprehensive, reliable, and the result of extensive research, both primary and secondary.

INFORMATION SOURCES

Primary sources

  • Manufacturers and suppliers
  • Channel partners
  • Industry experts
  • Strategic decision makers

Secondary sources

  • Industry journals and periodicals
  • Government data
  • Financial reports of key industry players
  • Historical data
  • Press releases

DATA ANALYSIS

Data Synthesis

  • Collation of data
  • Estimation of key figures
  • Analysis of derived insights

Data Validation

  • Triangulation with data models
  • Reference against proprietary databases
  • Corroboration with industry experts

REPORT WRITING

Qualitative

  • Market drivers
  • Market challenges
  • Market trends
  • Five forces analysis

Quantitative

  • Market size and forecast
  • Market segmentation
  • Geographical insights
  • Competitive landscape

Interested in this report?

Get your sample now to see our research methodology and insights!

Download Now

Frequently Asked Questions

Non-pvc IV Bags market growth will increase by USD 714.7 million during 2025-2029 .

The Non-pvc IV Bags market is expected to grow at a CAGR of 6.3% during 2025-2029 .

Non-pvc IV Bags market is segmented by Product (Single chamber, Multi chamber) Material type (Ethylene vinyl acetate, Polypropylene, Copolyester ether) Application (Chemotherapy, Electrolyte and glucose infusion, Parenteral nutrition)

ANGIPLAST Pvt. Ltd., B.Braun SE, Baxter International Inc., Fresenius SE and Co. KGaA, Haemotronic Spa, ICU Medical Inc., JW Life Science Corp., Medline Industries LP, Ningbo Siny Medical Technology, Otsuka Holdings Co. Ltd., POLYCINE GmbH, RENOLIT SE, Rusoma Laboratories Pvt. Ltd., Sartorius AG, Shanghai IVEN Pharmatech, Silica Healthcare Pvt. Ltd., Spirit Medical Ltd., SSY Group Ltd., Taj Pharmaceuticals Ltd., Technoflex are a few of the key vendors in the Non-pvc IV Bags market.

North America will register the highest growth rate of 33% among the other regions. Therefore, the Non-pvc IV Bags market in North America is expected to garner significant business opportunities for the vendors during the forecast period.

US, Canada, Mexico, China, Japan, India, South Korea, Indonesia, Thailand, Germany, UK, France, Italy, Spain, The Netherlands, Brazil, Saudi Arabia, UAE, Turkey, Argentina, Colombia, South Africa, Israel

  • Regulatory and clinical focus on patient safety is the driving factor this market.

The Non-pvc IV Bags market vendors should focus on grabbing business opportunities from the Product segment as it accounted for the largest market share in the base year.