Offshore Support Vessel Market Analysis, Size, and Forecast 2026-2030: North America (US, Canada, and Mexico), Europe (UK, The Netherlands, and Germany), APAC (China, Australia, and India), Middle East and Africa (Saudi Arabia, UAE, and Turkey), South America (Brazil and Argentina), and Rest of World (ROW)

Offshore Support Vessel Market Analysis, Size, and Forecast 2026-2030:
North America (US, Canada, and Mexico), Europe (UK, The Netherlands, and Germany), APAC (China, Australia, and India), Middle East and Africa (Saudi Arabia, UAE, and Turkey), South America (Brazil and Argentina), and Rest of World (ROW)

Published: Dec 2025 298 Pages SKU: IRTNTR72777

Market Overview at a Glance

$702.2 Mn
Market Opportunity
6.1%
CAGR 2025 - 2030
48.2%
North America Growth
$1.05 B
AHTS segment 2024

Offshore Support Vessel Market Size 2026-2030

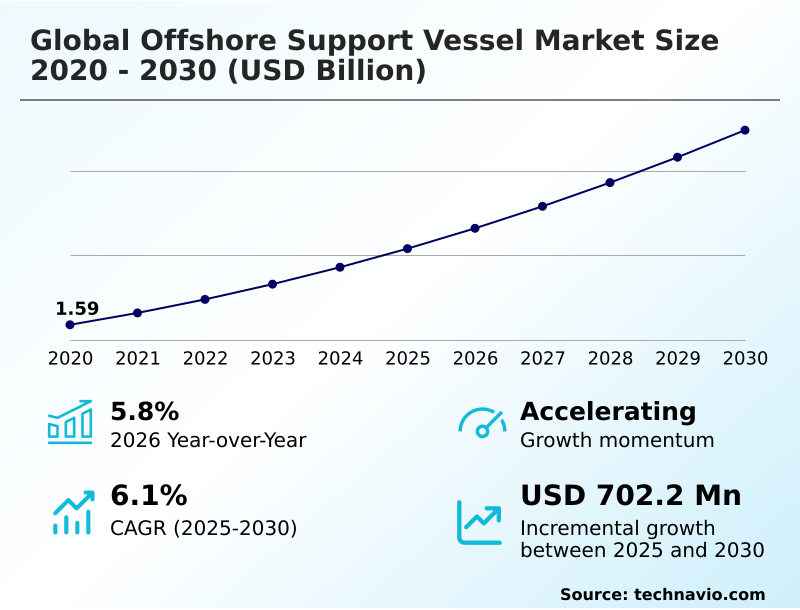
The offshore support vessel market size is valued to increase by USD 702.2 million, at a CAGR of 6.1% from 2025 to 2030. Heightened deepwater exploration and production activity will drive the offshore support vessel market.

Major Market Trends & Insights

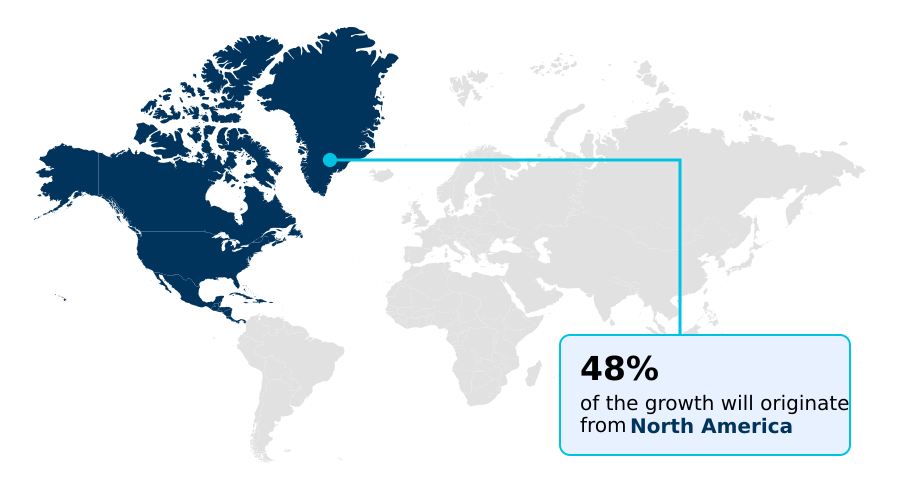
  • North America dominated the market and accounted for a 48.2% growth during the forecast period.
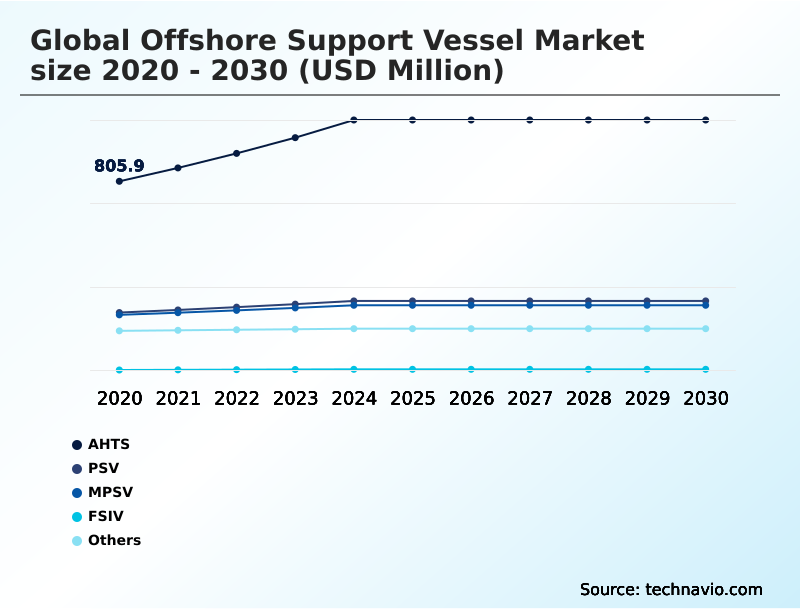
  • By Product - AHTS segment was valued at USD 1.05 billion in 2024
  • By Application - Oil and gas segment accounted for the largest market revenue share in 2024

Market Size & Forecast

  • Market Opportunities: USD 1.16 billion
  • Market Future Opportunities: USD 702.2 million
  • CAGR from 2025 to 2030 : 6.1%

Market Summary

  • The offshore support vessel market is undergoing a significant transformation, propelled by dual demand streams from heightened deepwater exploration and production and the rapid expansion of the offshore renewable energy sector. Core to this market are specialized vessels such as the anchor handling tug supply and the platform supply vessel, which are fundamental for offshore logistics and subsea construction.
  • A pivotal trend is the strategic diversification into offshore wind farm construction, which necessitates a new generation of assets like the wind turbine installation vessel and service operation vessel. This shift introduces opportunities for operators to secure long-term contracts outside the cyclical oil and gas industry.
  • For instance, a fleet operator might pivot from supporting traditional floating production units to deploying a specialized commissioning service operation vessel for a new wind farm, a decision impacting capital allocation for methanol-ready vessel designs and advanced hybrid propulsion systems.
  • Concurrently, the industry is navigating challenges from stringent decarbonization mandates and a shortage of qualified maritime professionals, pushing operators toward greater adoption of digital automation and predictive maintenance to enhance efficiency and de-risk operations.

What will be the Size of the Offshore Support Vessel Market during the forecast period?

Get Key Insights on Market Forecast (PDF) Request Free Sample

How is the Offshore Support Vessel Market Segmented?

The offshore support vessel industry research report provides comprehensive data (region-wise segment analysis), with forecasts and estimates in "USD million" for the period 2026-2030, as well as historical data from 2020-2024 for the following segments.

  • Product
    • AHTS
    • PSV
    • MPSV
    • FSIV
    • Others
  • Application
    • Oil and gas
    • Offshore applications
  • Fuel type
    • Diesel powered
    • Gas powered
  • Geography
    • North America
      • US
      • Canada
      • Mexico
    • Europe
      • UK
      • The Netherlands
      • Germany
    • APAC
      • China
      • Australia
      • India
    • Middle East and Africa
      • Saudi Arabia
      • UAE
      • Turkey
    • South America
      • Brazil
      • Argentina
    • Rest of World (ROW)

By Product Insights

The ahts segment is estimated to witness significant growth during the forecast period.

The anchor handling tug supply (AHTS) segment represents a critical component of the offshore support vessel market, defined by its role in deepwater drilling operations.

These vessels are essential for mooring floating production units and supporting heavy-lift operations in challenging environments like pre-salt basins.

Demand for high-capacity AHTS vessels, including advanced dual-fuel vessel models, is directly tied to complex offshore projects that require sophisticated marine transportation services.

The market for these deepwater applications is also seeing a push toward more capable vessels for subsea construction vessel support.

A key performance indicator shows leading-edge term contract day rates for high-specification AHTS vessels have improved by 13%, reflecting tight supply and sustained demand for advanced anchor handling tug supply capabilities.

Request Free Sample

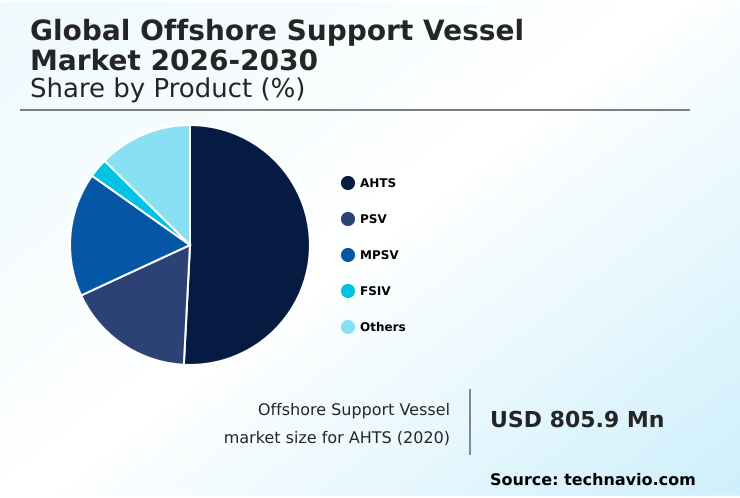
The AHTS segment was valued at USD 1.05 billion in 2024 and showed a gradual increase during the forecast period.

Request Free Sample

Regional Analysis

North America is estimated to contribute 48.2% to the growth of the global market during the forecast period.Technavio’s analysts have elaborately explained the regional trends and drivers that shape the market during the forecast period.

See How Offshore Support Vessel Market Demand is Rising in North America Request Free Sample

The geographic landscape of the market is diversifying, driven by distinct regional activities.

In North America, growth is fueled by both traditional energy and a burgeoning renewables sector, with new fields in the Gulf of Mexico expected to add significant production, while the East Coast focuses on offshore wind.

Europe is a leader in offshore renewable energy, with one nation targeting 50 gigawatts of offshore wind capacity by 2030, which requires extensive offshore logistics.

The APAC region is experiencing a surge in activity, with exploration and production vessel spending projected to increase by 17%. The Middle East is characterized by major sour gas development projects.

This global activity supports demand for the multipurpose support vessel, fast support intervention vessel, and vessels with advanced dynamic positioning systems to service both shallow water applications and deepwater operations.

Market Dynamics

Our researchers analyzed the data with 2025 as the base year, along with the key drivers, trends, and challenges. A holistic analysis of drivers will help companies refine their marketing strategies to gain a competitive advantage.

  • Strategic fleet management in the OSV market is becoming increasingly complex as operators navigate the dual demands of traditional energy and renewables. Success depends on mastering digitalization in offshore vessel operations and investing in autonomous offshore support vessel technology to improve efficiency and safety.
  • The push for low-emission hybrid offshore support vessels is driven by stringent regulatory compliance for offshore vessels and client demand for sustainability. Advanced subsea construction support vessels are critical for developing deepwater fields and the infrastructure for offshore hydrogen production.
  • Specialized vessels for offshore wind projects, including next-generation wind turbine installation vessels and support vessels for floating wind farms, represent a significant growth vector. Optimizing OSV logistics for deepwater fields through technologies like advanced anchor handling for floating production units can yield uptime improvements of over 15% compared to conventional methods.
  • However, operators must balance the high cost of OSV fleet modernization and OSV inspection and maintenance technologies against geopolitical risks and a persistent shortage of skilled crews. This environment favors operators who can effectively manage OSV demand for oil and gas decommissioning while simultaneously capturing opportunities in emerging sectors like OSV for sour gas field development.

What are the key market drivers leading to the rise in the adoption of Offshore Support Vessel Industry?

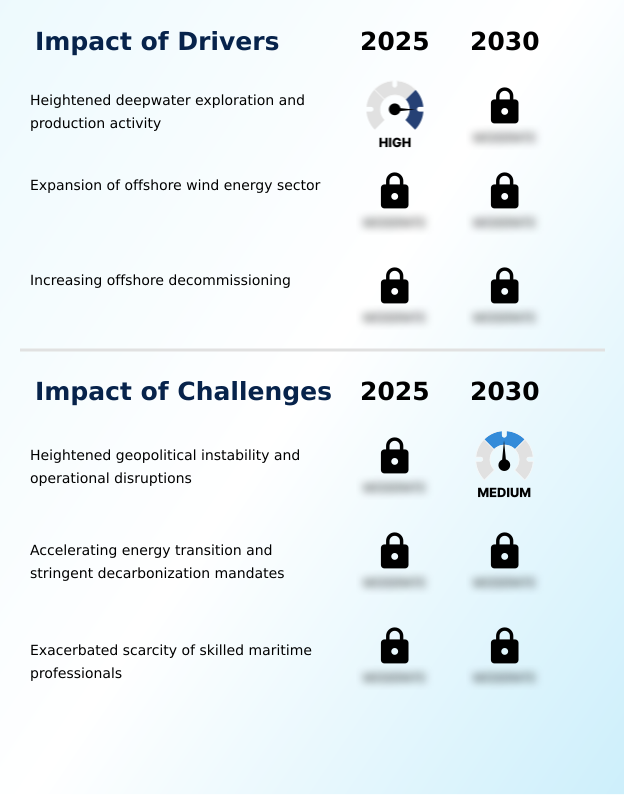
  • Heightened deepwater exploration and production activity, driven by global energy demand, is a key driver for the offshore support vessel market.

  • Market growth is propelled by robust activity in both traditional and renewable energy sectors. Sustained offshore exploration and production, particularly high-pressure projects in deepwater basins, drive demand for a range of support vessels.
  • Simultaneously, the global expansion of offshore wind farm construction creates a long-term need for specialized assets like the commissioning service operation vessel and cable laying vessel.
  • For instance, one major European auction recently awarded capacity for 10.5 GW of new offshore wind development.
  • Another significant driver is the increasing pace of offshore decommissioning, with one key region forecasting the need for well plugging and abandonment for over 2,000 wells.
  • This regulatory-driven work, along with subsea infrastructure removal, ensures a stable demand for vessels capable of supporting the entire lifecycle of offshore energy infrastructure.

What are the market trends shaping the Offshore Support Vessel Industry?

  • A key market trend involves the strategic diversification of offshore support vessel operators. This transition is driven by increasing integration with the burgeoning offshore renewable energy sector, particularly offshore wind.

  • Key market trends reflect a strategic pivot towards the offshore renewable energy sector and accelerated digital automation. The demand for specialized assets such as the wind turbine installation vessel and service operation vessel is surging, with day rates in mature markets increasing by over 25% year-over-year.
  • This has spurred innovation in vessel design, including the development of a methanol-ready vessel design to meet sustainability goals tied to the energy transition. Simultaneously, the adoption of the uncrewed surface vessel and remotely operated vehicle for remote operations is transforming subsea work. Industry leaders are making significant investments in their autonomous fleets, with plans to release specialized survey vessels.
  • This move toward remote operations centers and digital technologies is a response to the need for greater efficiency and safety, while fleet consolidation remains a key strategy for financial stability.

What challenges does the Offshore Support Vessel Industry face during its growth?

  • Heightened geopolitical instability and resulting operational disruptions present a key challenge affecting industry growth.

  • The market faces significant operational and financial challenges, primarily from stringent decarbonization mandates and a shortage of qualified maritime professionals. The implementation of new environmental regulations, such as a 2% greenhouse gas intensity reduction starting in 2025, forces operators to invest in costly hybrid propulsion systems and LNG-powered vessels.
  • This is compounded by a shortage of specialized assets required to meet ambitious renewable energy targets, such as the deployment of 30 gigawatts of offshore wind in the US. The need for advanced crew transfer vessel fleets with features like walk-to-walk gangways further strains the limited pool of skilled seafarers.
  • Moreover, geopolitical instability elevates operational risks and insurance costs, impacting profitability and complicating the adoption of technologies like predictive maintenance and autonomous systems needed for long-term efficiency.

Exclusive Technavio Analysis on Customer Landscape

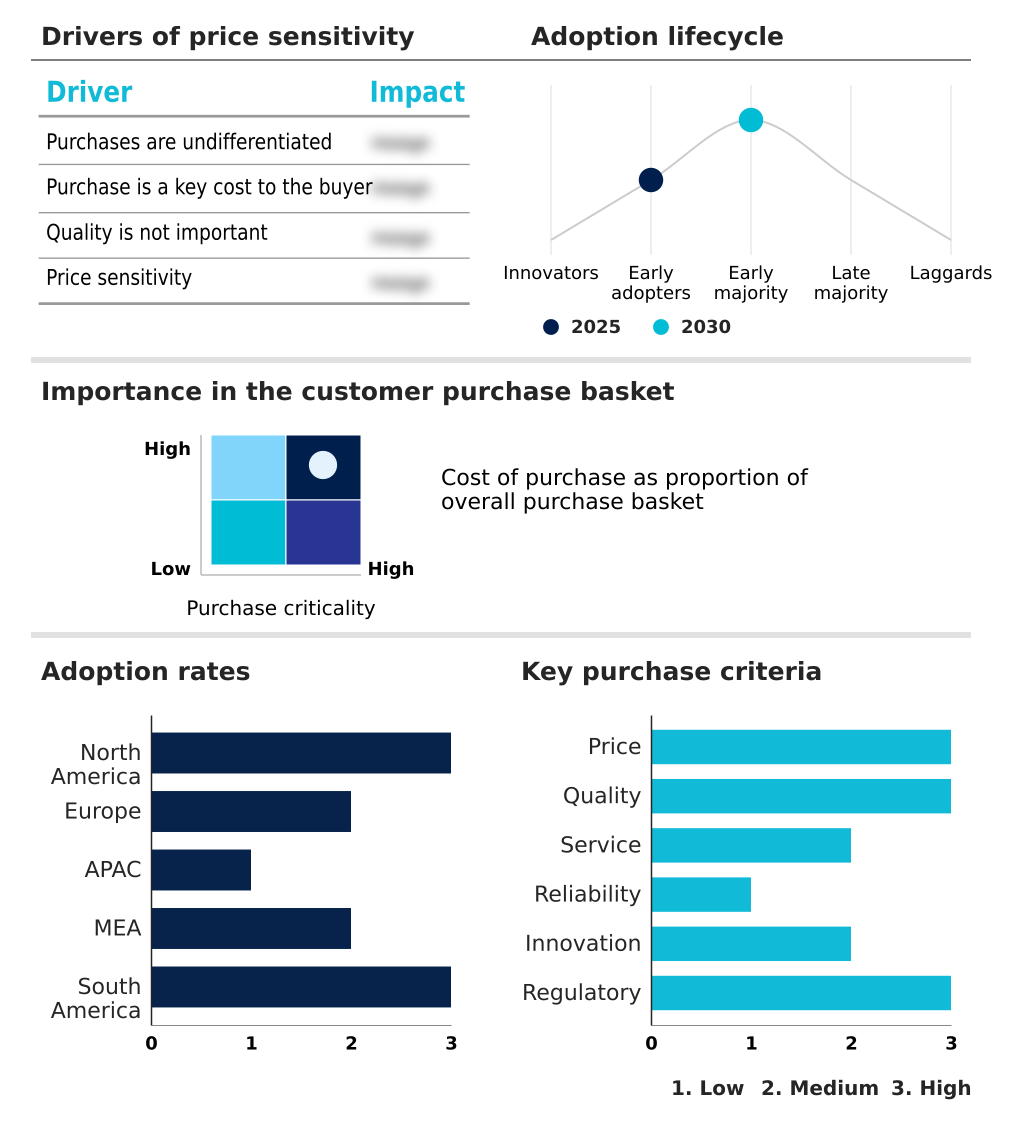
The offshore support vessel market forecasting report includes the adoption lifecycle of the market, covering from the innovator’s stage to the laggard’s stage. It focuses on adoption rates in different regions based on penetration. Furthermore, the offshore support vessel market report also includes key purchase criteria and drivers of price sensitivity to help companies evaluate and develop their market growth analysis strategies.

Customer Landscape of Offshore Support Vessel Industry

Competitive Landscape

Companies are implementing various strategies, such as strategic alliances, offshore support vessel market forecast, partnerships, mergers and acquisitions, geographical expansion, and product/service launches, to enhance their presence in the industry.

BOURBON Maritime - Delivers specialized maritime services for deepwater oil, gas, and wind farm operations, supporting complex subsea, transport, and anchor handling tasks.

The industry research and growth report includes detailed analyses of the competitive landscape of the market and information about key companies, including:

  • BOURBON Maritime
  • CNOOC Ltd.
  • Damen Shipyards Group
  • DP World
  • Eastern Shipbuilding Inc.
  • Edison Chouest Offshore Co.
  • Fincantieri Spa
  • Harvey Gulf Intl. Marine LLC
  • Hornbeck Offshore Services
  • Maersk Supply Service
  • New DOF ASA
  • Sea1 Offshore
  • SEACOR Marine Holdings Inc.
  • ST Engineering Ltd.
  • Tidewater Inc.
  • Zamil Offshore Services Co.

Qualitative and quantitative analysis of companies has been conducted to help clients understand the wider business environment as well as the strengths and weaknesses of key industry players. Data is qualitatively analyzed to categorize companies as pure play, category-focused, industry-focused, and diversified; it is quantitatively analyzed to categorize companies as dominant, leading, strong, tentative, and weak.

Recent Development and News in Offshore support vessel market

  • In October, 2024, Atlantic Shores, a joint venture between Shell New Energies and EDF Renewables, received its final construction and operational planning approval for a 2,800 MW offshore wind development off the coast of New Jersey.
  • In December, 2024, Petrobras announced contracts for the construction and chartering of 12 new hybrid-propulsion platform supply vessels with Brazilian firms Bram Offshore and Starnav Servicos Maritimos.
  • In January, 2025, Equinor awarded pre-front-end engineering and design contracts to BW Offshore and Altera Infrastructure for the floating production, storage, and offloading unit for its Bay du Nord deepwater project in Canada.
  • In May, 2025, Turkey announced a major natural gas discovery at the Goktepe-3 well in the Black Sea, made by its advanced drilling vessel, the Abdulhamid Han, significantly increasing the nation's domestic energy reserves.

Dive into Technavio’s robust research methodology, blending expert interviews, extensive data synthesis, and validated models for unparalleled Offshore Support Vessel Market insights. See full methodology.

Market Scope
Page number 298
Base year 2025
Historic period 2020-2024
Forecast period 2026-2030
Growth momentum & CAGR Accelerate at a CAGR of 6.1%
Market growth 2026-2030 USD 702.2 million
Market structure Fragmented
YoY growth 2025-2026(%) 5.8%
Key countries US, Canada, Mexico, UK, The Netherlands, Germany, France, Italy, Spain, China, Australia, India, Indonesia, South Korea, Japan, Saudi Arabia, UAE, Turkey, Israel, South Africa, Brazil, Argentina and Chile
Competitive landscape Leading Companies, Market Positioning of Companies, Competitive Strategies, and Industry Risks

Request Free Sample

Research Analyst Overview

  • The offshore support vessel market is characterized by a significant structural shift as operators adapt to the global energy transition. This evolution requires substantial capital for fleet modernization, including investment in assets like the accommodation work barge, dual-fuel vessel, and specialized subsea construction vessel.
  • Demand is robust for both traditional oil and gas projects, involving well plugging and abandonment, and the rapidly expanding renewables sector, which requires the wind turbine installation vessel and service operation vessel. A key boardroom focus is balancing investment in a methanol-ready vessel design against retrofitting existing fleets with hybrid propulsion systems.
  • The market's tight supply is evident, with day rates for some specialized vessels increasing by 25% to 35%, reflecting the high demand for advanced capabilities.
  • Operators are increasingly utilizing the uncrewed surface vessel and remotely operated vehicle for subsea inspection maintenance repair and other offshore logistics, driving a need for new skill sets and operational models to manage these assets effectively. This dynamic environment places a premium on versatile, technologically advanced fleets capable of serving diverse energy segments.

What are the Key Data Covered in this Offshore Support Vessel Market Research and Growth Report?

  • What is the expected growth of the Offshore Support Vessel Market between 2026 and 2030?

    • USD 702.2 million, at a CAGR of 6.1%

  • What segmentation does the market report cover?

    • The report is segmented by Product (AHTS, PSV, MPSV, FSIV, and Others), Application (Oil and gas, and Offshore applications), Fuel Type (Diesel powered, and Gas powered) and Geography (North America, Europe, APAC, Middle East and Africa, South America)

  • Which regions are analyzed in the report?

    • North America, Europe, APAC, Middle East and Africa and South America

  • What are the key growth drivers and market challenges?

    • Heightened deepwater exploration and production activity, Heightened geopolitical instability and operational disruptions

  • Who are the major players in the Offshore Support Vessel Market?

    • BOURBON Maritime, CNOOC Ltd., Damen Shipyards Group, DP World, Eastern Shipbuilding Inc., Edison Chouest Offshore Co., Fincantieri Spa, Harvey Gulf Intl. Marine LLC, Hornbeck Offshore Services, Maersk Supply Service, New DOF ASA, Sea1 Offshore, SEACOR Marine Holdings Inc., ST Engineering Ltd., Tidewater Inc. and Zamil Offshore Services Co.

Market Research Insights

  • Market dynamics are shaped by a dual focus on offshore exploration and production and the expanding offshore renewable energy sector. This has intensified demand for specialized marine transportation services, with day rates for certain high-specification vessels increasing by as much as 35% year-over-year.
  • As operators engage in deepwater drilling operations and subsea tie-back projects, the need for a modern, Jones Act compliant fleet becomes more critical, particularly in burgeoning offshore wind markets. The industry is also seeing a strategic push toward fleet consolidation to optimize assets and improve financial stability.
  • This evolving landscape requires significant investment in advanced technologies to support complex offshore energy infrastructure and capitalize on long-term contracts in both traditional and renewable segments.

We can help! Our analysts can customize this offshore support vessel market research report to meet your requirements.

Get in touch

1. Executive Summary

1.1 Market overview

Executive Summary - Chart on Market Overview
Executive Summary - Data Table on Market Overview
Executive Summary - Chart on Global Market Characteristics
Executive Summary - Chart on Market by Geography
Executive Summary - Chart on Market Segmentation by Product
Executive Summary - Chart on Market Segmentation by Application
Executive Summary - Chart on Market Segmentation by Fuel Type
Executive Summary - Chart on Incremental Growth
Executive Summary - Data Table on Incremental Growth
Executive Summary - Chart on Company Market Positioning

2. Technavio Analysis

2.1 Analysis of price sensitivity, lifecycle, customer purchase basket, adoption rates, and purchase criteria

2.2 Criticality of inputs and Factors of differentiation

Chart on Overview on criticality of inputs and factors of differentiation

2.3 Factors of disruption

Chart on Overview on factors of disruption

2.4 Impact of drivers and challenges

Chart on Impact of drivers and challenges in 2025 and 2030

3. Market Landscape

3.1 Market ecosystem

Chart on Parent Market
Data Table on - Parent Market

3.2 Market characteristics

Chart on Market characteristics analysis

3.3 Value chain analysis

Chart on Value chain analysis

4. Market Sizing

4.1 Market definition

Data Table on Offerings of companies included in the market definition

4.2 Market segment analysis

Market segments

4.3 Market size 2025

4.4 Market outlook: Forecast for 2025-2030

Chart on Global - Market size and forecast 2025-2030 ($ million)
Data Table on Global - Market size and forecast 2025-2030 ($ million)
Chart on Global Market: Year-over-year growth 2025-2030 (%)
Data Table on Global Market: Year-over-year growth 2025-2030 (%)

5. Historic Market Size

5.1 Global Offshore Support Vessel Market 2020 - 2024

Historic Market Size - Data Table on Global Offshore Support Vessel Market 2020 - 2024 ($ million)

5.2 Product segment analysis 2020 - 2024

Historic Market Size - Product Segment 2020 - 2024 ($ million)

5.3 Application segment analysis 2020 - 2024

Historic Market Size - Application Segment 2020 - 2024 ($ million)

5.4 Fuel Type segment analysis 2020 - 2024

Historic Market Size - Fuel Type Segment 2020 - 2024 ($ million)

5.5 Geography segment analysis 2020 - 2024

Historic Market Size - Geography Segment 2020 - 2024 ($ million)

5.6 Country segment analysis 2020 - 2024

Historic Market Size - Country Segment 2020 - 2024 ($ million)

6. Qualitative Analysis

6.1 The AI impact on Global Offshore Support Vessel Market

7. Five Forces Analysis

7.1 Five forces summary

Five forces analysis - Comparison between 2025 and 2030

7.2 Bargaining power of buyers

Bargaining power of buyers - Impact of key factors 2025 and 2030

7.3 Bargaining power of suppliers

Bargaining power of suppliers - Impact of key factors in 2025 and 2030

7.4 Threat of new entrants

Threat of new entrants - Impact of key factors in 2025 and 2030

7.5 Threat of substitutes

Threat of substitutes - Impact of key factors in 2025 and 2030

7.6 Threat of rivalry

Threat of rivalry - Impact of key factors in 2025 and 2030

7.7 Market condition

Chart on Market condition - Five forces 2025 and 2030

8. Market Segmentation by Product

8.1 Market segments

Chart on Product - Market share 2025-2030 (%)
Data Table on Product - Market share 2025-2030 (%)

8.2 Comparison by Product

Chart on Comparison by Product
Data Table on Comparison by Product

8.3 AHTS - Market size and forecast 2025-2030

Chart on AHTS - Market size and forecast 2025-2030 ($ million)
Data Table on AHTS - Market size and forecast 2025-2030 ($ million)
Chart on AHTS - Year-over-year growth 2025-2030 (%)
Data Table on AHTS - Year-over-year growth 2025-2030 (%)

8.4 PSV - Market size and forecast 2025-2030

Chart on PSV - Market size and forecast 2025-2030 ($ million)
Data Table on PSV - Market size and forecast 2025-2030 ($ million)
Chart on PSV - Year-over-year growth 2025-2030 (%)
Data Table on PSV - Year-over-year growth 2025-2030 (%)

8.5 MPSV - Market size and forecast 2025-2030

Chart on MPSV - Market size and forecast 2025-2030 ($ million)
Data Table on MPSV - Market size and forecast 2025-2030 ($ million)
Chart on MPSV - Year-over-year growth 2025-2030 (%)
Data Table on MPSV - Year-over-year growth 2025-2030 (%)

8.6 FSIV - Market size and forecast 2025-2030

Chart on FSIV - Market size and forecast 2025-2030 ($ million)
Data Table on FSIV - Market size and forecast 2025-2030 ($ million)
Chart on FSIV - Year-over-year growth 2025-2030 (%)
Data Table on FSIV - Year-over-year growth 2025-2030 (%)

8.7 Others - Market size and forecast 2025-2030

Chart on Others - Market size and forecast 2025-2030 ($ million)
Data Table on Others - Market size and forecast 2025-2030 ($ million)
Chart on Others - Year-over-year growth 2025-2030 (%)
Data Table on Others - Year-over-year growth 2025-2030 (%)

8.8 Market opportunity by Product

Market opportunity by Product ($ million)
Data Table on Market opportunity by Product ($ million)

9. Market Segmentation by Application

9.1 Market segments

Chart on Application - Market share 2025-2030 (%)
Data Table on Application - Market share 2025-2030 (%)

9.2 Comparison by Application

Chart on Comparison by Application
Data Table on Comparison by Application

9.3 Oil and gas - Market size and forecast 2025-2030

Chart on Oil and gas - Market size and forecast 2025-2030 ($ million)
Data Table on Oil and gas - Market size and forecast 2025-2030 ($ million)
Chart on Oil and gas - Year-over-year growth 2025-2030 (%)
Data Table on Oil and gas - Year-over-year growth 2025-2030 (%)

9.4 Offshore applications - Market size and forecast 2025-2030

Chart on Offshore applications - Market size and forecast 2025-2030 ($ million)
Data Table on Offshore applications - Market size and forecast 2025-2030 ($ million)
Chart on Offshore applications - Year-over-year growth 2025-2030 (%)
Data Table on Offshore applications - Year-over-year growth 2025-2030 (%)

9.5 Market opportunity by Application

Market opportunity by Application ($ million)
Data Table on Market opportunity by Application ($ million)

10. Market Segmentation by Fuel Type

10.1 Market segments

Chart on Fuel Type - Market share 2025-2030 (%)
Data Table on Fuel Type - Market share 2025-2030 (%)

10.2 Comparison by Fuel Type

Chart on Comparison by Fuel Type
Data Table on Comparison by Fuel Type

10.3 Diesel powered - Market size and forecast 2025-2030

Chart on Diesel powered - Market size and forecast 2025-2030 ($ million)
Data Table on Diesel powered - Market size and forecast 2025-2030 ($ million)
Chart on Diesel powered - Year-over-year growth 2025-2030 (%)
Data Table on Diesel powered - Year-over-year growth 2025-2030 (%)

10.4 Gas powered - Market size and forecast 2025-2030

Chart on Gas powered - Market size and forecast 2025-2030 ($ million)
Data Table on Gas powered - Market size and forecast 2025-2030 ($ million)
Chart on Gas powered - Year-over-year growth 2025-2030 (%)
Data Table on Gas powered - Year-over-year growth 2025-2030 (%)

10.5 Market opportunity by Fuel Type

Market opportunity by Fuel Type ($ million)
Data Table on Market opportunity by Fuel Type ($ million)

11. Customer Landscape

11.1 Customer landscape overview

Analysis of price sensitivity, lifecycle, customer purchase basket, adoption rates, and purchase criteria

12. Geographic Landscape

12.1 Geographic segmentation

Chart on Market share by geography 2025-2030 (%)
Data Table on Market share by geography 2025-2030 (%)

12.2 Geographic comparison

Chart on Geographic comparison
Data Table on Geographic comparison

12.3 North America - Market size and forecast 2025-2030

Chart on North America - Market size and forecast 2025-2030 ($ million)
Data Table on North America - Market size and forecast 2025-2030 ($ million)
Chart on North America - Year-over-year growth 2025-2030 (%)
Data Table on North America - Year-over-year growth 2025-2030 (%)
Chart on Regional Comparison - North America
Data Table on Regional Comparison - North America

12.3.1 US - Market size and forecast 2025-2030

Chart on US - Market size and forecast 2025-2030 ($ million)
Data Table on US - Market size and forecast 2025-2030 ($ million)
Chart on US - Year-over-year growth 2025-2030 (%)
Data Table on US - Year-over-year growth 2025-2030 (%)

12.3.2 Canada - Market size and forecast 2025-2030

Chart on Canada - Market size and forecast 2025-2030 ($ million)
Data Table on Canada - Market size and forecast 2025-2030 ($ million)
Chart on Canada - Year-over-year growth 2025-2030 (%)
Data Table on Canada - Year-over-year growth 2025-2030 (%)

12.3.3 Mexico - Market size and forecast 2025-2030

Chart on Mexico - Market size and forecast 2025-2030 ($ million)
Data Table on Mexico - Market size and forecast 2025-2030 ($ million)
Chart on Mexico - Year-over-year growth 2025-2030 (%)
Data Table on Mexico - Year-over-year growth 2025-2030 (%)

12.4 Europe - Market size and forecast 2025-2030

Chart on Europe - Market size and forecast 2025-2030 ($ million)
Data Table on Europe - Market size and forecast 2025-2030 ($ million)
Chart on Europe - Year-over-year growth 2025-2030 (%)
Data Table on Europe - Year-over-year growth 2025-2030 (%)
Chart on Regional Comparison - Europe
Data Table on Regional Comparison - Europe

12.4.1 UK - Market size and forecast 2025-2030

Chart on UK - Market size and forecast 2025-2030 ($ million)
Data Table on UK - Market size and forecast 2025-2030 ($ million)
Chart on UK - Year-over-year growth 2025-2030 (%)
Data Table on UK - Year-over-year growth 2025-2030 (%)

12.4.2 The Netherlands - Market size and forecast 2025-2030

Chart on The Netherlands - Market size and forecast 2025-2030 ($ million)
Data Table on The Netherlands - Market size and forecast 2025-2030 ($ million)
Chart on The Netherlands - Year-over-year growth 2025-2030 (%)
Data Table on The Netherlands - Year-over-year growth 2025-2030 (%)

12.4.3 Germany - Market size and forecast 2025-2030

Chart on Germany - Market size and forecast 2025-2030 ($ million)
Data Table on Germany - Market size and forecast 2025-2030 ($ million)
Chart on Germany - Year-over-year growth 2025-2030 (%)
Data Table on Germany - Year-over-year growth 2025-2030 (%)

12.4.4 France - Market size and forecast 2025-2030

Chart on France - Market size and forecast 2025-2030 ($ million)
Data Table on France - Market size and forecast 2025-2030 ($ million)
Chart on France - Year-over-year growth 2025-2030 (%)
Data Table on France - Year-over-year growth 2025-2030 (%)

12.4.5 Italy - Market size and forecast 2025-2030

Chart on Italy - Market size and forecast 2025-2030 ($ million)
Data Table on Italy - Market size and forecast 2025-2030 ($ million)
Chart on Italy - Year-over-year growth 2025-2030 (%)
Data Table on Italy - Year-over-year growth 2025-2030 (%)

12.4.6 Spain - Market size and forecast 2025-2030

Chart on Spain - Market size and forecast 2025-2030 ($ million)
Data Table on Spain - Market size and forecast 2025-2030 ($ million)
Chart on Spain - Year-over-year growth 2025-2030 (%)
Data Table on Spain - Year-over-year growth 2025-2030 (%)

12.5 APAC - Market size and forecast 2025-2030

Chart on APAC - Market size and forecast 2025-2030 ($ million)
Data Table on APAC - Market size and forecast 2025-2030 ($ million)
Chart on APAC - Year-over-year growth 2025-2030 (%)
Data Table on APAC - Year-over-year growth 2025-2030 (%)
Chart on Regional Comparison - APAC
Data Table on Regional Comparison - APAC

12.5.1 China - Market size and forecast 2025-2030

Chart on China - Market size and forecast 2025-2030 ($ million)
Data Table on China - Market size and forecast 2025-2030 ($ million)
Chart on China - Year-over-year growth 2025-2030 (%)
Data Table on China - Year-over-year growth 2025-2030 (%)

12.5.2 Australia - Market size and forecast 2025-2030

Chart on Australia - Market size and forecast 2025-2030 ($ million)
Data Table on Australia - Market size and forecast 2025-2030 ($ million)
Chart on Australia - Year-over-year growth 2025-2030 (%)
Data Table on Australia - Year-over-year growth 2025-2030 (%)

12.5.3 India - Market size and forecast 2025-2030

Chart on India - Market size and forecast 2025-2030 ($ million)
Data Table on India - Market size and forecast 2025-2030 ($ million)
Chart on India - Year-over-year growth 2025-2030 (%)
Data Table on India - Year-over-year growth 2025-2030 (%)

12.5.4 Indonesia - Market size and forecast 2025-2030

Chart on Indonesia - Market size and forecast 2025-2030 ($ million)
Data Table on Indonesia - Market size and forecast 2025-2030 ($ million)
Chart on Indonesia - Year-over-year growth 2025-2030 (%)
Data Table on Indonesia - Year-over-year growth 2025-2030 (%)

12.5.5 South Korea - Market size and forecast 2025-2030

Chart on South Korea - Market size and forecast 2025-2030 ($ million)
Data Table on South Korea - Market size and forecast 2025-2030 ($ million)
Chart on South Korea - Year-over-year growth 2025-2030 (%)
Data Table on South Korea - Year-over-year growth 2025-2030 (%)

12.5.6 Japan - Market size and forecast 2025-2030

Chart on Japan - Market size and forecast 2025-2030 ($ million)
Data Table on Japan - Market size and forecast 2025-2030 ($ million)
Chart on Japan - Year-over-year growth 2025-2030 (%)
Data Table on Japan - Year-over-year growth 2025-2030 (%)

12.6 Middle East and Africa - Market size and forecast 2025-2030

Chart on Middle East and Africa - Market size and forecast 2025-2030 ($ million)
Data Table on Middle East and Africa - Market size and forecast 2025-2030 ($ million)
Chart on Middle East and Africa - Year-over-year growth 2025-2030 (%)
Data Table on Middle East and Africa - Year-over-year growth 2025-2030 (%)
Chart on Regional Comparison - Middle East and Africa
Data Table on Regional Comparison - Middle East and Africa

12.6.1 Saudi Arabia - Market size and forecast 2025-2030

Chart on Saudi Arabia - Market size and forecast 2025-2030 ($ million)
Data Table on Saudi Arabia - Market size and forecast 2025-2030 ($ million)
Chart on Saudi Arabia - Year-over-year growth 2025-2030 (%)
Data Table on Saudi Arabia - Year-over-year growth 2025-2030 (%)

12.6.2 UAE - Market size and forecast 2025-2030

Chart on UAE - Market size and forecast 2025-2030 ($ million)
Data Table on UAE - Market size and forecast 2025-2030 ($ million)
Chart on UAE - Year-over-year growth 2025-2030 (%)
Data Table on UAE - Year-over-year growth 2025-2030 (%)

12.6.3 Turkey - Market size and forecast 2025-2030

Chart on Turkey - Market size and forecast 2025-2030 ($ million)
Data Table on Turkey - Market size and forecast 2025-2030 ($ million)
Chart on Turkey - Year-over-year growth 2025-2030 (%)
Data Table on Turkey - Year-over-year growth 2025-2030 (%)

12.6.4 Israel - Market size and forecast 2025-2030

Chart on Israel - Market size and forecast 2025-2030 ($ million)
Data Table on Israel - Market size and forecast 2025-2030 ($ million)
Chart on Israel - Year-over-year growth 2025-2030 (%)
Data Table on Israel - Year-over-year growth 2025-2030 (%)

12.6.5 South Africa - Market size and forecast 2025-2030

Chart on South Africa - Market size and forecast 2025-2030 ($ million)
Data Table on South Africa - Market size and forecast 2025-2030 ($ million)
Chart on South Africa - Year-over-year growth 2025-2030 (%)
Data Table on South Africa - Year-over-year growth 2025-2030 (%)

12.7 South America - Market size and forecast 2025-2030

Chart on South America - Market size and forecast 2025-2030 ($ million)
Data Table on South America - Market size and forecast 2025-2030 ($ million)
Chart on South America - Year-over-year growth 2025-2030 (%)
Data Table on South America - Year-over-year growth 2025-2030 (%)
Chart on Regional Comparison - South America
Data Table on Regional Comparison - South America

12.7.1 Brazil - Market size and forecast 2025-2030

Chart on Brazil - Market size and forecast 2025-2030 ($ million)
Data Table on Brazil - Market size and forecast 2025-2030 ($ million)
Chart on Brazil - Year-over-year growth 2025-2030 (%)
Data Table on Brazil - Year-over-year growth 2025-2030 (%)

12.7.2 Argentina - Market size and forecast 2025-2030

Chart on Argentina - Market size and forecast 2025-2030 ($ million)
Data Table on Argentina - Market size and forecast 2025-2030 ($ million)
Chart on Argentina - Year-over-year growth 2025-2030 (%)
Data Table on Argentina - Year-over-year growth 2025-2030 (%)

12.7.3 Chile - Market size and forecast 2025-2030

Chart on Chile - Market size and forecast 2025-2030 ($ million)
Data Table on Chile - Market size and forecast 2025-2030 ($ million)
Chart on Chile - Year-over-year growth 2025-2030 (%)
Data Table on Chile - Year-over-year growth 2025-2030 (%)

12.8 Market opportunity by geography

Market opportunity by geography ($ million)
Data Tables on Market opportunity by geography ($ million)

13. Drivers, Challenges, and Opportunity

13.1 Market drivers

Heightened deepwater exploration and production activity
Expansion of offshore wind energy sector
Increasing offshore decommissioning

13.2 Market challenges

Heightened geopolitical instability and operational disruptions
Accelerating energy transition and stringent decarbonization mandates
Exacerbated scarcity of skilled maritime professionals

13.3 Impact of drivers and challenges

Impact of drivers and challenges in 2025 and 2030

13.4 Market opportunities

Strategic diversification into offshore renewable energy
Accelerated adoption of digitalization and autonomous operations
Strategic fleet consolidation and mergers among operators

14. Competitive Landscape

14.1 Overview

14.2

Overview on criticality of inputs and factors of differentiation

14.3 Landscape disruption

Overview on factors of disruption

14.4 Industry risks

Impact of key risks on business

15. Competitive Analysis

15.1 Companies profiled

Companies covered

15.2 Company ranking index

15.3 Market positioning of companies

Matrix on companies position and classification

15.4 BOURBON Maritime

BOURBON Maritime - Overview
BOURBON Maritime - Product / Service
BOURBON Maritime - Key offerings
SWOT

15.5 CNOOC Ltd.

CNOOC Ltd. - Overview
CNOOC Ltd. - Business segments
CNOOC Ltd. - Key offerings
CNOOC Ltd. - Segment focus
SWOT

15.6 Damen Shipyards Group

Damen Shipyards Group - Overview
Damen Shipyards Group - Product / Service
Damen Shipyards Group - Key offerings
SWOT

15.7 Eastern Shipbuilding Inc.

Eastern Shipbuilding Inc. - Overview
Eastern Shipbuilding Inc. - Product / Service
Eastern Shipbuilding Inc. - Key news
Eastern Shipbuilding Inc. - Key offerings
SWOT

15.8 Edison Chouest Offshore Co.

Edison Chouest Offshore Co. - Overview
Edison Chouest Offshore Co. - Product / Service
Edison Chouest Offshore Co. - Key offerings
SWOT

15.9 Fincantieri Spa

Fincantieri Spa - Overview
Fincantieri Spa - Business segments
Fincantieri Spa - Key offerings
Fincantieri Spa - Segment focus
SWOT

15.10 Harvey Gulf Intl. Marine LLC

Harvey Gulf Intl. Marine LLC - Overview
Harvey Gulf Intl. Marine LLC - Product / Service
Harvey Gulf Intl. Marine LLC - Key offerings
SWOT

15.11 Hornbeck Offshore Services

Hornbeck Offshore Services - Overview
Hornbeck Offshore Services - Product / Service
Hornbeck Offshore Services - Key offerings
SWOT

15.12 Maersk Supply Service

Maersk Supply Service - Overview
Maersk Supply Service - Product / Service
Maersk Supply Service - Key offerings
SWOT

15.13 New DOF ASA

New DOF ASA - Overview
New DOF ASA - Product / Service
New DOF ASA - Key offerings
SWOT

15.14 Sea1 Offshore

Sea1 Offshore - Overview
Sea1 Offshore - Product / Service
Sea1 Offshore - Key offerings
SWOT

15.15 SEACOR Marine Holdings Inc.

SEACOR Marine Holdings Inc. - Overview
SEACOR Marine Holdings Inc. - Business segments
SEACOR Marine Holdings Inc. - Key offerings
SEACOR Marine Holdings Inc. - Segment focus
SWOT

15.16 ST Engineering Ltd.

ST Engineering Ltd. - Overview
ST Engineering Ltd. - Business segments
ST Engineering Ltd. - Key news
ST Engineering Ltd. - Key offerings
ST Engineering Ltd. - Segment focus
SWOT

15.17 Tidewater Inc.

Tidewater Inc. - Overview
Tidewater Inc. - Business segments
Tidewater Inc. - Key offerings
Tidewater Inc. - Segment focus
SWOT

15.18 Zamil Offshore Services Co.

Zamil Offshore Services Co. - Overview
Zamil Offshore Services Co. - Product / Service
Zamil Offshore Services Co. - Key offerings
SWOT

16. Appendix

16.1 Scope of the report

Market definition
Objectives
Notes and caveats

16.2 Inclusions and exclusions checklist

Inclusions checklist
Exclusions checklist

16.3 Currency conversion rates for US$

16.4 Research methodology

16.5 Data procurement

Information sources

16.6 Data validation

16.7 Validation techniques employed for market sizing

16.8 Data synthesis

16.9 360 degree market analysis

16.10 List of abbreviations

Research Methodology

Technavio presents a detailed picture of the market by way of study, synthesis, and summation of data from multiple sources. The analysts have presented the various facets of the market with a particular focus on identifying the key industry influencers. The data thus presented is comprehensive, reliable, and the result of extensive research, both primary and secondary.

INFORMATION SOURCES

Primary sources

  • Manufacturers and suppliers
  • Channel partners
  • Industry experts
  • Strategic decision makers

Secondary sources

  • Industry journals and periodicals
  • Government data
  • Financial reports of key industry players
  • Historical data
  • Press releases

DATA ANALYSIS

Data Synthesis

  • Collation of data
  • Estimation of key figures
  • Analysis of derived insights

Data Validation

  • Triangulation with data models
  • Reference against proprietary databases
  • Corroboration with industry experts

REPORT WRITING

Qualitative

  • Market drivers
  • Market challenges
  • Market trends
  • Five forces analysis

Quantitative

  • Market size and forecast
  • Market segmentation
  • Geographical insights
  • Competitive landscape

Interested in this report?

Get your sample now to see our research methodology and insights!

Download Now

Frequently Asked Questions

Offshore Support Vessel market growth will increase by USD 702.2 million during 2026-2030 .

The Offshore Support Vessel market is expected to grow at a CAGR of 6.1% during 2026-2030 .

Offshore Support Vessel market is segmented by Product (AHTS, PSV, MPSV, FSIV, Others) Application (Oil and gas, Offshore applications) Fuel type (Diesel powered, Gas powered)

BOURBON Maritime, CNOOC Ltd., Damen Shipyards Group, DP World, Eastern Shipbuilding Inc., Edison Chouest Offshore Co., Fincantieri Spa, Harvey Gulf Intl. Marine LLC, Hornbeck Offshore Services, Maersk Supply Service, New DOF ASA, Sea1 Offshore, SEACOR Marine Holdings Inc., ST Engineering Ltd., Tidewater Inc., Zamil Offshore Services Co. are a few of the key vendors in the Offshore Support Vessel market.

North America will register the highest growth rate of 48.2% among the other regions. Therefore, the Offshore Support Vessel market in North America is expected to garner significant business opportunities for the vendors during the forecast period.

US, Canada, Mexico, UK, The Netherlands, Germany, France, Italy, Spain, China, Australia, India, Indonesia, South Korea, Japan, Saudi Arabia, UAE, Turkey, Israel, South Africa, Brazil, Argentina, Chile

  • Heightened deepwater exploration and production activity is the driving factor this market.

The Offshore Support Vessel market vendors should focus on grabbing business opportunities from the Product segment as it accounted for the largest market share in the base year.