
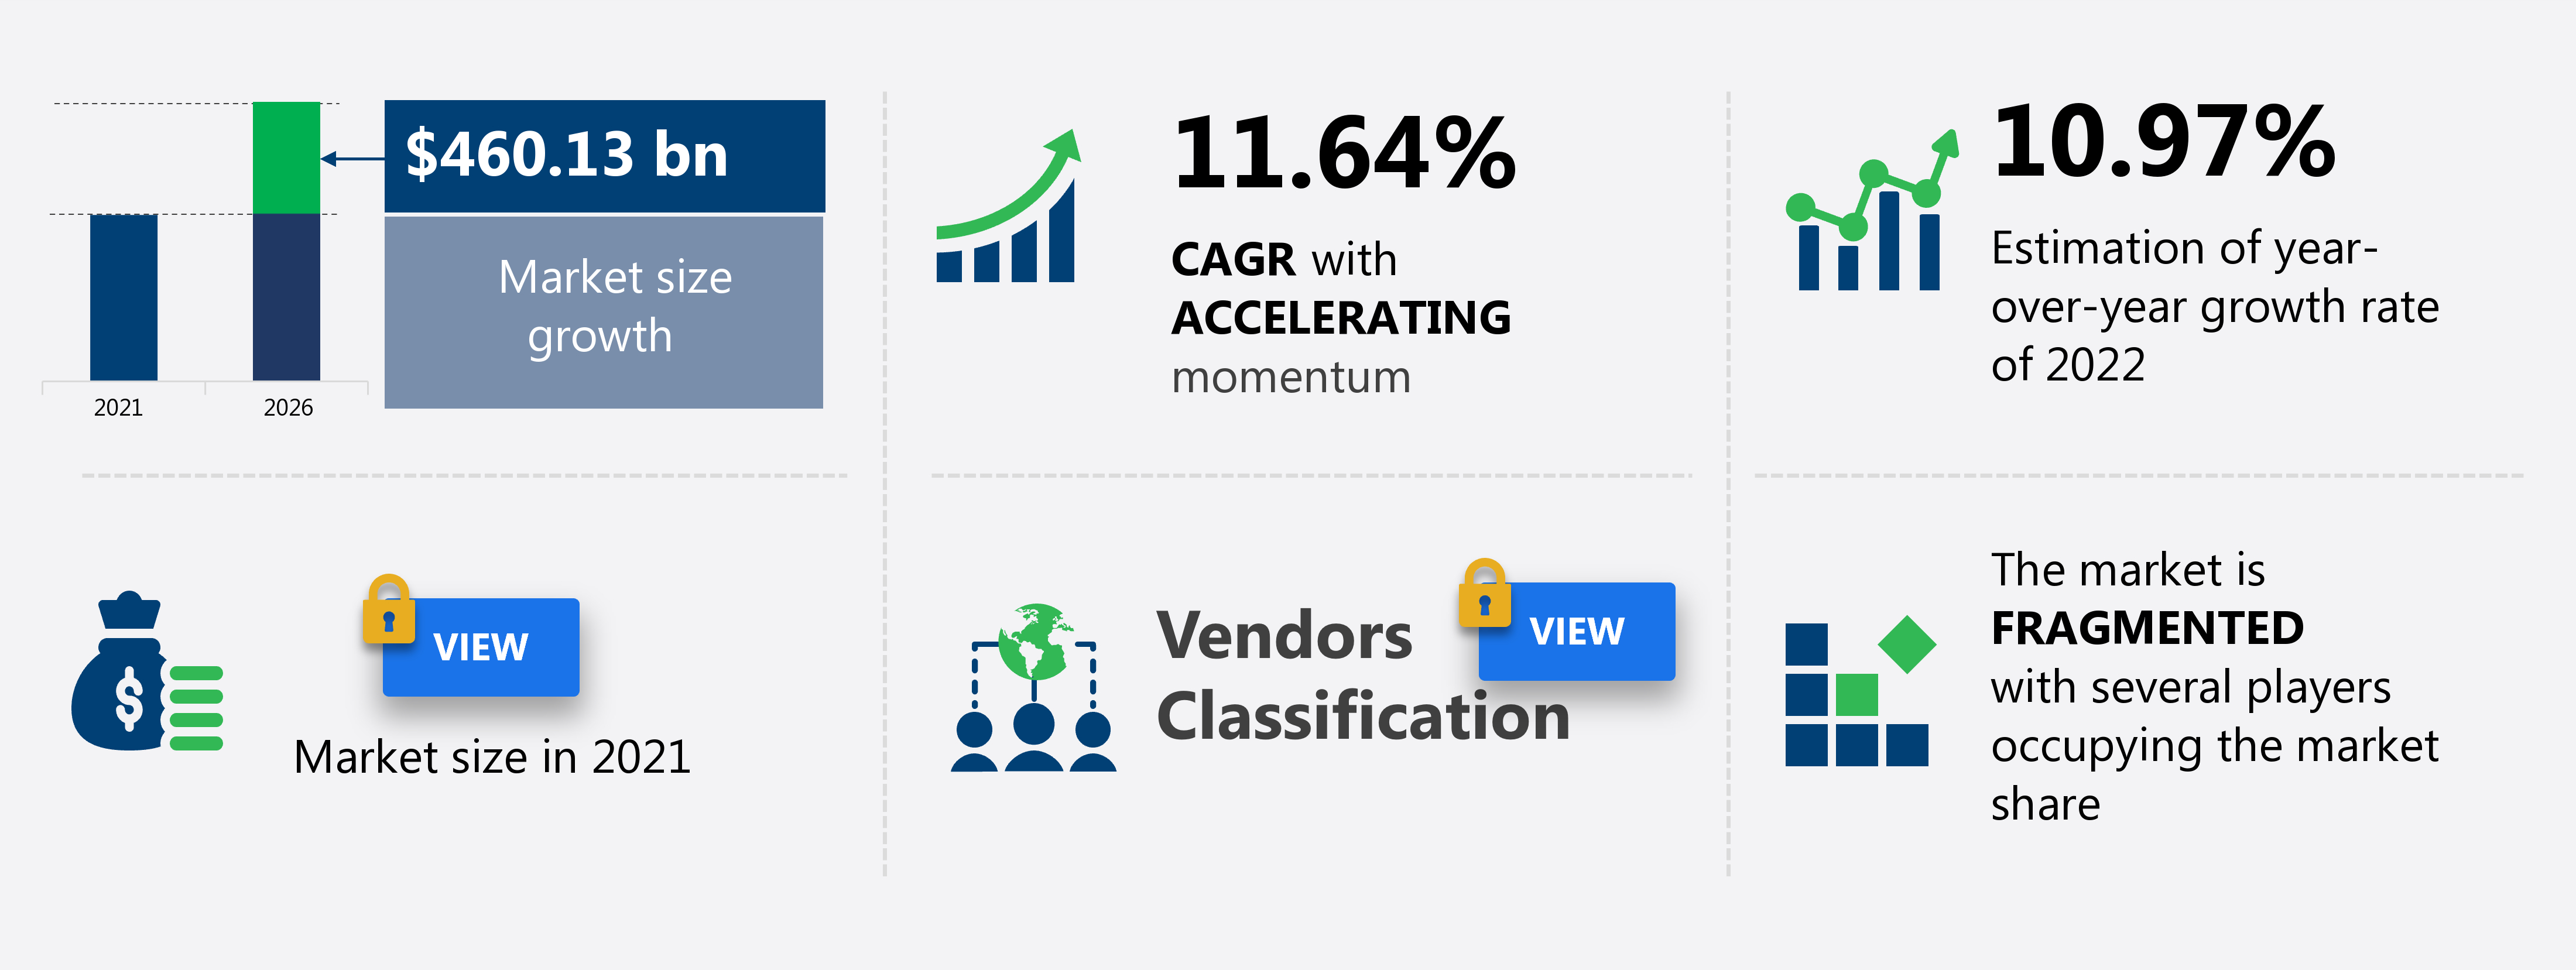
The online retail market share in the US is expected to increase to USD 460.13 billion from 2021 to 2026, and the market’s growth momentum will accelerate at a CAGR of 11.64%.
The report extensively covers online retail market in the US segmentation by the following:
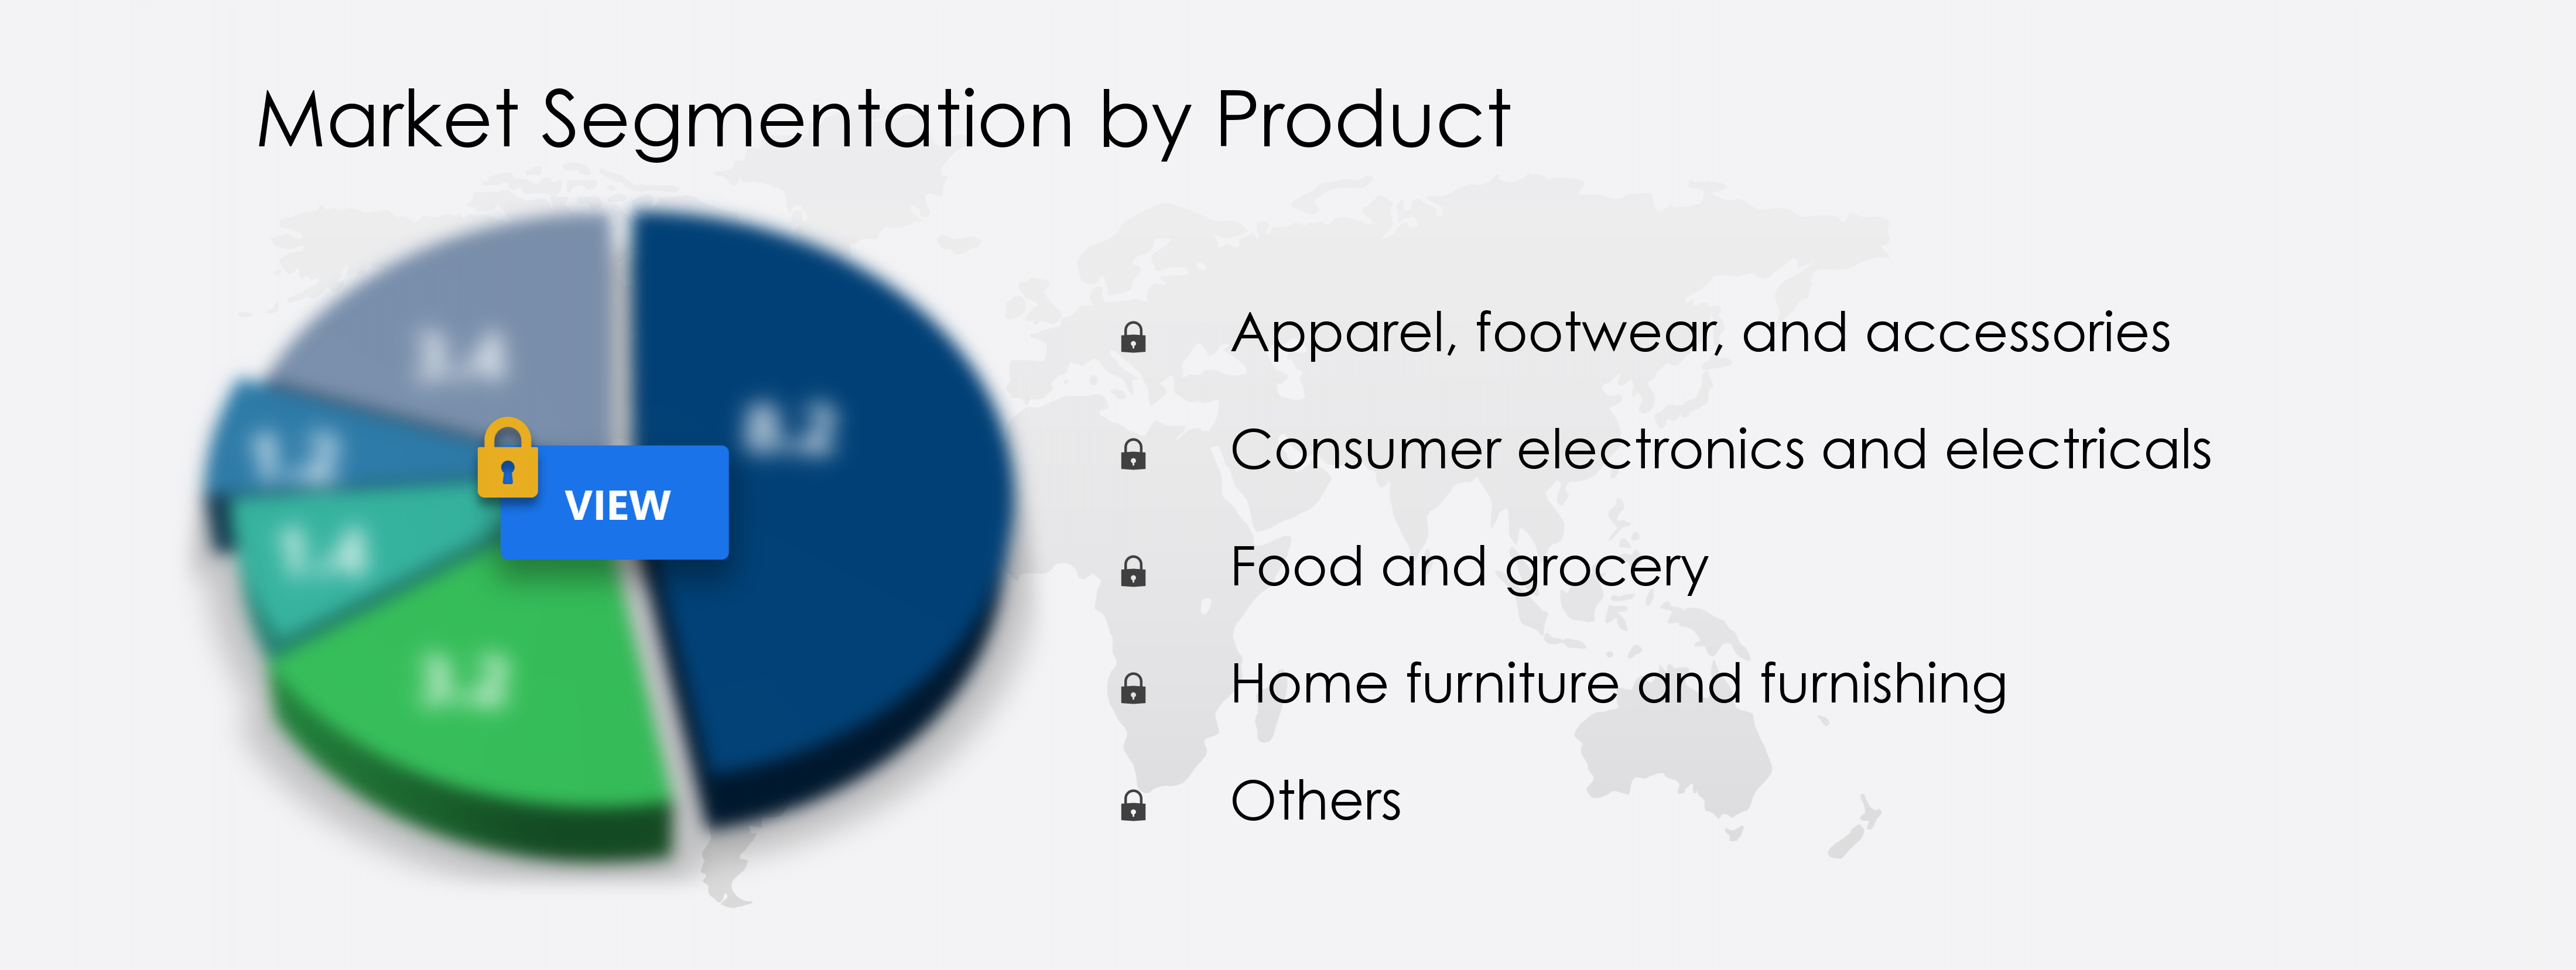
- Product - Apparel, footwear, and accessories, consumer electronics and electricals, food and grocery, home furniture and furnishing, and others
- Device - Smartphones and tablets and PCs
The US online retail market report offers information on several market vendors, including Amazon.com Inc., Apple Inc., Best Buy Co. Inc., Costco Wholesale Corp., eBay Inc., Kroger Co., Target Corp., The Home Depot Inc., Walmart Inc., and Wayfair Inc. among others.
This online retail market in the US research report provides valuable insights on the post COVID-19 impact on the market, which will help companies evaluate their business approaches.
What will the Online Retail Market Size in the US be During the Forecast Period?
Download the Free Report Sample to Unlock the Online Retail Market Size in the US for the Forecast Period and Other Important Statistics
Online Retail Market in the US: Key Drivers, Trends, and Challenges
The growing seasonal and holiday sales is notably driving the online retail market growth in the US, although factors such as transportation and logistics may impede the market growth. Our research analysts have studied the historical data and deduced the key market drivers and the COVID-19 pandemic impact on the online retail industry in the US. The holistic analysis of the drivers will help in deducing end goals and refining marketing strategies to gain a competitive edge.
Key US Online Retail Market Driver
The growing seasonal and holiday sales is one of the key drivers supporting the US online retail market growth. For instance, from November 1 to December 24, e-commerce sales in the US increased by 11% in 2021, when compared to a massive 47.2% growth in the holiday season of 2020. E-commerce sales made up 20.9 % of total retail sales in the holiday season of 2021, slightly higher than 20.6 percent in 2020. Thanksgiving, Black Friday, and Cyber Monday are the days that see a high amount of online shopping. Apparel, footwear and accessories, consumer electronics, computer hardware, and toys are the largest gaining product categories during the holiday season. Consumers in the US spent $204.5 billion online in November and December 2021, up 8.6% over the same period in 2020. Such exciting sales and offers are driving the market growth.
Key US Online Retail Market Trend
Omni-channel retailing is one of the key US online retail market trends fueling the market growth. It is rapidly becoming the norm for many retailers in the US. It offers consumers the option to shop online and pick up the merchandise from the store nearest to their location on the same day. Retailers are observing a high web influence on their in-store sales. For instance, Best Buy is integrating its offline and online stores to boost revenues. As a part of its omnichannel strategy, the retailer is utilizing physical stores as distribution centers for online purchases. According to Best Buy, 40% of its online shoppers prefer picking up their purchases from physical stores. Best Buy also challenges online and discount retailers with its match-to-price strategy, claiming to offer gadgets at or below the price offered by competitors. Such strategies are expected to boost market growth during the forecast period.
Key US Online Retail Market Challenge
Transportation and logistics are some of the factors hindering the US online retail market growth. Product procurement or sourcing, shipment of ordered items, and delivery to customers are the three major processes where the intervention of transportation and logistics come into the picture. All these processes require a high investment of both time and money, which challenges the efficiency and effectiveness of retailers and their costing strategies. The higher cost incurred from transportation and logistics reduces the margin of retailers, and most of the time, retailers are unable to break even. Between rising fuel prices, driver shortages, as well as a governmental and societal push for increased digitization and sustainability, transport and logistics will continue to be under a lot of pressure. Such factors will negatively impact the market growth during the forecast period.
This online retail market in the US analysis report also provides detailed information on other upcoming trends and challenges that will have a far-reaching effect on the market growth. The actionable insights on the trends and challenges will help companies evaluate and develop growth strategies for 2022-2026.
Who are the Major Online Retail Market Vendors in the US?
The report analyzes the market’s competitive landscape and offers information on several market vendors, including:
- Amazon.com Inc.
- Apple Inc.
- Best Buy Co. Inc.
- Costco Wholesale Corp.
- eBay Inc.
- Kroger Co.
- Target Corp.
- The Home Depot Inc.
- Walmart Inc.
- Wayfair Inc.
This statistical study of the online retail market in the US encompasses successful business strategies deployed by the key vendors. The online retail market in the US is fragmented and the vendors are deploying growth strategies such as sales, discounts, bundle discount offers, and others to compete in the market.
Product Insights and News
- Apple Inc. is a public company that is headquartered in the US. It is a global company that generated a revenue of $365817 million and had around 154000 employees. Its revenue from the online retail market in the US contributes to its overall revenues, along with its other offerings, but is not a key revenue stream for the company.
- Apple Inc. -The company operates online retail business named Apple store.
To make the most of the opportunities and recover from post COVID-19 impact, market vendors should focus more on the growth prospects in the fast-growing segments, while maintaining their positions in the slow-growing segments.
The online retail market in the US forecast report offers in-depth insights into key vendor profiles. The profiles include information on the production, sustainability, and prospects of the leading companies.
What are the Revenue-generating Product Segments in the Online Retail Market in the US?
To gain further insights on the market contribution of various segments Request for a FREE sample
The online retail market share growth in the US by the apparel, footwear, and accessories segment will be significant during the forecast period. The availability of simple and secure online payment options, the ability to track shipments, 24/7 customer service, and low prices have all contributed to the increased demand for online shopping in this segment. Apparel, footwear, and accessories have gained a lot of popularity on the internet since they are relatively low-ticket items with a low perceived risk of product delivery and returns. Growing population and rising disposable personal income are two significant drivers driving the segment growth in the online retail market in the US.
This report provides an accurate prediction of the contribution of all the segments to the growth of the online retail market size in the US and actionable market insights on post COVID-19 impact on each segment.
Parent Market Analysis
Technavio categorizes the online retail market in the US as a part of the global internet and direct marketing retail market. Our research report has extensively covered external factors influencing the parent market growth potential in the coming years, which will determine the levels of growth of the online retail market in the US during the forecast period.
Online Retail Market in the US Value Chain Analysis
Our report provides extensive information on the value chain analysis for the online retail market in the US, which vendors can leverage to gain a competitive advantage during the forecast period. The end-to-end understanding of the value chain is essential in profit margin optimization and evaluation of business strategies. The data available in our value chain analysis segment can help vendors drive costs and enhance customer services during the forecast period.
The value chain of the internet and direct marketing retail market includes the following core components:
- Inputs
- Inbound logistics
- Operations
- Outbound logistics
- Marketing and sales
- Service
- Support activities
- Innovation
The report has further elucidated on other innovative approaches being followed by service providers to ensure a sustainable market presence.
|
Online Retail Market Scope in the US |
|
|
Report Coverage |
Details |
|
Page number |
120 |
|
Base year |
2021 |
|
Forecast period |
2022-2026 |
|
Growth momentum & CAGR |
Accelerate at a CAGR of 11.64% |
|
Market growth 2022-2026 |
$ 460.13 billion |
|
Market structure |
Fragmented |
|
YoY growth (%) |
10.97 |
|
Competitive landscape |
Leading companies, Competitive strategies, Consumer engagement scope |
|
Key companies profiled |
Amazon.com Inc., Apple Inc., Best Buy Co. Inc., Costco Wholesale Corp., eBay Inc., Kroger Co., Target Corp., The Home Depot Inc., Walmart Inc., and Wayfair Inc. |
|
Market dynamics |
Parent market analysis, Market growth inducers and obstacles, Fast-growing and slow-growing segment analysis, COVID-19 impact and recovery analysis and future consumer dynamics, Market condition analysis for the forecast period |
|
Customization purview |
If our report has not included the data that you are looking for, you can reach out to our analysts and get segments customized. |
What are the Key Data Covered in this Online Retail Market in the US Report?
- CAGR of the market during the forecast period 2022-2026
- Detailed information on factors that will drive online retail market growth in the US during the next five years
- Precise estimation of the online retail market size in the US and its contribution to the parent market
- Accurate predictions on upcoming trends and changes in consumer behavior
- The growth of the online retail industry in the US
- A thorough analysis of the market’s competitive landscape and detailed information on vendors
- Comprehensive details of factors that will challenge the growth of online retail market vendors in the US
We can help! Our analysts can customize this report to meet your requirements. Get in touch
 RIA -
RIA - 
