Organic Waste Converter Machine Market Analysis, Size, and Forecast 2026-2030: APAC (China, India, and Japan), North America (US, Canada, and Mexico), Europe (Germany, UK, and France), Middle East and Africa (Saudi Arabia, UAE, and South Africa), South America (Brazil, Argentina, and Colombia), and Rest of World (ROW)

Organic Waste Converter Machine Market Analysis, Size, and Forecast 2026-2030:
APAC (China, India, and Japan), North America (US, Canada, and Mexico), Europe (Germany, UK, and France), Middle East and Africa (Saudi Arabia, UAE, and South Africa), South America (Brazil, Argentina, and Colombia), and Rest of World (ROW)

Published: Dec 2025 286 Pages SKU: IRTNTR81170

Market Overview at a Glance

$147.1 Mn
Market Opportunity
8.4%
CAGR 2025 - 2030
47.2%
APAC Growth
$175.7 Mn
Batch feed segment 2024

Organic Waste Converter Machine Market Size 2026-2030

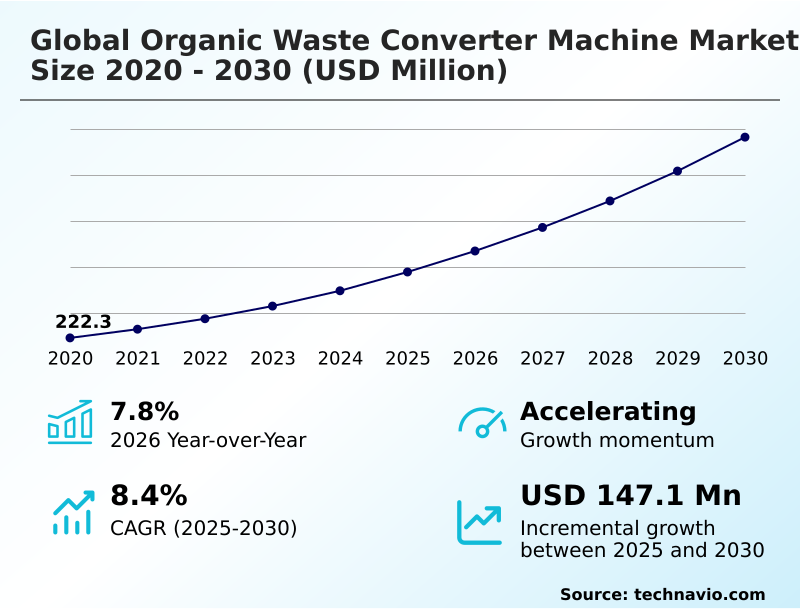
The organic waste converter machine market size is valued to increase by USD 147.1 million, at a CAGR of 8.4% from 2025 to 2030. Stringent environmental regulations and landfill diversion mandates will drive the organic waste converter machine market.

Major Market Trends & Insights

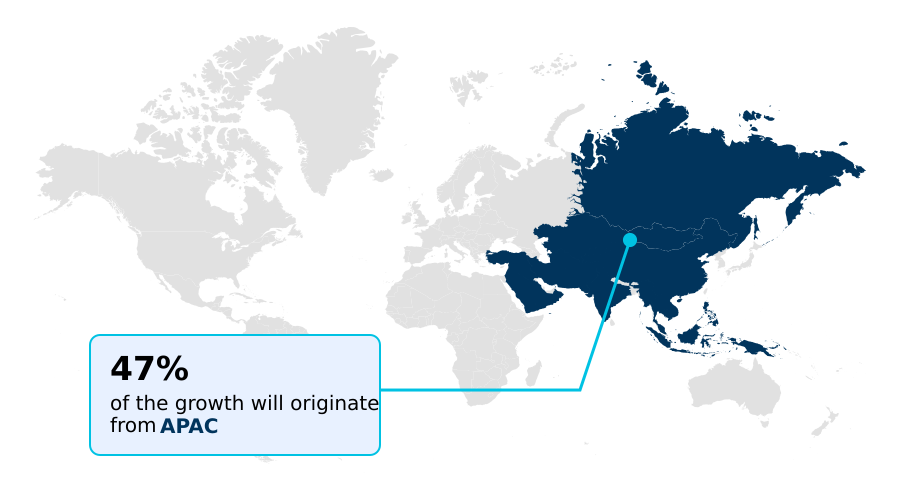
  • APAC dominated the market and accounted for a 47.2% growth during the forecast period.
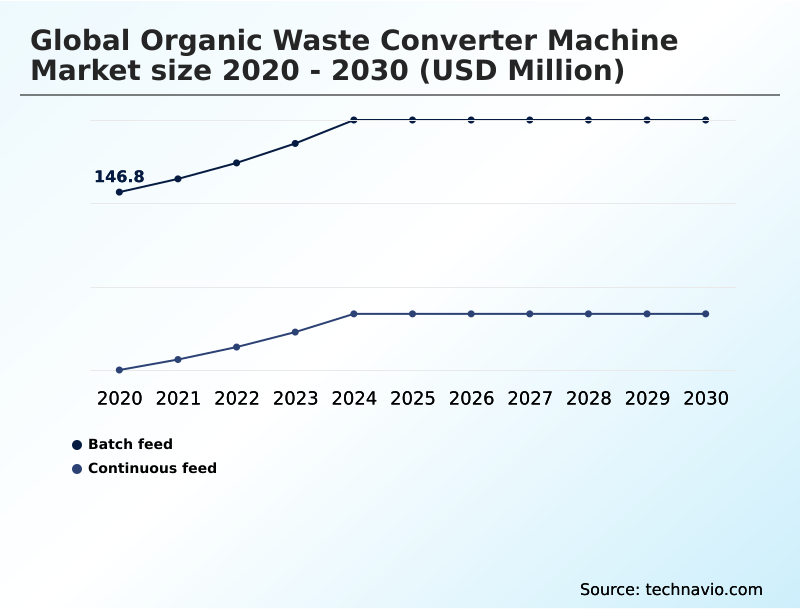
  • By Type - Batch feed segment was valued at USD 175.7 million in 2024
  • By Product Type - Gasoline segment accounted for the largest market revenue share in 2024

Market Size & Forecast

  • Market Opportunities: USD 219 million
  • Market Future Opportunities: USD 147.1 million
  • CAGR from 2025 to 2030 : 8.4%

Market Summary

What will be the Size of the Organic Waste Converter Machine Market during the forecast period?

Get Key Insights on Market Forecast (PDF) Request Free Sample

How is the Organic Waste Converter Machine Market Segmented?

The organic waste converter machine industry research report provides comprehensive data (region-wise segment analysis), with forecasts and estimates in "USD million" for the period 2026-2030, as well as historical data from 2020-2024 for the following segments.

  • Type
    • Batch feed
    • Continuous feed
  • Product type
    • Gasoline
    • Electric
  • End-user
    • Commercial
    • Industrial
    • Residential
    • Agricultural
  • Geography
    • APAC
      • China
      • India
      • Japan
    • North America
      • US
      • Canada
      • Mexico
    • Europe
      • Germany
      • UK
      • France
    • Middle East and Africa
      • Saudi Arabia
      • UAE
      • South Africa
    • South America
      • Brazil
      • Argentina
      • Colombia
    • Rest of World (ROW)

By Type Insights

The batch feed segment is estimated to witness significant growth during the forecast period.

Request Free Sample

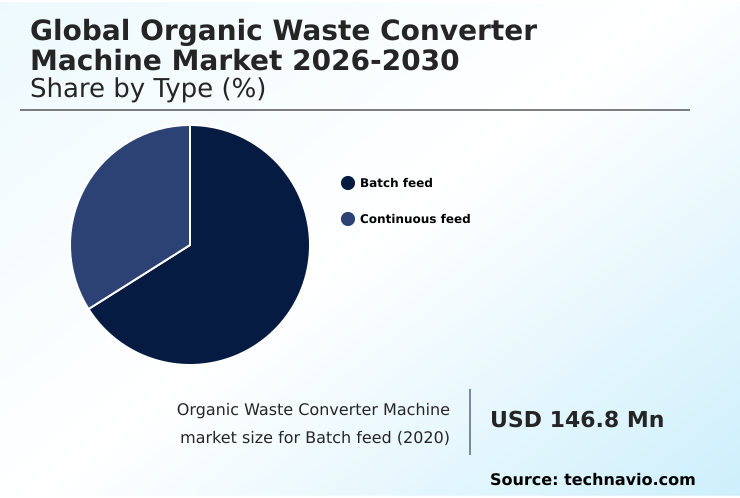
The Batch feed segment was valued at USD 175.7 million in 2024 and showed a gradual increase during the forecast period.

Request Free Sample

Regional Analysis

APAC is estimated to contribute 47.2% to the growth of the global market during the forecast period.Technavio’s analysts have elaborately explained the regional trends and drivers that shape the market during the forecast period.

See How Organic Waste Converter Machine Market Demand is Rising in APAC Request Free Sample

Market Dynamics

Our researchers analyzed the data with 2025 as the base year, along with the key drivers, trends, and challenges. A holistic analysis of drivers will help companies refine their marketing strategies to gain a competitive advantage.

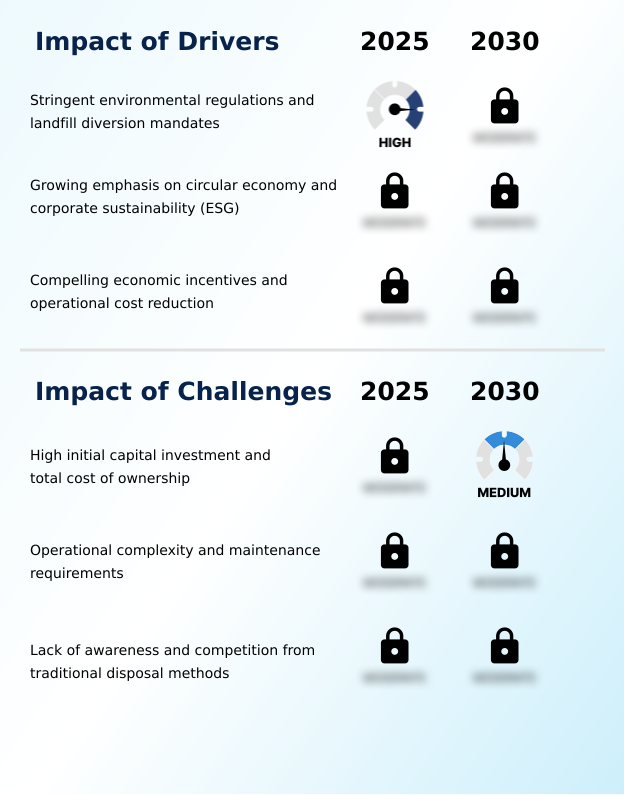
What are the key market drivers leading to the rise in the adoption of Organic Waste Converter Machine Industry?

What are the market trends shaping the Organic Waste Converter Machine Industry?

What challenges does the Organic Waste Converter Machine Industry face during its growth?

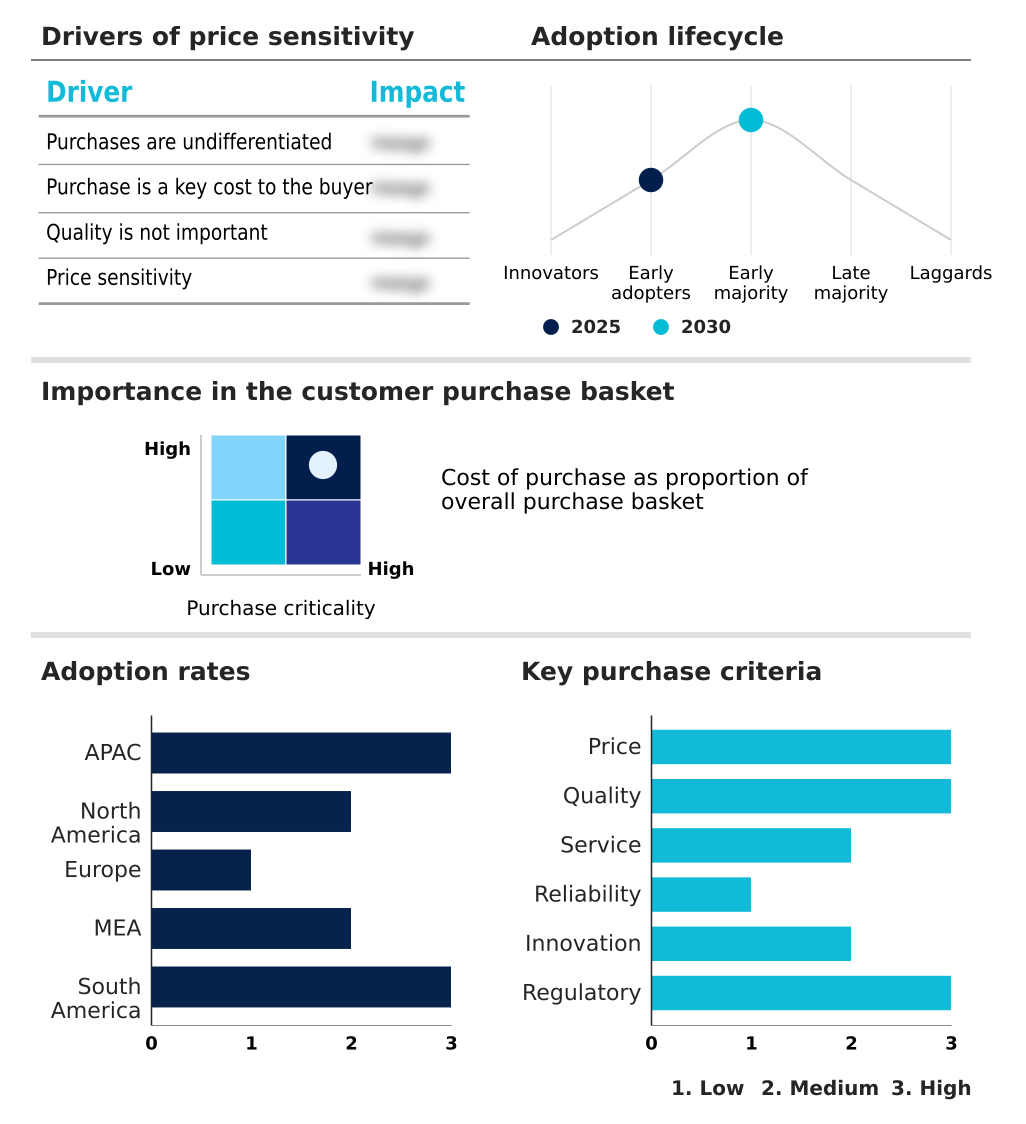
Exclusive Technavio Analysis on Customer Landscape

The organic waste converter machine market forecasting report includes the adoption lifecycle of the market, covering from the innovator’s stage to the laggard’s stage. It focuses on adoption rates in different regions based on penetration. Furthermore, the organic waste converter machine market report also includes key purchase criteria and drivers of price sensitivity to help companies evaluate and develop their market growth analysis strategies.

Customer Landscape of Organic Waste Converter Machine Industry

Competitive Landscape

Companies are implementing various strategies, such as strategic alliances, organic waste converter machine market forecast, partnerships, mergers and acquisitions, geographical expansion, and product/service launches, to enhance their presence in the industry.

Big Hanna Composter -

The industry research and growth report includes detailed analyses of the competitive landscape of the market and information about key companies, including:

  • Big Hanna Composter
  • Biowaste Energy Ventures
  • DP CleanTech Co. Ltd.
  • earthcare
  • Eco Pollutech
  • Ecocompost Machineries
  • EcoRich LLC
  • Excel Industries
  • HomeBiogas Ltd
  • Kelvin Water Technologies
  • Lystek International Inc.
  • Oklin International Ltd.
  • Recoup Technologies Inc.
  • RecyclingInside
  • Reddonatura
  • Smartenviro Systems
  • Solwearth Ecotech
  • WasteX Pte. Ltd.

Qualitative and quantitative analysis of companies has been conducted to help clients understand the wider business environment as well as the strengths and weaknesses of key industry players. Data is qualitatively analyzed to categorize companies as pure play, category-focused, industry-focused, and diversified; it is quantitatively analyzed to categorize companies as dominant, leading, strong, tentative, and weak.

Recent Development and News in Organic waste converter machine market

Dive into Technavio’s robust research methodology, blending expert interviews, extensive data synthesis, and validated models for unparalleled Organic Waste Converter Machine Market insights. See full methodology.

Market Scope
Page number 286
Base year 2025
Historic period 2020-2024
Forecast period 2026-2030
Growth momentum & CAGR Accelerate at a CAGR of 8.4%
Market growth 2026-2030 USD 147.1 million
Market structure Fragmented
YoY growth 2025-2026(%) 7.8%
Key countries China, India, Japan, South Korea, Australia, Indonesia, US, Canada, Mexico, Germany, UK, France, Italy, Spain, The Netherlands, Saudi Arabia, UAE, South Africa, Turkey, Egypt, Brazil, Argentina and Colombia
Competitive landscape Leading Companies, Market Positioning of Companies, Competitive Strategies, and Industry Risks

Request Free Sample

Research Analyst Overview

What are the Key Data Covered in this Organic Waste Converter Machine Market Research and Growth Report?

  • What is the expected growth of the Organic Waste Converter Machine Market between 2026 and 2030?

    • USD 147.1 million, at a CAGR of 8.4%

  • What segmentation does the market report cover?

    • The report is segmented by Type (Batch feed, and Continuous feed), Product Type (Gasoline, and Electric), End-user (Commercial, Industrial, Residential, and Agricultural) and Geography (APAC, North America, Europe, Middle East and Africa, South America)

  • Which regions are analyzed in the report?

    • APAC, North America, Europe, Middle East and Africa and South America

  • What are the key growth drivers and market challenges?

    • Stringent environmental regulations and landfill diversion mandates, High initial capital investment and total cost of ownership

  • Who are the major players in the Organic Waste Converter Machine Market?

    • Big Hanna Composter, Biowaste Energy Ventures, DP CleanTech Co. Ltd., earthcare, Eco Pollutech, Ecocompost Machineries, EcoRich LLC, Excel Industries, HomeBiogas Ltd, Kelvin Water Technologies, Lystek International Inc., Oklin International Ltd., Recoup Technologies Inc., RecyclingInside, Reddonatura, Smartenviro Systems, Solwearth Ecotech and WasteX Pte. Ltd.

Market Research Insights

We can help! Our analysts can customize this organic waste converter machine market research report to meet your requirements.

Get in touch

1. Executive Summary

1.1 Market overview

Executive Summary - Chart on Market Overview
Executive Summary - Data Table on Market Overview
Executive Summary - Chart on Global Market Characteristics
Executive Summary - Chart on Market by Geography
Executive Summary - Chart on Market Segmentation by Type
Executive Summary - Chart on Market Segmentation by Product Type
Executive Summary - Chart on Market Segmentation by End-user
Executive Summary - Chart on Incremental Growth
Executive Summary - Data Table on Incremental Growth
Executive Summary - Chart on Company Market Positioning

2. Technavio Analysis

2.1 Analysis of price sensitivity, lifecycle, customer purchase basket, adoption rates, and purchase criteria

2.2 Criticality of inputs and Factors of differentiation

Chart on Overview on criticality of inputs and factors of differentiation

2.3 Factors of disruption

Chart on Overview on factors of disruption

2.4 Impact of drivers and challenges

Chart on Impact of drivers and challenges in 2025 and 2030

3. Market Landscape

3.1 Market ecosystem

Chart on Parent Market
Data Table on - Parent Market

3.2 Market characteristics

Chart on Market characteristics analysis

3.3 Value chain analysis

Chart on Value chain analysis

4. Market Sizing

4.1 Market definition

Data Table on Offerings of companies included in the market definition

4.2 Market segment analysis

Market segments

4.3 Market size 2025

4.4 Market outlook: Forecast for 2025-2030

Chart on Global - Market size and forecast 2025-2030 ($ million)
Data Table on Global - Market size and forecast 2025-2030 ($ million)
Chart on Global Market: Year-over-year growth 2025-2030 (%)
Data Table on Global Market: Year-over-year growth 2025-2030 (%)

5. Historic Market Size

5.1 Global Organic Waste Converter Machine Market 2020 - 2024

Historic Market Size - Data Table on Global Organic Waste Converter Machine Market 2020 - 2024 ($ million)

5.2 Type segment analysis 2020 - 2024

Historic Market Size - Type Segment 2020 - 2024 ($ million)

5.3 Product Type segment analysis 2020 - 2024

Historic Market Size - Product Type Segment 2020 - 2024 ($ million)

5.4 End-user segment analysis 2020 - 2024

Historic Market Size - End-user Segment 2020 - 2024 ($ million)

5.5 Geography segment analysis 2020 - 2024

Historic Market Size - Geography Segment 2020 - 2024 ($ million)

5.6 Country segment analysis 2020 - 2024

Historic Market Size - Country Segment 2020 - 2024 ($ million)

6. Qualitative Analysis

6.1 The AI impact on global organic waste converter machine market

7. Five Forces Analysis

7.1 Five forces summary

Five forces analysis - Comparison between 2025 and 2030

7.2 Bargaining power of buyers

Bargaining power of buyers - Impact of key factors 2025 and 2030

7.3 Bargaining power of suppliers

Bargaining power of suppliers - Impact of key factors in 2025 and 2030

7.4 Threat of new entrants

Threat of new entrants - Impact of key factors in 2025 and 2030

7.5 Threat of substitutes

Threat of substitutes - Impact of key factors in 2025 and 2030

7.6 Threat of rivalry

Threat of rivalry - Impact of key factors in 2025 and 2030

7.7 Market condition

Chart on Market condition - Five forces 2025 and 2030

8. Market Segmentation by Type

8.1 Market segments

Chart on Type - Market share 2025-2030 (%)
Data Table on Type - Market share 2025-2030 (%)

8.2 Comparison by Type

Chart on Comparison by Type
Data Table on Comparison by Type

8.3 Batch feed - Market size and forecast 2025-2030

Chart on Batch feed - Market size and forecast 2025-2030 ($ million)
Data Table on Batch feed - Market size and forecast 2025-2030 ($ million)
Chart on Batch feed - Year-over-year growth 2025-2030 (%)
Data Table on Batch feed - Year-over-year growth 2025-2030 (%)

8.4 Continuous feed - Market size and forecast 2025-2030

Chart on Continuous feed - Market size and forecast 2025-2030 ($ million)
Data Table on Continuous feed - Market size and forecast 2025-2030 ($ million)
Chart on Continuous feed - Year-over-year growth 2025-2030 (%)
Data Table on Continuous feed - Year-over-year growth 2025-2030 (%)

8.5 Market opportunity by Type

Market opportunity by Type ($ million)
Data Table on Market opportunity by Type ($ million)

9. Market Segmentation by Product Type

9.1 Market segments

Chart on Product Type - Market share 2025-2030 (%)
Data Table on Product Type - Market share 2025-2030 (%)

9.2 Comparison by Product Type

Chart on Comparison by Product Type
Data Table on Comparison by Product Type

9.3 Gasoline - Market size and forecast 2025-2030

Chart on Gasoline - Market size and forecast 2025-2030 ($ million)
Data Table on Gasoline - Market size and forecast 2025-2030 ($ million)
Chart on Gasoline - Year-over-year growth 2025-2030 (%)
Data Table on Gasoline - Year-over-year growth 2025-2030 (%)

9.4 Electric - Market size and forecast 2025-2030

Chart on Electric - Market size and forecast 2025-2030 ($ million)
Data Table on Electric - Market size and forecast 2025-2030 ($ million)
Chart on Electric - Year-over-year growth 2025-2030 (%)
Data Table on Electric - Year-over-year growth 2025-2030 (%)

9.5 Market opportunity by Product Type

Market opportunity by Product Type ($ million)
Data Table on Market opportunity by Product Type ($ million)

10. Market Segmentation by End-user

10.1 Market segments

Chart on End-user - Market share 2025-2030 (%)
Data Table on End-user - Market share 2025-2030 (%)

10.2 Comparison by End-user

Chart on Comparison by End-user
Data Table on Comparison by End-user

10.3 Commercial - Market size and forecast 2025-2030

Chart on Commercial - Market size and forecast 2025-2030 ($ million)
Data Table on Commercial - Market size and forecast 2025-2030 ($ million)
Chart on Commercial - Year-over-year growth 2025-2030 (%)
Data Table on Commercial - Year-over-year growth 2025-2030 (%)

10.4 Industrial - Market size and forecast 2025-2030

Chart on Industrial - Market size and forecast 2025-2030 ($ million)
Data Table on Industrial - Market size and forecast 2025-2030 ($ million)
Chart on Industrial - Year-over-year growth 2025-2030 (%)
Data Table on Industrial - Year-over-year growth 2025-2030 (%)

10.5 Residential - Market size and forecast 2025-2030

Chart on Residential - Market size and forecast 2025-2030 ($ million)
Data Table on Residential - Market size and forecast 2025-2030 ($ million)
Chart on Residential - Year-over-year growth 2025-2030 (%)
Data Table on Residential - Year-over-year growth 2025-2030 (%)

10.6 Agricultural - Market size and forecast 2025-2030

Chart on Agricultural - Market size and forecast 2025-2030 ($ million)
Data Table on Agricultural - Market size and forecast 2025-2030 ($ million)
Chart on Agricultural - Year-over-year growth 2025-2030 (%)
Data Table on Agricultural - Year-over-year growth 2025-2030 (%)

10.7 Market opportunity by End-user

Market opportunity by End-user ($ million)
Data Table on Market opportunity by End-user ($ million)

11. Customer Landscape

11.1 Customer landscape overview

Analysis of price sensitivity, lifecycle, customer purchase basket, adoption rates, and purchase criteria

12. Geographic Landscape

12.1 Geographic segmentation

Chart on Market share by geography 2025-2030 (%)
Data Table on Market share by geography 2025-2030 (%)

12.2 Geographic comparison

Chart on Geographic comparison
Data Table on Geographic comparison

12.3 APAC - Market size and forecast 2025-2030

Chart on APAC - Market size and forecast 2025-2030 ($ million)
Data Table on APAC - Market size and forecast 2025-2030 ($ million)
Chart on APAC - Year-over-year growth 2025-2030 (%)
Data Table on APAC - Year-over-year growth 2025-2030 (%)
Chart on Regional Comparison - APAC
Data Table on Regional Comparison - APAC

12.3.1 China - Market size and forecast 2025-2030

Chart on China - Market size and forecast 2025-2030 ($ million)
Data Table on China - Market size and forecast 2025-2030 ($ million)
Chart on China - Year-over-year growth 2025-2030 (%)
Data Table on China - Year-over-year growth 2025-2030 (%)

12.3.2 India - Market size and forecast 2025-2030

Chart on India - Market size and forecast 2025-2030 ($ million)
Data Table on India - Market size and forecast 2025-2030 ($ million)
Chart on India - Year-over-year growth 2025-2030 (%)
Data Table on India - Year-over-year growth 2025-2030 (%)

12.3.3 Japan - Market size and forecast 2025-2030

Chart on Japan - Market size and forecast 2025-2030 ($ million)
Data Table on Japan - Market size and forecast 2025-2030 ($ million)
Chart on Japan - Year-over-year growth 2025-2030 (%)
Data Table on Japan - Year-over-year growth 2025-2030 (%)

12.3.4 South Korea - Market size and forecast 2025-2030

Chart on South Korea - Market size and forecast 2025-2030 ($ million)
Data Table on South Korea - Market size and forecast 2025-2030 ($ million)
Chart on South Korea - Year-over-year growth 2025-2030 (%)
Data Table on South Korea - Year-over-year growth 2025-2030 (%)

12.3.5 Australia - Market size and forecast 2025-2030

Chart on Australia - Market size and forecast 2025-2030 ($ million)
Data Table on Australia - Market size and forecast 2025-2030 ($ million)
Chart on Australia - Year-over-year growth 2025-2030 (%)
Data Table on Australia - Year-over-year growth 2025-2030 (%)

12.3.6 Indonesia - Market size and forecast 2025-2030

Chart on Indonesia - Market size and forecast 2025-2030 ($ million)
Data Table on Indonesia - Market size and forecast 2025-2030 ($ million)
Chart on Indonesia - Year-over-year growth 2025-2030 (%)
Data Table on Indonesia - Year-over-year growth 2025-2030 (%)

12.4 North America - Market size and forecast 2025-2030

Chart on North America - Market size and forecast 2025-2030 ($ million)
Data Table on North America - Market size and forecast 2025-2030 ($ million)
Chart on North America - Year-over-year growth 2025-2030 (%)
Data Table on North America - Year-over-year growth 2025-2030 (%)
Chart on Regional Comparison - North America
Data Table on Regional Comparison - North America

12.4.1 US - Market size and forecast 2025-2030

Chart on US - Market size and forecast 2025-2030 ($ million)
Data Table on US - Market size and forecast 2025-2030 ($ million)
Chart on US - Year-over-year growth 2025-2030 (%)
Data Table on US - Year-over-year growth 2025-2030 (%)

12.4.2 Canada - Market size and forecast 2025-2030

Chart on Canada - Market size and forecast 2025-2030 ($ million)
Data Table on Canada - Market size and forecast 2025-2030 ($ million)
Chart on Canada - Year-over-year growth 2025-2030 (%)
Data Table on Canada - Year-over-year growth 2025-2030 (%)

12.4.3 Mexico - Market size and forecast 2025-2030

Chart on Mexico - Market size and forecast 2025-2030 ($ million)
Data Table on Mexico - Market size and forecast 2025-2030 ($ million)
Chart on Mexico - Year-over-year growth 2025-2030 (%)
Data Table on Mexico - Year-over-year growth 2025-2030 (%)

12.5 Europe - Market size and forecast 2025-2030

Chart on Europe - Market size and forecast 2025-2030 ($ million)
Data Table on Europe - Market size and forecast 2025-2030 ($ million)
Chart on Europe - Year-over-year growth 2025-2030 (%)
Data Table on Europe - Year-over-year growth 2025-2030 (%)
Chart on Regional Comparison - Europe
Data Table on Regional Comparison - Europe

12.5.1 Germany - Market size and forecast 2025-2030

Chart on Germany - Market size and forecast 2025-2030 ($ million)
Data Table on Germany - Market size and forecast 2025-2030 ($ million)
Chart on Germany - Year-over-year growth 2025-2030 (%)
Data Table on Germany - Year-over-year growth 2025-2030 (%)

12.5.2 UK - Market size and forecast 2025-2030

Chart on UK - Market size and forecast 2025-2030 ($ million)
Data Table on UK - Market size and forecast 2025-2030 ($ million)
Chart on UK - Year-over-year growth 2025-2030 (%)
Data Table on UK - Year-over-year growth 2025-2030 (%)

12.5.3 France - Market size and forecast 2025-2030

Chart on France - Market size and forecast 2025-2030 ($ million)
Data Table on France - Market size and forecast 2025-2030 ($ million)
Chart on France - Year-over-year growth 2025-2030 (%)
Data Table on France - Year-over-year growth 2025-2030 (%)

12.5.4 Italy - Market size and forecast 2025-2030

Chart on Italy - Market size and forecast 2025-2030 ($ million)
Data Table on Italy - Market size and forecast 2025-2030 ($ million)
Chart on Italy - Year-over-year growth 2025-2030 (%)
Data Table on Italy - Year-over-year growth 2025-2030 (%)

12.5.5 Spain - Market size and forecast 2025-2030

Chart on Spain - Market size and forecast 2025-2030 ($ million)
Data Table on Spain - Market size and forecast 2025-2030 ($ million)
Chart on Spain - Year-over-year growth 2025-2030 (%)
Data Table on Spain - Year-over-year growth 2025-2030 (%)

12.5.6 The Netherlands - Market size and forecast 2025-2030

Chart on The Netherlands - Market size and forecast 2025-2030 ($ million)
Data Table on The Netherlands - Market size and forecast 2025-2030 ($ million)
Chart on The Netherlands - Year-over-year growth 2025-2030 (%)
Data Table on The Netherlands - Year-over-year growth 2025-2030 (%)

12.6 Middle East and Africa - Market size and forecast 2025-2030

Chart on Middle East and Africa - Market size and forecast 2025-2030 ($ million)
Data Table on Middle East and Africa - Market size and forecast 2025-2030 ($ million)
Chart on Middle East and Africa - Year-over-year growth 2025-2030 (%)
Data Table on Middle East and Africa - Year-over-year growth 2025-2030 (%)
Chart on Regional Comparison - Middle East and Africa
Data Table on Regional Comparison - Middle East and Africa

12.6.1 Saudi Arabia - Market size and forecast 2025-2030

Chart on Saudi Arabia - Market size and forecast 2025-2030 ($ million)
Data Table on Saudi Arabia - Market size and forecast 2025-2030 ($ million)
Chart on Saudi Arabia - Year-over-year growth 2025-2030 (%)
Data Table on Saudi Arabia - Year-over-year growth 2025-2030 (%)

12.6.2 UAE - Market size and forecast 2025-2030

Chart on UAE - Market size and forecast 2025-2030 ($ million)
Data Table on UAE - Market size and forecast 2025-2030 ($ million)
Chart on UAE - Year-over-year growth 2025-2030 (%)
Data Table on UAE - Year-over-year growth 2025-2030 (%)

12.6.3 South Africa - Market size and forecast 2025-2030

Chart on South Africa - Market size and forecast 2025-2030 ($ million)
Data Table on South Africa - Market size and forecast 2025-2030 ($ million)
Chart on South Africa - Year-over-year growth 2025-2030 (%)
Data Table on South Africa - Year-over-year growth 2025-2030 (%)

12.6.4 Turkey - Market size and forecast 2025-2030

Chart on Turkey - Market size and forecast 2025-2030 ($ million)
Data Table on Turkey - Market size and forecast 2025-2030 ($ million)
Chart on Turkey - Year-over-year growth 2025-2030 (%)
Data Table on Turkey - Year-over-year growth 2025-2030 (%)

12.6.5 Egypt - Market size and forecast 2025-2030

Chart on Egypt - Market size and forecast 2025-2030 ($ million)
Data Table on Egypt - Market size and forecast 2025-2030 ($ million)
Chart on Egypt - Year-over-year growth 2025-2030 (%)
Data Table on Egypt - Year-over-year growth 2025-2030 (%)

12.7 South America - Market size and forecast 2025-2030

Chart on South America - Market size and forecast 2025-2030 ($ million)
Data Table on South America - Market size and forecast 2025-2030 ($ million)
Chart on South America - Year-over-year growth 2025-2030 (%)
Data Table on South America - Year-over-year growth 2025-2030 (%)
Chart on Regional Comparison - South America
Data Table on Regional Comparison - South America

12.7.1 Brazil - Market size and forecast 2025-2030

Chart on Brazil - Market size and forecast 2025-2030 ($ million)
Data Table on Brazil - Market size and forecast 2025-2030 ($ million)
Chart on Brazil - Year-over-year growth 2025-2030 (%)
Data Table on Brazil - Year-over-year growth 2025-2030 (%)

12.7.2 Argentina - Market size and forecast 2025-2030

Chart on Argentina - Market size and forecast 2025-2030 ($ million)
Data Table on Argentina - Market size and forecast 2025-2030 ($ million)
Chart on Argentina - Year-over-year growth 2025-2030 (%)
Data Table on Argentina - Year-over-year growth 2025-2030 (%)

12.7.3 Colombia - Market size and forecast 2025-2030

Chart on Colombia - Market size and forecast 2025-2030 ($ million)
Data Table on Colombia - Market size and forecast 2025-2030 ($ million)
Chart on Colombia - Year-over-year growth 2025-2030 (%)
Data Table on Colombia - Year-over-year growth 2025-2030 (%)

12.8 Market opportunity by geography

Market opportunity by geography ($ million)
Data Tables on Market opportunity by geography ($ million)

13. Drivers, Challenges, and Opportunity

13.1 Market drivers

Stringent environmental regulations and landfill diversion mandates
Growing emphasis on circular economy and corporate sustainability (ESG)
Compelling economic incentives and operational cost reduction

13.2 Market challenges

High initial capital investment and total cost of ownership
Operational complexity and maintenance requirements
Lack of awareness and competition from traditional disposal methods

13.3 Impact of drivers and challenges

Impact of drivers and challenges in 2025 and 2030

13.4 Market opportunities

Integration of smart technology and internet of things (IoT)
Emergence of decentralized and modular waste management solutions
Intensified focus on high-value output and advanced resource valorization

14. Competitive Landscape

14.1 Overview

14.2

Overview on criticality of inputs and factors of differentiation

14.3 Landscape disruption

Overview on factors of disruption

14.4 Industry risks

Impact of key risks on business

15. Competitive Analysis

15.1 Companies profiled

Companies covered

15.2 Company ranking index

15.3 Market positioning of companies

Matrix on companies position and classification

15.4 Big Hanna Composter

Big Hanna Composter - Overview
Big Hanna Composter - Product / Service
Big Hanna Composter - Key offerings
SWOT

15.5 DP CleanTech Co. Ltd.

DP CleanTech Co. Ltd. - Overview
DP CleanTech Co. Ltd. - Product / Service
DP CleanTech Co. Ltd. - Key offerings
SWOT

15.6 Eco Pollutech

Eco Pollutech - Overview
Eco Pollutech - Product / Service
Eco Pollutech - Key offerings
SWOT

15.7 Ecocompost Machineries

Ecocompost Machineries - Overview
Ecocompost Machineries - Product / Service
Ecocompost Machineries - Key offerings
SWOT

15.8 EcoRich LLC

EcoRich LLC - Overview
EcoRich LLC - Product / Service
EcoRich LLC - Key offerings
SWOT

15.9 HomeBiogas Ltd

HomeBiogas Ltd - Overview
HomeBiogas Ltd - Product / Service
HomeBiogas Ltd - Key offerings
SWOT

15.10 Kelvin Water Technologies

Kelvin Water Technologies - Overview
Kelvin Water Technologies - Product / Service
Kelvin Water Technologies - Key offerings
SWOT

15.11 Lystek International Inc.

Lystek International Inc. - Overview
Lystek International Inc. - Product / Service
Lystek International Inc. - Key offerings
SWOT

15.12 Oklin International Ltd.

Oklin International Ltd. - Overview
Oklin International Ltd. - Product / Service
Oklin International Ltd. - Key offerings
SWOT

15.13 Recoup Technologies Inc.

Recoup Technologies Inc. - Overview
Recoup Technologies Inc. - Product / Service
Recoup Technologies Inc. - Key offerings
SWOT

15.14 RecyclingInside

RecyclingInside - Overview
RecyclingInside - Product / Service
RecyclingInside - Key offerings
SWOT

15.15 Reddonatura

Reddonatura - Overview
Reddonatura - Product / Service
Reddonatura - Key offerings
SWOT

15.16 Smartenviro Systems

Smartenviro Systems - Overview
Smartenviro Systems - Product / Service
Smartenviro Systems - Key offerings
SWOT

15.17 Solwearth Ecotech

Solwearth Ecotech - Overview
Solwearth Ecotech - Product / Service
Solwearth Ecotech - Key offerings
SWOT

15.18 WasteX Pte. Ltd.

WasteX Pte. Ltd. - Overview
WasteX Pte. Ltd. - Product / Service
WasteX Pte. Ltd. - Key offerings
SWOT

16. Appendix

16.1 Scope of the report

Market definition
Objectives
Notes and caveats

16.2 Inclusions and exclusions checklist

Inclusions checklist
Exclusions checklist

16.3 Currency conversion rates for US$

16.4 Research methodology

16.5 Data procurement

Information sources

16.6 Data validation

16.7 Validation techniques employed for market sizing

16.8 Data synthesis

16.9 360 degree market analysis

16.10 List of abbreviations

Research Methodology

Technavio presents a detailed picture of the market by way of study, synthesis, and summation of data from multiple sources. The analysts have presented the various facets of the market with a particular focus on identifying the key industry influencers. The data thus presented is comprehensive, reliable, and the result of extensive research, both primary and secondary.

INFORMATION SOURCES

Primary sources

  • Manufacturers and suppliers
  • Channel partners
  • Industry experts
  • Strategic decision makers

Secondary sources

  • Industry journals and periodicals
  • Government data
  • Financial reports of key industry players
  • Historical data
  • Press releases

DATA ANALYSIS

Data Synthesis

  • Collation of data
  • Estimation of key figures
  • Analysis of derived insights

Data Validation

  • Triangulation with data models
  • Reference against proprietary databases
  • Corroboration with industry experts

REPORT WRITING

Qualitative

  • Market drivers
  • Market challenges
  • Market trends
  • Five forces analysis

Quantitative

  • Market size and forecast
  • Market segmentation
  • Geographical insights
  • Competitive landscape

Interested in this report?

Get your sample now to see our research methodology and insights!

Download Now

Frequently Asked Questions

Organic Waste Converter Machine market growth will increase by USD 147.1 million during 2026-2030 .

The Organic Waste Converter Machine market is expected to grow at a CAGR of 8.4% during 2026-2030 .

Organic Waste Converter Machine market is segmented by Type (Batch feed, Continuous feed) Product type (Gasoline, Electric) End-user (Commercial, Industrial, Residential, Agricultural)

Big Hanna Composter, Biowaste Energy Ventures, DP CleanTech Co. Ltd., earthcare, Eco Pollutech, Ecocompost Machineries, EcoRich LLC, Excel Industries, HomeBiogas Ltd, Kelvin Water Technologies, Lystek International Inc., Oklin International Ltd., Recoup Technologies Inc., RecyclingInside, Reddonatura, Smartenviro Systems, Solwearth Ecotech, WasteX Pte. Ltd. are a few of the key vendors in the Organic Waste Converter Machine market.

APAC will register the highest growth rate of 47.2% among the other regions. Therefore, the Organic Waste Converter Machine market in APAC is expected to garner significant business opportunities for the vendors during the forecast period.

China, India, Japan, South Korea, Australia, Indonesia, US, Canada, Mexico, Germany, UK, France, Italy, Spain, The Netherlands, Saudi Arabia, UAE, South Africa, Turkey, Egypt, Brazil, Argentina, Colombia

  • Stringent environmental regulations and landfill diversion mandates is the driving factor this market.

The Organic Waste Converter Machine market vendors should focus on grabbing business opportunities from the Type segment as it accounted for the largest market share in the base year.