Packaged Edible Flower Market Analysis Europe,North America,APAC,South America,Middle East and Africa - US,Japan,Germany,UK,France - Size and Forecast 2024-2028

Packaged Edible Flower Market Analysis Europe,North America,APAC,South America,Middle East and Africa - US,Japan,Germany,UK,France - Size and Forecast 2024-2028

Published: Dec 2023 162 Pages SKU: IRTNTR74009

Market Overview at a Glance

$63.58 Mn
Market Opportunity
5.76%
CAGR
5.2
YoY growth 2023-2024(%)

Packaged Edible Flower Market Size 2024-2028

The packaged edible flower market size is forecast to increase by USD 63.58 million at a CAGR of 5.76% between 2023 and 2028.

  • The Packaged Edible Flowers market is experiencing significant growth due to the increasing demand for visually appealing food presentations, with edible flowers serving as popular garnishing agents in the food industry. This trend is particularly prominent in the hospitality sector, where aesthetics play a crucial role in customer experience. However, the market is not without challenges. The risk of allergies and side effects associated with certain edible flowers poses a significant threat, necessitating stringent quality control measures and clear labeling. Furthermore, consumer awareness and education regarding the safe consumption of edible flowers are essential to mitigate potential health risks.
  • Companies seeking to capitalize on this market opportunity must prioritize product safety, invest in research and development for allergy-friendly alternatives, and adopt effective marketing strategies to reach their target audience. Navigating these challenges requires a deep understanding of consumer preferences, regulatory requirements, and market dynamics. By staying informed and agile, businesses can successfully capitalize on the growing demand for packaged edible flowers and differentiate themselves in a competitive landscape.

What will be the Size of the Packaged Edible Flower Market during the forecast period?

Packaged Edible Flower Market Size

 Request Free Sample

  • The market is experiencing significant growth as consumers seek out natural flavoring agents and garnishing agents for their nutritional food additives. Peanut sauce and various food dishes are now incorporating these flowers for their unique tastes and health benefits. Etlingera elatior, also known as edible roses, is a popular choice due to its high iron content and antioxidant properties. The pharmaceutical industries are also taking notice, using these flowers as nutraceutical ingredients in antioxidant-rich supplements and anti-aging products. Nutritional experts endorse the use of these flowers for skin health and rejuvenation, further fueling market demand. Customers' dining habits have shifted towards health consciousness, leading to increased interest in nutritional food additives and garnishing agents.
  • Edible flowers offer a visually appealing and delicious way to enhance the flavor and presentation of dishes. The market for nutraceutical supplements and goods continues to expand, with edible flowers playing an essential role. The use of these flowers as flavouring ingredients in food and beverage products is also on the rise. In summary, the market is witnessing dynamic growth as consumers and industries alike recognize their value as natural flavoring and garnishing agents, as well as their nutritional benefits. From skin health to food presentation, these flowers are making a mark in various industries.

How is this Packaged Edible Flower Industry segmented?

The packaged edible flower industry research report provides comprehensive data (region-wise segment analysis), with forecasts and estimates in "USD million" for the period 2024-2028, as well as historical data from 2018-2022 for the following segments.

  • Product
    • Edible rose
    • Edible dandelion
    • Edible hibiscus
    • Others
  • Application
    • Baking
    • Tea
    • Seasoning
    • Others
  • Geography
    • North America
      • US
    • Europe
      • France
      • Germany
      • UK
    • Middle East and Africa
      • APAC
        • Japan
      • South America
        • Rest of World (ROW)

        By Product Insights

        The edible rose segment is estimated to witness significant growth during the forecast period.

        Roses, renowned for their allure and fragrance, are extensively utilized in the food and beverage industry. Rose petals, rich in vitamins A and E, are incorporated into nutrition-rich diets due to their low calorie and high water content. The flavor and taste of rose petals vary depending on their type, color, and growing conditions. For instance, the fragrant and appealing Rugosa roses are known for their distinctive taste. Rose petals, comprising 95% water, have been used in traditional Chinese medicine to alleviate menstrual disorders and digestive issues. In the nutraceutical industry, rosehips are valued for their antioxidant properties and cooling effect.

        They are used in the production of skin rejuvenation supplements and beverages. Rose vinegar, a popular condiment, adds flavor to various dishes and is also used for medicinal purposes. Marinades and relishes, infused with rose petals, offer unique taste experiences. The pharmaceutical industry employs rose extracts for their anti-inflammatory and anti-convulsant properties. Rose water, a byproduct of rose distillation, is used as a garnishing agent and in the production of garnishing cakes, cookies, and chocolates. Rose oil, derived from the petals, is used as a flavoring agent in various foods and beverages. Lavender, another popular edible flower, is known for its calming and soothing properties.

        It is used in the production of nutraceutical goods, teas, and skin health supplements. Hibiscus sabdariffa, a common ingredient in fruit preserves and jams, is rich in antioxidants and is believed to lower blood pressure. Marigold petals, used as a garnishing agent, are rich in beta-carotene and are known to have anti-inflammatory properties. Pollen grains, derived from various flowers, are used as nutritional food additives and are believed to have numerous health benefits. Iron-rich Etlingera elatior, also known as ginger flower, is used in the production of various food dishes and added flavors. In summary, flowers play a significant role in the food and beverage industry, offering unique flavors, textures, and health benefits.

        From rose petals to lavender, hibiscus, and marigold, these edible flowers are used in various forms, including fresh, dried, and extracts, to enhance the taste and nutritional value of food and beverages.

        Packaged Edible Flower Market Size

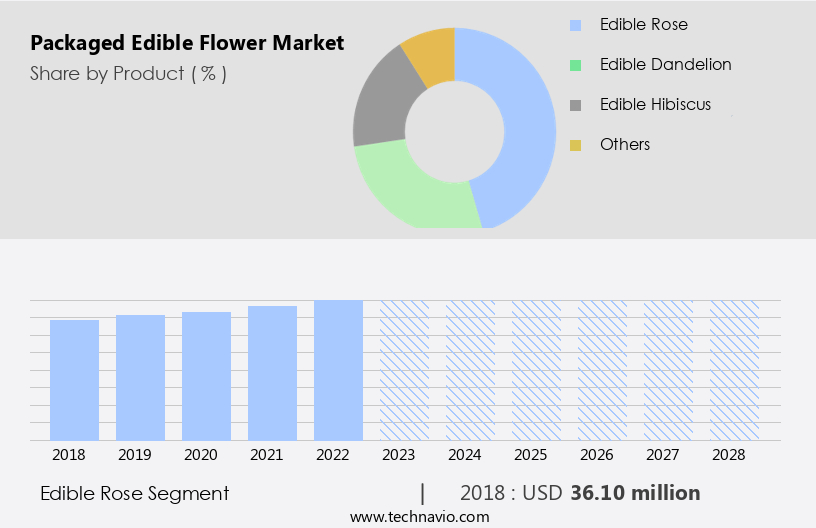
        Get a glance at the market report of share of various segments Request Free Sample

        The Edible rose segment was valued at USD 36.10 million in 2018 and showed a gradual increase during the forecast period.

        Regional Analysis

        Europe is estimated to contribute 37% to the growth of the global market during the forecast period.Technavio’s analysts have elaborately explained the regional trends and drivers that shape the market during the forecast period.

        Packaged Edible Flower Market Share by Geography

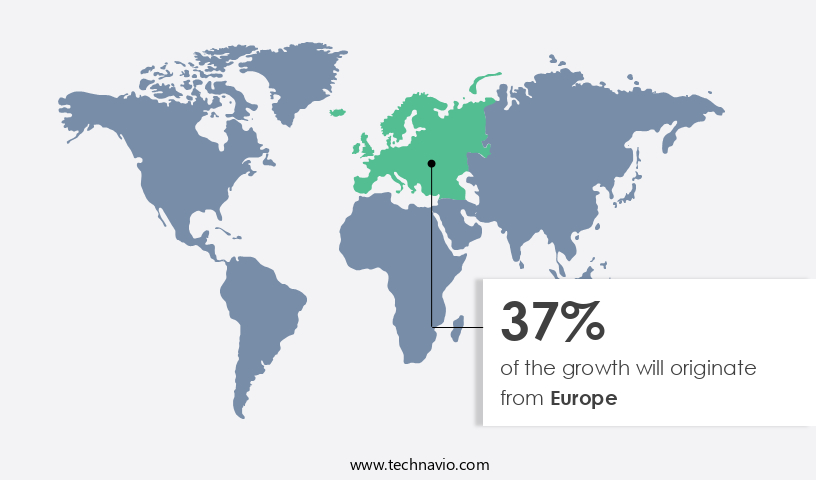
        For more insights on the market size of various regions, Request Free Sample

        Edible flowers, such as roses and pansies, are increasingly gaining popularity in the European food and beverage industry due to their aesthetic appeal and nutritional benefits. The Netherlands, a major player in this market, significantly contributes to the sector with its large-scale production of packaged edibles flowers. According to the Observatory of Economic Complexity (OEC), in 2020, the Netherlands exported edible flowers worth USD86.2 million, making it the top exporter in Europe. The nutritional value of edible flowers extends beyond aesthetics, as they are rich in antioxidants, vitamins, and minerals like iron. These flowers are used as garnishing agents in various dishes, including salads, soups, and desserts.

        For instance, hibiscus flowers are commonly used to add flavor and color to teas and marinades, while marigold flowers are used for skin health benefits in both food and cosmetic industries. Moreover, the nutraceutical industry has shown a growing interest in edible flowers for their potential health benefits. Skin rejuvenation supplements, for example, often contain rosehip or lavender flowers, while rose vinegar is used for digestive issues like ulcers and cholesterol. Moringa and Etlingera elatior flowers are popular for their anti-aging properties. Food garnishing is another area where edible flowers play a significant role. They add visual appeal to dishes and can be used as a lightweight, flavoring agent in various forms, such as powders or extracts.

        Garnishing agents made from edible flowers, like jasmine or rose petals, are often used in cakes, chocolates, and pastries. In conclusion, the edible flowers market is witnessing steady growth due to their nutritional value, aesthetic appeal, and versatility in various industries, including food and beverage, nutraceuticals, and cosmetics. The Netherlands, with its large-scale production and export of packaged edible flowers, remains a key player in this market.

        Market Dynamics

        Our researchers analyzed the data with 2023 as the base year, along with the key drivers, trends, and challenges. A holistic analysis of drivers will help companies refine their marketing strategies to gain a competitive advantage.

        What are the key market drivers leading to the rise in the adoption of Packaged Edible Flower Industry?

        • Demand for photogenic food is the key driver of the market. 

        • The market is experiencing significant growth due to the increasing demand for visually appealing food. Edible flowers add an aesthetic value to dishes, making them more photogenic and desirable, particularly in the age of social media. With the rise of platforms like Facebook and Instagram, food photography has become a trend, leading to the popularization of "food porn." Edible flowers, with their vibrant colors, delicate textures, and unique shapes, are becoming a preferred choice for food garnishing and decoration.
        • This market trend is driven by consumers' preference for visually appealing foods that are not only delicious but also pleasing to the eye. The demand for packaged edible flowers is expected to continue growing as more consumers seek to enhance the visual appeal of their meals.

        What are the market trends shaping the Packaged Edible Flower Industry?

        • Edible flowers as garnishing agents is the upcoming market trend. 

        • Edible flowers, known for their vibrant colors, have gained significant popularity in the food and beverage industry due to their aesthetic appeal. These flowers, such as pansies, nasturtium, borage, rose, lavender, and viola, are used for garnishing and decorating various food and beverage products. For instance, sugared and egg white-dipped pansies can enhance the appearance of cakes, while bright-colored flowers like nasturtium and borage make salads more attractive. Small edible flowers can also be frozen into ice cubes to add a unique touch to summer drinks.
        • The demand for edible flowers is particularly high among chefs and bartenders of high-end restaurants, making it a positive trend for the market. This trend is expected to drive the growth of the market during the forecast period. Edible flowers offer an opportunity for culinary artists to showcase their creativity, thereby increasing their demand and boosting market growth.

        What challenges does the Packaged Edible Flower Industry face during its growth?

        • Risks of allergies and side effects is a key challenge affecting the industry growth. 

        • Edible flowers, while visually appealing and used in various culinary applications, can pose health risks for certain individuals. Allergic reactions to these flowers can manifest in various ways, including itchy eyes, sneezing fits, or a runny nose, often due to the pollen they produce. Dahlia and sunflower are among the flowers known to cause such reactions. The foliage of sweet alyssum and some other edible flowers can also lead to skin irritation. The leaves of chrysanthemum and sunflower may cause a burning sensation and skin rashes for those with sensitive skin conditions.
        • Notably, flowers from the aster or daisy family, including dahlia, are both attractive and popular edible options but are also responsible for causing the majority of allergic reactions. It is essential to exercise caution and consider potential health risks when incorporating edible flowers into food products or personal consumption.

        Exclusive Customer Landscape

        The packaged edible flower market forecasting report includes the adoption lifecycle of the market, covering from the innovator’s stage to the laggard’s stage. It focuses on adoption rates in different regions based on penetration. Furthermore, the packaged edible flower market report also includes key purchase criteria and drivers of price sensitivity to help companies evaluate and develop their market growth analysis strategies.
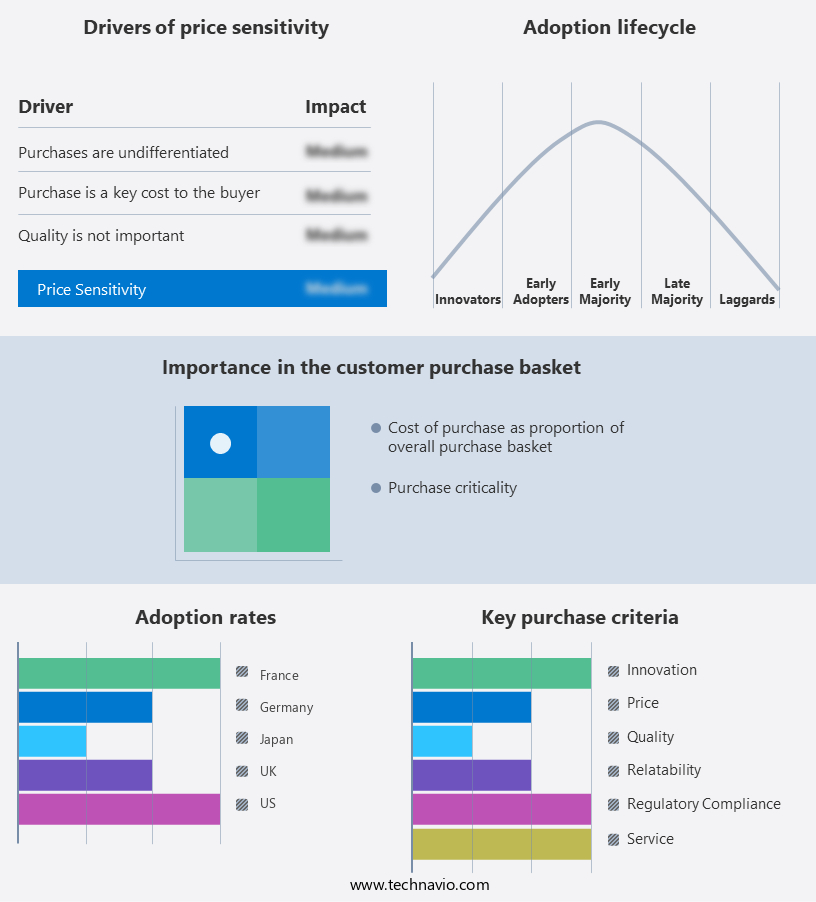
        Packaged Edible Flower Market Share by Geography

         Customer Landscape

        Key Companies & Market Insights

        Companies are implementing various strategies, such as strategic alliances, packaged edible flower market forecast, partnerships, mergers and acquisitions, geographical expansion, and product/service launches, to enhance their presence in the industry.

        Cherry Valley Organics - The company specializes in providing an array of packaged edible flowers, including Delicate mix, Petite mix, Celosia kimono mix, and Gomphrena. These vibrant blooms add aesthetic appeal and unique flavors to various dishes, enhancing culinary creations worldwide. With a focus on quality and freshness, the company caters to the growing demand for visually stunning and edible floral ingredients. These offerings expand the possibilities for chefs and home cooks, inspiring innovative and delicious presentations.

        The industry research and growth report includes detailed analyses of the competitive landscape of the market and information about key companies, including:

        • Cherry Valley Organics
        • Farm.One Inc.
        • Flowerdale Farm
        • Fresh Origins
        • Frugivore India Pvt. Ltd.
        • Gourmet Sweet Botanicals LLC
        • Herbs Unlimited
        • Little Wild Things
        • Maddocks Farm Organics
        • Marius Auda
        • Nurtured In Norfolk Ltd.
        • Petite Ingredient

        Qualitative and quantitative analysis of companies has been conducted to help clients understand the wider business environment as well as the strengths and weaknesses of key industry players. Data is qualitatively analyzed to categorize companies as pure play, category-focused, industry-focused, and diversified; it is quantitatively analyzed to categorize companies as dominant, leading, strong, tentative, and weak.

        Research Analyst Overview

        The market has experienced significant growth in recent years, driven by the increasing demand for nutrition-rich diets and the exploration of new flavors and textures in the food and beverage industry. Edible flowers, such as pansies, roses, and hibiscus, are increasingly being used as garnishing agents in various dishes and beverages. The nutritional food industry and pharmaceutical industries have also shown interest in edible flowers due to their health benefits. For instance, flowers like Etlingera elatior and moringa are rich in antioxidants, which provide a cooling effect and contribute to skin rejuvenation. Rose vinegar, a popular condiment, is known for its anti-inflammatory properties and has been used for medicinal purposes for centuries.

        The use of edible flowers extends beyond food and beverages. They are also used as nutraceutical goods, such as skin health supplements and antioxidant supplements. Rose and hibiscus are popular ingredients in skin irritation supplements, while lavender is used in tea for relaxation and stress relief. The market for edible flowers is diverse, with applications ranging from marinades and relishes to jams and fruit preserves. These flowers add not only flavor but also visual appeal to dishes, making them a popular choice among customers with a growing health consciousness. Edible flowers are also used as garnishing agents in various food dishes, such as salads, soups, and even baked goods like cakes and cookies.

        They add a lightweight, flavorful touch to these dishes, enhancing the overall dining experience. Moreover, edible flowers are finding their way into various food and beverage products, such as peanut sauce, butter, and tea. These flowers are often used in powdered forms or as flavoring agents, providing a subtle yet distinct taste to these products. The use of edible flowers as nutraceutical ingredients is a growing trend, with companies exploring their potential in various applications. For example, hibiscus sabdariffa is used in nutraceutical supplements to help manage cholesterol levels, while rose is used to help regulate blood pressure. Despite the numerous benefits of edible flowers, there are some challenges in the market.

        For instance, the harvesting and packaging process can be complex, as these flowers are delicate and require careful handling to maintain their freshness and texture. Additionally, the use of certain edible flowers, such as marigold, can cause diarrhea and convulsions in some individuals, highlighting the importance of proper labeling and consumer education. In conclusion, the market is a dynamic and evolving industry, driven by the growing demand for nutrition-rich foods and the exploration of new flavors and textures. From food and beverage applications to nutraceutical goods and medicinal purposes, the potential uses of edible flowers are vast and continue to expand.

        However, careful handling and proper labeling are essential to ensure the safety and quality of these products.

        Market Scope

        Report Coverage

        Details

        Page number

        162

        Base year

        2023

        Historic period

        2018-2022

        Forecast period

        2024-2028

        Growth momentum & CAGR

        Accelerate at a CAGR of 5.76%

        Market growth 2024-2028

        USD 63.58 million

        Market structure

        Concentrated

        YoY growth 2023-2024(%)

        5.2

        Key countries

        US, Japan, Germany, UK, and France

        Competitive landscape

        Leading Companies, Market Positioning of Companies, Competitive Strategies, and Industry Risks

        Request Free Sample

        What are the Key Data Covered in this Packaged Edible Flower Market Research and Growth Report?

        • CAGR of the Packaged Edible Flower industry during the forecast period
        • Detailed information on factors that will drive the growth and forecasting between 2024 and 2028
        • Precise estimation of the size of the market and its contribution of the industry in focus to the parent market
        • Accurate predictions about upcoming growth and trends and changes in consumer behaviour
        • Growth of the market across Europe, North America, APAC, South America, and Middle East and Africa
        • Thorough analysis of the market’s competitive landscape and detailed information about companies
        • Comprehensive analysis of factors that will challenge the packaged edible flower market growth of industry companies

        We can help! Our analysts can customize this packaged edible flower market research report to meet your requirements.

        Get in touch


        1 Executive Summary

        • 1.1 Market overview
          • Exhibit 01: Executive Summary – Chart on Market Overview
          • Exhibit 02: Executive Summary – Data Table on Market Overview
          • Exhibit 03: Executive Summary – Chart on Global Market Characteristics
          • Exhibit 04: Executive Summary – Chart on Market by Geography
          • Exhibit 05: Executive Summary – Chart on Market Segmentation by Product
          • Exhibit 06: Executive Summary – Chart on Market Segmentation by Application
          • Exhibit 07: Executive Summary – Chart on Incremental Growth
          • Exhibit 08: Executive Summary – Data Table on Incremental Growth
          • Exhibit 09: Executive Summary – Chart on Vendor Market Positioning

        2 Market Landscape

        • 2.1 Market ecosystem
          • Exhibit 10: Parent market
          • Exhibit 11: Market Characteristics

        3 Market Sizing

        • 3.1 Market definition
          • Exhibit 12: Offerings of vendors included in the market definition
        • 3.2 Market segment analysis
          • Exhibit 13: Market segments
        • 3.3 Market size 2023
          • 3.4 Market outlook: Forecast for 2023-2028
            • Exhibit 14: Chart on Global - Market size and forecast 2023-2028 ($ million)
            • Exhibit 15: Data Table on Global - Market size and forecast 2023-2028 ($ million)
            • Exhibit 16: Chart on Global Market: Year-over-year growth 2023-2028 (%)
            • Exhibit 17: Data Table on Global Market: Year-over-year growth 2023-2028 (%)

          4 Historic Market Size

          • 4.1 Global packaged edible flower market 2018 - 2022
            • Exhibit 18: Historic Market Size – Data Table on global packaged edible flower market 2018 - 2022 ($ million)
          • 4.2 Product Segment Analysis 2018 - 2022
            • Exhibit 19: Historic Market Size – Product Segment 2018 - 2022 ($ million)
          • 4.3 Application Segment Analysis 2018 - 2022
            • Exhibit 20: Historic Market Size – Application Segment 2018 - 2022 ($ million)
          • 4.4 Geography Segment Analysis 2018 - 2022
            • Exhibit 21: Historic Market Size – Geography Segment 2018 - 2022 ($ million)
          • 4.5 Country Segment Analysis 2018 - 2022
            • Exhibit 22: Historic Market Size – Country Segment 2018 - 2022 ($ million)

          5 Five Forces Analysis

          • 5.1 Five forces summary
            • Exhibit 23: Five forces analysis - Comparison between 2023 and 2028
          • 5.2 Bargaining power of buyers
            • Exhibit 24: Chart on Bargaining power of buyers – Impact of key factors 2023 and 2028
          • 5.3 Bargaining power of suppliers
            • Exhibit 25: Bargaining power of suppliers – Impact of key factors in 2023 and 2028
          • 5.4 Threat of new entrants
            • Exhibit 26: Threat of new entrants – Impact of key factors in 2023 and 2028
          • 5.5 Threat of substitutes
            • Exhibit 27: Threat of substitutes – Impact of key factors in 2023 and 2028
          • 5.6 Threat of rivalry
            • Exhibit 28: Threat of rivalry – Impact of key factors in 2023 and 2028
          • 5.7 Market condition
            • Exhibit 29: Chart on Market condition - Five forces 2023 and 2028

          6 Market Segmentation by Product

          • 6.1 Market segments
            • Exhibit 30: Chart on Product - Market share 2023-2028 (%)
            • Exhibit 31: Data Table on Product - Market share 2023-2028 (%)
          • 6.2 Comparison by Product
            • Exhibit 32: Chart on Comparison by Product
            • Exhibit 33: Data Table on Comparison by Product
          • 6.3 Edible rose - Market size and forecast 2023-2028
            • Exhibit 34: Chart on Edible rose - Market size and forecast 2023-2028 ($ million)
            • Exhibit 35: Data Table on Edible rose - Market size and forecast 2023-2028 ($ million)
            • Exhibit 36: Chart on Edible rose - Year-over-year growth 2023-2028 (%)
            • Exhibit 37: Data Table on Edible rose - Year-over-year growth 2023-2028 (%)
          • 6.4 Edible dandelion - Market size and forecast 2023-2028
            • Exhibit 38: Chart on Edible dandelion - Market size and forecast 2023-2028 ($ million)
            • Exhibit 39: Data Table on Edible dandelion - Market size and forecast 2023-2028 ($ million)
            • Exhibit 40: Chart on Edible dandelion - Year-over-year growth 2023-2028 (%)
            • Exhibit 41: Data Table on Edible dandelion - Year-over-year growth 2023-2028 (%)
          • 6.5 Edible hibiscus - Market size and forecast 2023-2028
            • Exhibit 42: Chart on Edible hibiscus - Market size and forecast 2023-2028 ($ million)
            • Exhibit 43: Data Table on Edible hibiscus - Market size and forecast 2023-2028 ($ million)
            • Exhibit 44: Chart on Edible hibiscus - Year-over-year growth 2023-2028 (%)
            • Exhibit 45: Data Table on Edible hibiscus - Year-over-year growth 2023-2028 (%)
          • 6.6 Others - Market size and forecast 2023-2028
            • Exhibit 46: Chart on Others - Market size and forecast 2023-2028 ($ million)
            • Exhibit 47: Data Table on Others - Market size and forecast 2023-2028 ($ million)
            • Exhibit 48: Chart on Others - Year-over-year growth 2023-2028 (%)
            • Exhibit 49: Data Table on Others - Year-over-year growth 2023-2028 (%)
          • 6.7 Market opportunity by Product
            • Exhibit 50: Market opportunity by Product ($ million)
            • Exhibit 51: Data Table on Market opportunity by Product ($ million)

          7 Market Segmentation by Application

          • 7.1 Market segments
            • Exhibit 52: Chart on Application - Market share 2023-2028 (%)
            • Exhibit 53: Data Table on Application - Market share 2023-2028 (%)
          • 7.2 Comparison by Application
            • Exhibit 54: Chart on Comparison by Application
            • Exhibit 55: Data Table on Comparison by Application
          • 7.3 Baking - Market size and forecast 2023-2028
            • Exhibit 56: Chart on Baking - Market size and forecast 2023-2028 ($ million)
            • Exhibit 57: Data Table on Baking - Market size and forecast 2023-2028 ($ million)
            • Exhibit 58: Chart on Baking - Year-over-year growth 2023-2028 (%)
            • Exhibit 59: Data Table on Baking - Year-over-year growth 2023-2028 (%)
          • 7.4 Tea - Market size and forecast 2023-2028
            • Exhibit 60: Chart on Tea - Market size and forecast 2023-2028 ($ million)
            • Exhibit 61: Data Table on Tea - Market size and forecast 2023-2028 ($ million)
            • Exhibit 62: Chart on Tea - Year-over-year growth 2023-2028 (%)
            • Exhibit 63: Data Table on Tea - Year-over-year growth 2023-2028 (%)
          • 7.5 Seasoning - Market size and forecast 2023-2028
            • Exhibit 64: Chart on Seasoning - Market size and forecast 2023-2028 ($ million)
            • Exhibit 65: Data Table on Seasoning - Market size and forecast 2023-2028 ($ million)
            • Exhibit 66: Chart on Seasoning - Year-over-year growth 2023-2028 (%)
            • Exhibit 67: Data Table on Seasoning - Year-over-year growth 2023-2028 (%)
          • 7.6 Others - Market size and forecast 2023-2028
            • Exhibit 68: Chart on Others - Market size and forecast 2023-2028 ($ million)
            • Exhibit 69: Data Table on Others - Market size and forecast 2023-2028 ($ million)
            • Exhibit 70: Chart on Others - Year-over-year growth 2023-2028 (%)
            • Exhibit 71: Data Table on Others - Year-over-year growth 2023-2028 (%)
          • 7.7 Market opportunity by Application
            • Exhibit 72: Market opportunity by Application ($ million)
            • Exhibit 73: Data Table on Market opportunity by Application ($ million)

          8 Customer Landscape

          • 8.1 Customer landscape overview
            • Exhibit 74: Analysis of price sensitivity, lifecycle, customer purchase basket, adoption rates, and purchase criteria

          9 Geographic Landscape

          • 9.1 Geographic segmentation
            • Exhibit 75: Chart on Market share by geography 2023-2028 (%)
            • Exhibit 76: Data Table on Market share by geography 2023-2028 (%)
          • 9.2 Geographic comparison
            • Exhibit 77: Chart on Geographic comparison
            • Exhibit 78: Data Table on Geographic comparison
          • 9.3 Europe - Market size and forecast 2023-2028
            • Exhibit 79: Chart on Europe - Market size and forecast 2023-2028 ($ million)
            • Exhibit 80: Data Table on Europe - Market size and forecast 2023-2028 ($ million)
            • Exhibit 81: Chart on Europe - Year-over-year growth 2023-2028 (%)
            • Exhibit 82: Data Table on Europe - Year-over-year growth 2023-2028 (%)
          • 9.4 North America - Market size and forecast 2023-2028
            • Exhibit 83: Chart on North America - Market size and forecast 2023-2028 ($ million)
            • Exhibit 84: Data Table on North America - Market size and forecast 2023-2028 ($ million)
            • Exhibit 85: Chart on North America - Year-over-year growth 2023-2028 (%)
            • Exhibit 86: Data Table on North America - Year-over-year growth 2023-2028 (%)
          • 9.5 APAC - Market size and forecast 2023-2028
            • Exhibit 87: Chart on APAC - Market size and forecast 2023-2028 ($ million)
            • Exhibit 88: Data Table on APAC - Market size and forecast 2023-2028 ($ million)
            • Exhibit 89: Chart on APAC - Year-over-year growth 2023-2028 (%)
            • Exhibit 90: Data Table on APAC - Year-over-year growth 2023-2028 (%)
          • 9.6 South America - Market size and forecast 2023-2028
            • Exhibit 91: Chart on South America - Market size and forecast 2023-2028 ($ million)
            • Exhibit 92: Data Table on South America - Market size and forecast 2023-2028 ($ million)
            • Exhibit 93: Chart on South America - Year-over-year growth 2023-2028 (%)
            • Exhibit 94: Data Table on South America - Year-over-year growth 2023-2028 (%)
          • 9.7 Middle East and Africa - Market size and forecast 2023-2028
            • Exhibit 95: Chart on Middle East and Africa - Market size and forecast 2023-2028 ($ million)
            • Exhibit 96: Data Table on Middle East and Africa - Market size and forecast 2023-2028 ($ million)
            • Exhibit 97: Chart on Middle East and Africa - Year-over-year growth 2023-2028 (%)
            • Exhibit 98: Data Table on Middle East and Africa - Year-over-year growth 2023-2028 (%)
          • 9.8 US - Market size and forecast 2023-2028
            • Exhibit 99: Chart on US - Market size and forecast 2023-2028 ($ million)
            • Exhibit 100: Data Table on US - Market size and forecast 2023-2028 ($ million)
            • Exhibit 101: Chart on US - Year-over-year growth 2023-2028 (%)
            • Exhibit 102: Data Table on US - Year-over-year growth 2023-2028 (%)
          • 9.9 Germany - Market size and forecast 2023-2028
            • Exhibit 103: Chart on Germany - Market size and forecast 2023-2028 ($ million)
            • Exhibit 104: Data Table on Germany - Market size and forecast 2023-2028 ($ million)
            • Exhibit 105: Chart on Germany - Year-over-year growth 2023-2028 (%)
            • Exhibit 106: Data Table on Germany - Year-over-year growth 2023-2028 (%)
          • 9.10 Japan - Market size and forecast 2023-2028
            • Exhibit 107: Chart on Japan - Market size and forecast 2023-2028 ($ million)
            • Exhibit 108: Data Table on Japan - Market size and forecast 2023-2028 ($ million)
            • Exhibit 109: Chart on Japan - Year-over-year growth 2023-2028 (%)
            • Exhibit 110: Data Table on Japan - Year-over-year growth 2023-2028 (%)
          • 9.11 UK - Market size and forecast 2023-2028
            • Exhibit 111: Chart on UK - Market size and forecast 2023-2028 ($ million)
            • Exhibit 112: Data Table on UK - Market size and forecast 2023-2028 ($ million)
            • Exhibit 113: Chart on UK - Year-over-year growth 2023-2028 (%)
            • Exhibit 114: Data Table on UK - Year-over-year growth 2023-2028 (%)
          • 9.12 France - Market size and forecast 2023-2028
            • Exhibit 115: Chart on France - Market size and forecast 2023-2028 ($ million)
            • Exhibit 116: Data Table on France - Market size and forecast 2023-2028 ($ million)
            • Exhibit 117: Chart on France - Year-over-year growth 2023-2028 (%)
            • Exhibit 118: Data Table on France - Year-over-year growth 2023-2028 (%)
          • 9.13 Market opportunity by geography
            • Exhibit 119: Market opportunity by geography ($ million)
            • Exhibit 120: Data Tables on Market opportunity by geography ($ million)

          10 Drivers, Challenges, and Trends

          • 10.1 Market drivers
            • 10.2 Market challenges
              • 10.3 Impact of drivers and challenges
                • Exhibit 121: Impact of drivers and challenges in 2023 and 2028
              • 10.4 Market trends

                11 Vendor Landscape

                • 11.1 Overview
                  • 11.2 Vendor landscape
                    • Exhibit 122: Overview on Criticality of inputs and Factors of differentiation
                  • 11.3 Landscape disruption
                    • Exhibit 123: Overview on factors of disruption
                  • 11.4 Industry risks
                    • Exhibit 124: Impact of key risks on business

                  12 Vendor Analysis

                  • 12.1 Vendors covered
                    • Exhibit 125: Vendors covered
                  • 12.2 Market positioning of vendors
                    • Exhibit 126: Matrix on vendor position and classification
                  • 12.3 Cherry Valley Organics
                    • Exhibit 127: Cherry Valley Organics - Overview
                    • Exhibit 128: Cherry Valley Organics - Product / Service
                    • Exhibit 129: Cherry Valley Organics - Key offerings
                  • 12.4 Farm.One Inc.
                    • Exhibit 130: Farm.One Inc. - Overview
                    • Exhibit 131: Farm.One Inc. - Product / Service
                    • Exhibit 132: Farm.One Inc. - Key offerings
                  • 12.5 Flowerdale Farm
                    • Exhibit 133: Flowerdale Farm - Overview
                    • Exhibit 134: Flowerdale Farm - Product / Service
                    • Exhibit 135: Flowerdale Farm - Key offerings
                  • 12.6 Fresh Origins
                    • Exhibit 136: Fresh Origins - Overview
                    • Exhibit 137: Fresh Origins - Product / Service
                    • Exhibit 138: Fresh Origins - Key offerings
                  • 12.7 Frugivore India Pvt. Ltd.
                    • Exhibit 139: Frugivore India Pvt. Ltd. - Overview
                    • Exhibit 140: Frugivore India Pvt. Ltd. - Product / Service
                    • Exhibit 141: Frugivore India Pvt. Ltd. - Key offerings
                  • 12.8 Gourmet Sweet Botanicals LLC
                    • Exhibit 142: Gourmet Sweet Botanicals LLC - Overview
                    • Exhibit 143: Gourmet Sweet Botanicals LLC - Product / Service
                    • Exhibit 144: Gourmet Sweet Botanicals LLC - Key offerings
                  • 12.9 Herbs Unlimited
                    • Exhibit 145: Herbs Unlimited - Overview
                    • Exhibit 146: Herbs Unlimited - Product / Service
                    • Exhibit 147: Herbs Unlimited - Key offerings
                  • 12.10 Little Wild Things
                    • Exhibit 148: Little Wild Things - Overview
                    • Exhibit 149: Little Wild Things - Product / Service
                    • Exhibit 150: Little Wild Things - Key offerings
                  • 12.11 Maddocks Farm Organics
                    • Exhibit 151: Maddocks Farm Organics - Overview
                    • Exhibit 152: Maddocks Farm Organics - Product / Service
                    • Exhibit 153: Maddocks Farm Organics - Key offerings
                  • 12.12 Marius Auda
                    • Exhibit 154: Marius Auda - Overview
                    • Exhibit 155: Marius Auda - Product / Service
                    • Exhibit 156: Marius Auda - Key offerings
                  • 12.13 Nurtured In Norfolk Ltd.
                    • Exhibit 157: Nurtured In Norfolk Ltd. - Overview
                    • Exhibit 158: Nurtured In Norfolk Ltd. - Product / Service
                    • Exhibit 159: Nurtured In Norfolk Ltd. - Key offerings
                  • 12.14 Petite Ingredient
                    • Exhibit 160: Petite Ingredient - Overview
                    • Exhibit 161: Petite Ingredient - Product / Service
                    • Exhibit 162: Petite Ingredient - Key offerings

                  13 Appendix

                  • 13.1 Scope of the report
                    • 13.2 Inclusions and exclusions checklist
                      • Exhibit 163: Inclusions checklist
                      • Exhibit 164: Exclusions checklist
                    • 13.3 Currency conversion rates for US$
                      • Exhibit 165: Currency conversion rates for US$
                    • 13.4 Research methodology
                      • Exhibit 166: Research methodology
                      • Exhibit 167: Validation techniques employed for market sizing
                      • Exhibit 168: Information sources
                    • 13.5 List of abbreviations
                      • Exhibit 169: List of abbreviations

                    Research Methodology

                    Technavio presents a detailed picture of the market by way of study, synthesis, and summation of data from multiple sources. The analysts have presented the various facets of the market with a particular focus on identifying the key industry influencers. The data thus presented is comprehensive, reliable, and the result of extensive research, both primary and secondary.

                    INFORMATION SOURCES

                    Primary sources

                    • Manufacturers and suppliers
                    • Channel partners
                    • Industry experts
                    • Strategic decision makers

                    Secondary sources

                    • Industry journals and periodicals
                    • Government data
                    • Financial reports of key industry players
                    • Historical data
                    • Press releases

                    DATA ANALYSIS

                    Data Synthesis

                    • Collation of data
                    • Estimation of key figures
                    • Analysis of derived insights

                    Data Validation

                    • Triangulation with data models
                    • Reference against proprietary databases
                    • Corroboration with industry experts

                    REPORT WRITING

                    Qualitative

                    • Market drivers
                    • Market challenges
                    • Market trends
                    • Five forces analysis

                    Quantitative

                    • Market size and forecast
                    • Market segmentation
                    • Geographical insights
                    • Competitive landscape

                    Interested in this report?

                    Get your sample now to see our research methodology and insights!

                    Download Now

                    Frequently Asked Questions

                    Packaged Edible Flower market growth will increase by $ 63.58 mn during 2024-2028 .

                    The Packaged Edible Flower market is expected to grow at a CAGR of 5.76% during 2024-2028 .

                    Packaged Edible Flower market is segmented by Product( Edible rose, Edible dandelion, Edible hibiscus, Others) Application( Baking, Tea, Seasoning, Others, Middle East and Africa)

                    Cherry Valley Organics, Farm.One Inc., Flowerdale Farm, Fresh Origins, Frugivore India Pvt. Ltd., Gourmet Sweet Botanicals LLC, Herbs Unlimited, Little Wild Things, Maddocks Farm Organics, Marius Auda, Nurtured In Norfolk Ltd., Petite Ingredient are a few of the key vendors in the Packaged Edible Flower market.

                    Europe will register the highest growth rate of 37% among the other regions. Therefore, the Packaged Edible Flower market in Europe is expected to garner significant business opportunities for the vendors during the forecast period.

                    US, Japan, Germany, UK, France

                    • Demand for photogenic foodThe need for photogenic food is one of the many factors driving the enormous rise of the global packaged edible flower market. Edible flowers are a key component in elevating the visual attractiveness of dishes is the driving factor this market.
                    • which have been increasingly popular in recent years due to their aesthetic value. As social networking sites like Facebook and Instagram have grown in popularity is the driving factor this market.
                    • more and more individuals are posting photos of their meals. This has led to the rise of "food porn is the driving factor this market.
                    • " when customers look for aesthetically attractive foods that are both tasty and eye-catching. Edible flowers are becoming a popular option for food garnishing and decorating because of their eye-catching hues is the driving factor this market.
                    • delicate textures is the driving factor this market.
                    • and distinctive shapes. In order to draw clients and provide unforgettable dining experiences is the driving factor this market.
                    • restaurants and culinary outlets are taking advantage of this trend. Adding edible flowers to food has become standard practice in restaurants of all kinds is the driving factor this market.
                    • from informal dining establishments to upscale gourmet cuisine. Edible flowers lend an air of refinement and beauty to chefs' dishes is the driving factor this market.
                    • elevating them above simple preparation. Edible flowers are not only visually pleasing but also provide health benefits. Since many edible flowers are high in vitamins is the driving factor this market.
                    • minerals is the driving factor this market.
                    • and antioxidants is the driving factor this market.
                    • they are a popular addition to the diets of customers who are health conscious. The use of packaged edible flowers has increased significantly as a result of the increasing demand for photogenic foods. The freshness is the driving factor this market.
                    • quality is the driving factor this market.
                    • and convenience of these flowers are guaranteed by their meticulous selection is the driving factor this market.
                    • processing is the driving factor this market.
                    • and packaging. They are simple to add to a variety of foods is the driving factor this market.
                    • such as salads is the driving factor this market.
                    • sweets is the driving factor this market.
                    • drinks is the driving factor this market.
                    • and even savory dinners. Thus is the driving factor this market.
                    • the growing demand for photogenic food will drive the growth of the global packaged edible flower market during the forecast period. is the driving factor this market.

                    The Packaged Edible Flower market vendors should focus on grabbing business opportunities from the Edible rose segment as it accounted for the largest market share in the base year.