Payment As A Service Market Analysis APAC, Europe, North America, South America, Middle East and Africa - India, China, US, UK, South Korea - Size and Forecast 2024-2028

Payment As A Service Market Analysis APAC, Europe, North America, South America, Middle East and Africa - India, China, US, UK, South Korea - Size and Forecast 2024-2028

Published: Oct 2024 142 Pages SKU: IRTNTR71642

Market Overview at a Glance

$10.4 Mn
Market Opportunity
17%
CAGR
14.9
YoY growth 2023-2024(%)

Payment As A Service Market Size 2024-2028

The payment as a service market size is forecast to increase by USD 10.4 million at a CAGR of 17% between 2023 and 2028.

  • The Payment as a Service (PaaS) market is experiencing significant growth, driven by the increasing adoption of contactless payment solutions and the rise in mobile biometrics for secure transactions. These trends reflect the evolving consumer preference for convenience and security in digital payments. However, challenges persist, particularly in developing economies where awareness for online payment is still lacking. To address this, market participants are investing in education and infrastructure development to expand the reach of digital payments and drive financial inclusion. As the market continues to evolve, the focus on innovation, security, and customer experience will remain key to success.
  • The PaaS market is poised for continued growth, offering opportunities for businesses to streamline their payment processes and enhance customer engagement.
  • What will be the Size of the Payment As A Service Market During the Forecast Period?

    Payment As A Service Market Size

     Request Free Sample

  • The Payment as a Service (PaaS) market in financial technology is experiencing significant growth due to the increasing demand for cloud-based financial services and transaction processing infrastructure. This market enables businesses to outsource payment processing functions to third-party providers, offering a cost-effective approach to traditional payment models. PaaS solutions provide authorization, settlement, and security features, allowing for seamless payment processing and enhanced security through advanced encryption, tokenization, and fraud detection. PaaS solutions offer a predictable cost structure, enabling better budgeting and financial planning for businesses. Additionally, these services provide scalability, enabling businesses to handle increased transaction volumes without the need for upfront investments in expensive payment processing infrastructure.
  • Advanced features such as real-time reporting, customizable payment workflows, and AI-driven fraud detection further enhance the value proposition of PaaS solutions. The market is expected to continue growing as businesses seek to improve transactional efficiency and mitigate risks associated with payment processing.
  • How is this Payment As A Service Industry segmented and which is the largest segment?

    The payment as a service industry research report provides comprehensive data (region-wise segment analysis), with forecasts and estimates in "USD million" for the period 2024-2028, as well as historical data from 2018-2022 for the following segments.

    • Application
      • Retail
      • Healthcare
      • Hospitality
      • Others
    • Geography
      • APAC
        • China
        • India
        • South Korea
      • Europe
        • UK
      • North America
        • US
      • South America
        • Middle East and Africa

        By Application Insights

        • The retail segment is estimated to witness significant growth during the forecast period.

        The Payment as a Service (PaaS) market is witnessing significant growth due to the increasing preference for cloud-based financial services and automated payment solutions among businesses. Traditional payment models are being replaced with cost-effective, predictable cost structure approaches that offer advanced features such as real-time reporting, customizable payment workflows, and enhanced security. These solutions provide seamless payment processing, enabling businesses to digitize and automate payments for various transactions, including business payments, online card payments, disbursements, and miscellaneous expenses. Third-party providers offer cloud solutions for payment processing infrastructure, authorization, and settlement, ensuring a secure environment for encrypted transactions. Advanced encryption, tokenization, fraud detection, and risk mitigation are essential components of these solutions.

        Moreover, the adoption of AI-driven fraud detection and cross-border payments is increasing In the financial ecosystem. The use of API-managed payment platforms for accounts payable and receivable management enhances productivity and efficiency in financial planning and budgeting. The scalability of these services enables businesses to handle global transactions with ease, making PaaS a productive and efficient solution for local businesses and enterprises alike.

        Payment As A Service Market Size

        Get a glance at the  Payment As A Service Industry report of share of various segments Request Free Sample

        The Retail segment was valued at USD 2.50 million in 2018 and showed a gradual increase during the forecast period.

        Regional Analysis

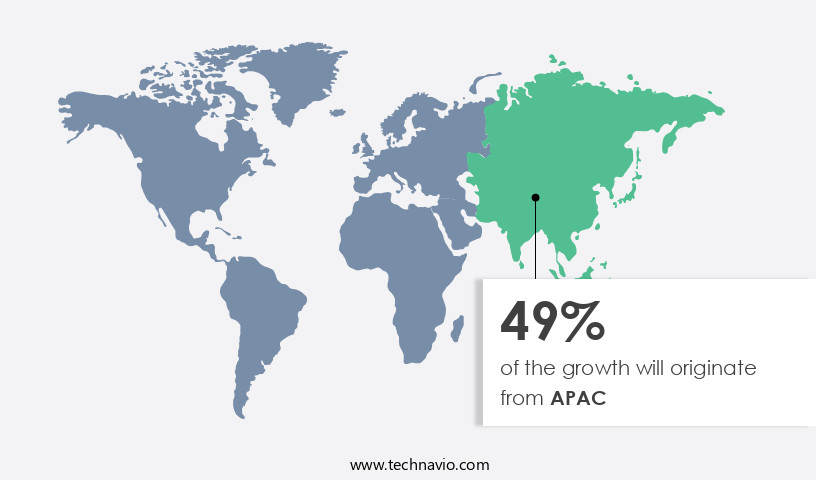
        • APAC is estimated to contribute 49% to the growth of the global market during the forecast period.

        Technavio’s analysts have elaborately explained the regional trends and drivers that shape the market during the forecast period.

        Payment As A Service Market Share by Geography

        For more insights on the market share of various regions, Request Free Sample

        Payment as a Service (PaaS) is a cloud-based financial solution that enables businesses to outsource payment processing infrastructure and authorization, settlement, and security functions from third-party providers. This cost-effective approach offers predictable cost structures, budgeting, and financial planning advantages, making it increasingly popular among various sectors, particularly e-commerce and BFSI. PaaS solutions provide real-time reporting, customizable payment workflows, and advanced features like AI-driven fraud detection, tokenization, and risk mitigation. They offer seamless payment processing across multiple platforms, including desktop apps, mobile apps, business payments, online card payments, disbursements, and miscellaneous expenses. The adoption of PaaS is on the rise due to its ability to digitize and automate payments, ensuring transparency in accounting, bills management, invoice management, and receipts management in a secure environment with encrypted transactions.

        Cross-border payments and transactions are also facilitated through these advanced financial ecosystems, enhancing global business operations.

        Market Dynamics

        Our  researchers analyzed the data with 2023 as the base year, along with the key drivers, trends, and challenges. A holistic analysis of drivers will help companies refine their marketing strategies to gain a competitive advantage.

        What are the key market drivers leading to the rise In the adoption of Payment As A Service Industry?

        High adoption of contactless payment solutions is the key driver of the market.

      • The Payment as a Service (PaaS) market In the financial technology sector is revolutionizing transaction processing through cloud-based financial services. This approach allows businesses, particularly local ones, to outsource payment processing infrastructure to third-party providers, enabling cost-effective and predictable cost structures for budgeting and financial planning. PaaS offers advanced security features, including authorization, settlement, encryption, tokenization, fraud detection, and risk mitigation, ensuring enhanced security for all parties involved. Moreover, PaaS provides scalability, enabling seamless payment processing for businesses of all sizes. Advanced features such as real-time reporting, customizable payment workflows, and customizable payment options offer increased transactional efficiency and transparency in accounting.
      • API-managed payment platforms facilitate automated payment services for accounts payable, business payments, online card payments, disbursements, and miscellaneous expenses. Payment practices have evolved, with cash transactions becoming less common and digital transactions becoming the norm. Cross-border payments and global transactions are now easier and more efficient through cloud solutions and online payment services. Desktop apps and mobile apps offer convenience and productivity for businesses and individuals alike. Security remains a top priority, with encrypted transactions and a secure environment ensuring peace of mind for users. In conclusion, the market offers numerous benefits for businesses and individuals, including advanced security features, scalability, transactional efficiency, and cost savings.
      • By outsourcing payment processing infrastructure, businesses can focus on their core competencies while enjoying the benefits of a modern financial ecosystem.
      • What are the market trends shaping the Payment As A Service Industry?

        Rise in mobile biometrics for payment is the upcoming market trend.

      • In today's digital economy, the use of cloud-based financial services, specifically payment processing infrastructure provided by third-party providers, has become increasingly popular among businesses seeking a cost-effective approach to transactions. This financial technology enables seamless payment processing, authorization, and settlement, ensuring predictable cost structures for budgeting and financial planning. The security of these cloud-based solutions is enhanced through advanced encryption, tokenization, fraud detection, and risk mitigation, providing a secure environment for financial transactions. Scalability is another significant advantage of payment-as-a-service, allowing businesses to process transactions efficiently and productively, regardless of their size or industry. This technology supports various payment options, including online card payments, disbursements, and miscellaneous expenses, making it suitable for local businesses and global transactions alike.
      • Moreover, payment service providers offer API-managed payment platforms, enabling customizable payment workflows and real-time reporting. Advanced features such as AI-driven fraud detection and cross-border payments further enhance the financial ecosystem, streamlining payment practices and digitizing cash transactions. Payment-as-a-service also supports various applications, including desktop apps, mobile apps, accounts payable, and business payments. The onboarding process is straightforward, ensuring a productive and efficient experience for businesses. Overall, payment-as-a-service offers a transparent and automated solution for managing payments, bills, invoices, and receipts, making it an essential tool for businesses seeking to optimize their financial operations.
      • What challenges does the Payment As A Service Industry face during its growth?

        Lack of awareness for online payment in developing economies is a key challenge affecting the industry growth.

      • The Payment as a Service (PaaS) market In the financial technology sector is experiencing significant growth due to the increasing preference for cloud-based financial services and automated payment solutions. Traditional payment models are being replaced by cost-effective approaches that offer authorization, settlement, and security benefits. Outsourcing payment processing infrastructure to third-party providers is becoming increasingly popular, allowing businesses to focus on their core competencies. PaaS offers enhanced security features such as advanced encryption, tokenization, and fraud detection, making it an attractive option for businesses seeking to digitize their payment processes. Real-time reporting and customizable payment workflows are also key advantages, enabling productive and efficient financial planning and budgeting.
      • Scalability is another significant benefit, allowing businesses to handle an increasing volume of transactions seamlessly. Cross-border payments and disbursements are also simplified, making global transactions more accessible. API-managed payment platforms enable integration with accounts payable, invoice management, and receipts management systems, providing transparency in accounting. Payment service providers offer automated payment services for local businesses, enabling them to accept online card payments, process miscellaneous expenses, and manage bills and invoices in a secure environment. The use of artificial intelligence (AI) and AI-driven fraud detection further enhances the security and efficiency of payment processing. Overall, the PaaS market offers a predictable cost structure, making it a valuable tool for businesses seeking to streamline their payment practices and optimize their financial ecosystem.
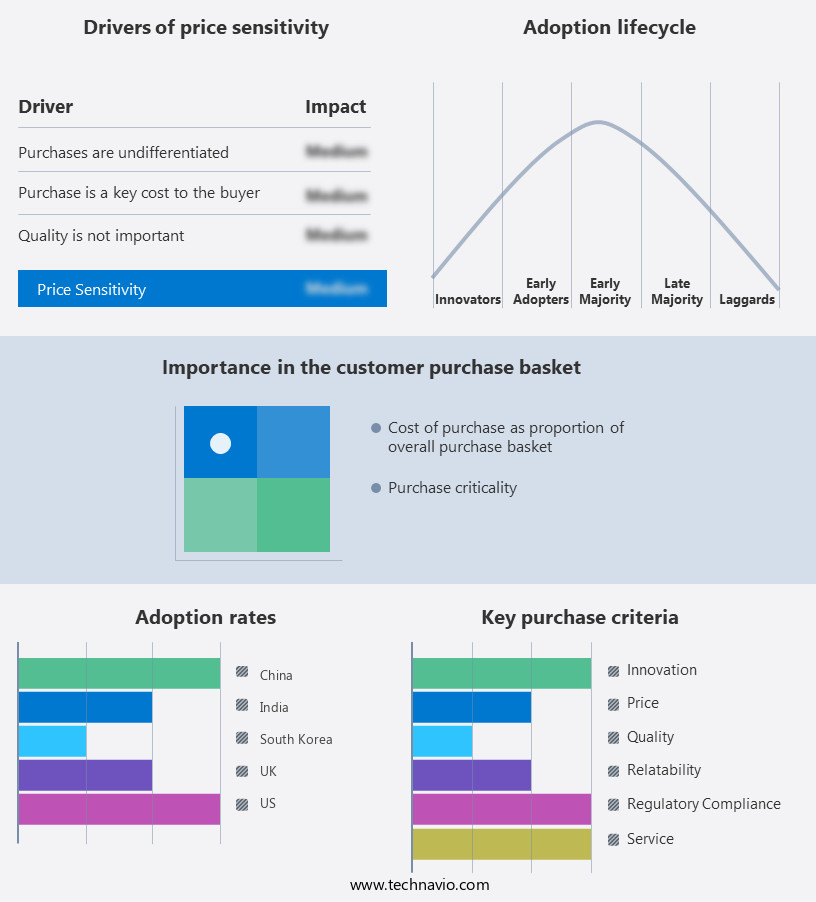
      • Exclusive Customer Landscape

        The payment as a service market forecasting report includes the adoption lifecycle of the market, covering from the innovator’s stage to the laggard’s stage. It focuses on adoption rates in different regions based on penetration. Furthermore, the payment as a service market report also includes key purchase criteria and drivers of price sensitivity to help companies evaluate and develop their market growth analysis strategies.

        Payment As A Service Market Share by Geography

         Customer Landscape

        Key Companies & Market Insights

        Companies are implementing various strategies, such as strategic alliances, payment as a service market forecast, partnerships, mergers and acquisitions, geographical expansion, and product/service launches, to enhance their presence In the industry.

        ABOUT-PAYMENTS.com B.V. - Agilysys provides Payment as a Service (PaaS) solutions for property management, point of sale, and numerous other applications. This innovative approach enables businesses to streamline their payment processing, enhancing operational efficiency and customer convenience. By outsourcing payment processing, companies can reduce costs, mitigate risks, and focus on their core competencies. PaaS solutions offer flexibility, scalability, and ease of integration, making them an attractive option for businesses seeking to modernize their payment processing systems.

        The industry research and growth report includes detailed analyses of the competitive landscape of the market and information about key companies, including:

        • ABOUT-PAYMENTS.com B.V.
        • Agilysys Inc.
        • Alphabet Inc.
        • Aurus Inc.
        • BlueSnap Inc.
        • Fidelity National Information Services Inc.
        • First American Payment Systems L.P.
        • First Data Corp.
        • Helcim Inc.
        • Ingenico Group SA
        • MTACC Ltd.
        • PayPal Holdings Inc.
        • Paysafe Ltd.
        • Paystand Inc.
        • PPRO Financial Ltd.
        • Stripe Inc.
        • Thales Group
        • Total System Services LLC
        • Valitor
        • VeriFone Inc.

        Qualitative and quantitative analysis of companies has been conducted to help clients understand the wider business environment as well as the strengths and weaknesses of key industry players. Data is qualitatively analyzed to categorize companies as pure play, category-focused, industry-focused, and diversified; it is quantitatively analyzed to categorize companies as dominant, leading, strong, tentative, and weak.

        Research Analyst Overview

        Payment as a Service (PaaS) is a cloud-based financial solution that enables businesses to outsource their payment processing infrastructure. This approach offers several advantages over traditional payment models. By utilizing a third-party provider, businesses can adopt a cost-effective approach to payment processing, transitioning from upfront investments to a predictable cost structure. This budgeting and financial planning tool allows businesses to focus on their core competencies while ensuring seamless payment processing. The PaaS market is witnessing significant growth due to its ability to provide enhanced security features. Advanced encryption, tokenization, and fraud detection systems are integral components of PaaS solutions.

        These features help mitigate risks and protect sensitive financial data, ensuring a secure environment for transactions. Moreover, PaaS solutions offer scalability, allowing businesses to accommodate increasing transaction volumes without the need for additional infrastructure. Real-time reporting and customizable payment workflows provide businesses with transparency in accounting and efficient management of bills, invoices, and receipts. The financial ecosystem is evolving, with businesses increasingly relying on digital transactions. PaaS solutions cater to this trend by offering API-managed payment platforms, enabling integration with various business applications. These platforms support online card payments, disbursements, miscellaneous expenses, and other business payments. PaaS solutions are not limited to large corporations.

        Local businesses and SMEs can also benefit from these cloud solutions, which offer desktop apps, mobile apps, and online payment services. This flexibility allows businesses to choose the most productive and efficient method for managing their payment processes. Cross-border payments are another area where PaaS solutions excel. These solutions offer advanced features, such as AI-driven fraud detection and real-time reporting, making international transactions more efficient and secure. In conclusion, Payment as a Service is a game-changer In the financial technology landscape. It offers businesses a cost-effective, scalable, and secure solution for managing their payment processing infrastructure. With advanced security features, real-time reporting, and customizable payment workflows, PaaS solutions are transforming the way businesses manage their financial practices, from cash transactions to global transactions.

        Market Scope

        Report Coverage

        Details

        Page number

        142

        Base year

        2023

        Historic period

        2018-2022

        Forecast period

        2024-2028

        Growth momentum & CAGR

        Accelerate at a CAGR of 17%

        Market growth 2024-2028

        USD 10.4 million

        Market structure

        Fragmented

        YoY growth 2023-2024(%)

        14.9

        Key countries

        India, China, US, UK, and South Korea

        Competitive landscape

        Leading Companies, Market Positioning of Companies, Competitive Strategies, and Industry Risks

        Request Free Sample

        What are the Key Data Covered in this Payment As A Service Market Research and Growth Report?

        • CAGR of the Payment As A Service industry during the forecast period
        • Detailed information on factors that will drive the growth and forecasting between 2024 and 2028
        • Precise estimation of the size of the market and its contribution of the industry in focus to the parent market
        • Accurate predictions about upcoming growth and trends and changes in consumer behaviour
        • Growth of the market across APAC, Europe, North America, South America, and Middle East and Africa
        • Thorough analysis of the market’s competitive landscape and detailed information about companies
        • Comprehensive analysis of factors that will challenge the payment as a service market growth of industry companies

        We can help! Our analysts can customize this payment as a service market research report to meet your requirements.

        Get in touch


        1 Executive Summary

        • 1.1 Market overview
          • Executive Summary - Chart on Market Overview
          • Executive Summary - Data Table on Market Overview
          • Executive Summary - Chart on Global Market Characteristics
          • Executive Summary - Chart on Market by Geography
          • Executive Summary - Chart on Market Segmentation by Application
          • Executive Summary - Chart on Incremental Growth
          • Executive Summary - Data Table on Incremental Growth
          • Executive Summary - Chart on Company Market Positioning

        2 Market Landscape

        • 2.1 Market ecosystem
          • Parent Market
          • Data Table on - Parent Market
        • 2.2 Market characteristics
          • Market characteristics analysis
        • 2.3 Value chain analysis
          • Value Chain Analysis

        3 Market Sizing

        • 3.1 Market definition
          • Offerings of companies included in the market definition
        • 3.2 Market segment analysis
          • Market segments
        • 3.3 Market size 2023
          • 3.4 Market outlook: Forecast for 2023-2028
            • Chart on Global - Market size and forecast 2023-2028 ($ million)
            • Data Table on Global - Market size and forecast 2023-2028 ($ million)
            • Chart on Global Market: Year-over-year growth 2023-2028 (%)
            • Data Table on Global Market: Year-over-year growth 2023-2028 (%)

          4 Historic Market Size

          • 4.1 Global Payment As A Service Market 2018 - 2022
            • Historic Market Size - Data Table on Global Payment As A Service Market 2018 - 2022 ($ million)
          • 4.2 Application segment analysis 2018 - 2022
            • Historic Market Size - Application Segment 2018 - 2022 ($ million)
          • 4.3 Geography segment analysis 2018 - 2022
            • Historic Market Size - Geography Segment 2018 - 2022 ($ million)
          • 4.4 Country segment analysis 2018 - 2022
            • Historic Market Size - Country Segment 2018 - 2022 ($ million)

          5 Five Forces Analysis

          • 5.1 Five forces summary
            • Five forces analysis - Comparison between 2023 and 2028
          • 5.2 Bargaining power of buyers
            • Bargaining power of buyers - Impact of key factors 2023 and 2028
          • 5.3 Bargaining power of suppliers
            • Bargaining power of suppliers - Impact of key factors in 2023 and 2028
          • 5.4 Threat of new entrants
            • Threat of new entrants - Impact of key factors in 2023 and 2028
          • 5.5 Threat of substitutes
            • Threat of substitutes - Impact of key factors in 2023 and 2028
          • 5.6 Threat of rivalry
            • Threat of rivalry - Impact of key factors in 2023 and 2028
          • 5.7 Market condition
            • Chart on Market condition - Five forces 2023 and 2028

          6 Market Segmentation by Application

          • 6.1 Market segments
            • Chart on Application - Market share 2023-2028 (%)
            • Data Table on Application - Market share 2023-2028 (%)
          • 6.2 Comparison by Application
            • Chart on Comparison by Application
            • Data Table on Comparison by Application
          • 6.3 Retail - Market size and forecast 2023-2028
            • Chart on Retail - Market size and forecast 2023-2028 ($ million)
            • Data Table on Retail - Market size and forecast 2023-2028 ($ million)
            • Chart on Retail - Year-over-year growth 2023-2028 (%)
            • Data Table on Retail - Year-over-year growth 2023-2028 (%)
          • 6.4 Healthcare - Market size and forecast 2023-2028
            • Chart on Healthcare - Market size and forecast 2023-2028 ($ million)
            • Data Table on Healthcare - Market size and forecast 2023-2028 ($ million)
            • Chart on Healthcare - Year-over-year growth 2023-2028 (%)
            • Data Table on Healthcare - Year-over-year growth 2023-2028 (%)
          • 6.5 Hospitality - Market size and forecast 2023-2028
            • Chart on Hospitality - Market size and forecast 2023-2028 ($ million)
            • Data Table on Hospitality - Market size and forecast 2023-2028 ($ million)
            • Chart on Hospitality - Year-over-year growth 2023-2028 (%)
            • Data Table on Hospitality - Year-over-year growth 2023-2028 (%)
          • 6.6 Others - Market size and forecast 2023-2028
            • Chart on Others - Market size and forecast 2023-2028 ($ million)
            • Data Table on Others - Market size and forecast 2023-2028 ($ million)
            • Chart on Others - Year-over-year growth 2023-2028 (%)
            • Data Table on Others - Year-over-year growth 2023-2028 (%)
          • 6.7 Market opportunity by Application
            • Market opportunity by Application ($ million)
            • Data Table on Market opportunity by Application ($ million)

          7 Customer Landscape

          • 7.1 Customer landscape overview
            • Analysis of price sensitivity, lifecycle, customer purchase basket, adoption rates, and purchase criteria

          8 Geographic Landscape

          • 8.1 Geographic segmentation
            • Chart on Market share by geography 2023-2028 (%)
            • Data Table on Market share by geography 2023-2028 (%)
          • 8.2 Geographic comparison
            • Chart on Geographic comparison
            • Data Table on Geographic comparison
          • 8.3 APAC - Market size and forecast 2023-2028
            • Chart on APAC - Market size and forecast 2023-2028 ($ million)
            • Data Table on APAC - Market size and forecast 2023-2028 ($ million)
            • Chart on APAC - Year-over-year growth 2023-2028 (%)
            • Data Table on APAC - Year-over-year growth 2023-2028 (%)
          • 8.4 Europe - Market size and forecast 2023-2028
            • Chart on Europe - Market size and forecast 2023-2028 ($ million)
            • Data Table on Europe - Market size and forecast 2023-2028 ($ million)
            • Chart on Europe - Year-over-year growth 2023-2028 (%)
            • Data Table on Europe - Year-over-year growth 2023-2028 (%)
          • 8.5 North America - Market size and forecast 2023-2028
            • Chart on North America - Market size and forecast 2023-2028 ($ million)
            • Data Table on North America - Market size and forecast 2023-2028 ($ million)
            • Chart on North America - Year-over-year growth 2023-2028 (%)
            • Data Table on North America - Year-over-year growth 2023-2028 (%)
          • 8.6 South America - Market size and forecast 2023-2028
            • Chart on South America - Market size and forecast 2023-2028 ($ million)
            • Data Table on South America - Market size and forecast 2023-2028 ($ million)
            • Chart on South America - Year-over-year growth 2023-2028 (%)
            • Data Table on South America - Year-over-year growth 2023-2028 (%)
          • 8.7 Middle East and Africa - Market size and forecast 2023-2028
            • Chart on Middle East and Africa - Market size and forecast 2023-2028 ($ million)
            • Data Table on Middle East and Africa - Market size and forecast 2023-2028 ($ million)
            • Chart on Middle East and Africa - Year-over-year growth 2023-2028 (%)
            • Data Table on Middle East and Africa - Year-over-year growth 2023-2028 (%)
          • 8.8 India - Market size and forecast 2023-2028
            • Chart on India - Market size and forecast 2023-2028 ($ million)
            • Data Table on India - Market size and forecast 2023-2028 ($ million)
            • Chart on India - Year-over-year growth 2023-2028 (%)
            • Data Table on India - Year-over-year growth 2023-2028 (%)
          • 8.9 China - Market size and forecast 2023-2028
            • Chart on China - Market size and forecast 2023-2028 ($ million)
            • Data Table on China - Market size and forecast 2023-2028 ($ million)
            • Chart on China - Year-over-year growth 2023-2028 (%)
            • Data Table on China - Year-over-year growth 2023-2028 (%)
          • 8.10 US - Market size and forecast 2023-2028
            • Chart on US - Market size and forecast 2023-2028 ($ million)
            • Data Table on US - Market size and forecast 2023-2028 ($ million)
            • Chart on US - Year-over-year growth 2023-2028 (%)
            • Data Table on US - Year-over-year growth 2023-2028 (%)
          • 8.11 UK - Market size and forecast 2023-2028
            • Chart on UK - Market size and forecast 2023-2028 ($ million)
            • Data Table on UK - Market size and forecast 2023-2028 ($ million)
            • Chart on UK - Year-over-year growth 2023-2028 (%)
            • Data Table on UK - Year-over-year growth 2023-2028 (%)
          • 8.12 South Korea - Market size and forecast 2023-2028
            • Chart on South Korea - Market size and forecast 2023-2028 ($ million)
            • Data Table on South Korea - Market size and forecast 2023-2028 ($ million)
            • Chart on South Korea - Year-over-year growth 2023-2028 (%)
            • Data Table on South Korea - Year-over-year growth 2023-2028 (%)
          • 8.13 Market opportunity by geography
            • Market opportunity by geography ($ million)
            • Data Tables on Market opportunity by geography ($ million)

          9 Drivers, Challenges, and Opportunity/Restraints

          • 9.1 Market drivers
            • 9.2 Market challenges
              • 9.3 Impact of drivers and challenges
                • Impact of drivers and challenges in 2023 and 2028
              • 9.4 Market opportunities/restraints

                10 Competitive Landscape

                • 10.1 Overview
                  • 10.2 Competitive Landscape
                    • Overview on criticality of inputs and factors of differentiation
                  • 10.3 Landscape disruption
                    • Overview on factors of disruption
                  • 10.4 Industry risks
                    • Impact of key risks on business

                  11 Competitive Analysis

                  • 11.1 Companies profiled
                    • Companies covered
                  • 11.2 Market positioning of companies
                    • Matrix on companies position and classification
                  • 11.3 Agilysys Inc.
                    • Agilysys Inc. - Overview
                    • Agilysys Inc. - Product / Service
                    • Agilysys Inc. - Key offerings
                  • 11.4 Aurus Inc.
                    • Aurus Inc. - Overview
                    • Aurus Inc. - Product / Service
                    • Aurus Inc. - Key offerings
                  • 11.5 Fidelity National Information Services Inc.
                    • Fidelity National Information Services Inc. - Overview
                    • Fidelity National Information Services Inc. - Business segments
                    • Fidelity National Information Services Inc. - Key news
                    • Fidelity National Information Services Inc. - Key offerings
                    • Fidelity National Information Services Inc. - Segment focus
                  • 11.6 First American Payment Systems L.P.
                    • First American Payment Systems L.P.  - Overview
                    • First American Payment Systems L.P.  - Product / Service
                    • First American Payment Systems L.P.  - Key offerings
                  • 11.7 First Data Corp.
                    • First Data Corp. - Overview
                    • First Data Corp. - Product / Service
                    • First Data Corp. - Key offerings
                  • 11.8 Helcim Inc.
                    • Helcim Inc. - Overview
                    • Helcim Inc. - Product / Service
                    • Helcim Inc. - Key offerings
                  • 11.9 Ingenico Group SA
                    • Ingenico Group SA - Overview
                    • Ingenico Group SA - Product / Service
                    • Ingenico Group SA - Key offerings
                  • 11.10 Paysafe Ltd.
                    • Paysafe Ltd. - Overview
                    • Paysafe Ltd. - Business segments
                    • Paysafe Ltd. - Key offerings
                    • Paysafe Ltd. - Segment focus
                  • 11.11 Total System Services LLC
                    • Total System Services LLC - Overview
                    • Total System Services LLC - Product / Service
                    • Total System Services LLC - Key offerings
                  • 11.12 VeriFone Inc.
                    • VeriFone Inc. - Overview
                    • VeriFone Inc. - Product / Service
                    • VeriFone Inc. - Key offerings

                  12 Appendix

                  • 12.1 Scope of the report
                    • 12.2 Inclusions and exclusions checklist
                      • Inclusions checklist
                      • Exclusions checklist
                    • 12.3 Currency conversion rates for US$
                      • Currency conversion rates for US$
                    • 12.4 Research methodology
                      • Research methodology
                    • 12.5 Data procurement
                      • Information sources
                    • 12.6 Data validation
                      • Data validation
                    • 12.7 Validation techniques employed for market sizing
                      • Validation techniques employed for market sizing
                    • 12.8 Data synthesis
                      • Data synthesis
                    • 12.9 360 degree market analysis
                      • 360 degree market analysis
                    • 12.10 List of abbreviations
                      • List of abbreviations

                    Research Methodology

                    Technavio presents a detailed picture of the market by way of study, synthesis, and summation of data from multiple sources. The analysts have presented the various facets of the market with a particular focus on identifying the key industry influencers. The data thus presented is comprehensive, reliable, and the result of extensive research, both primary and secondary.

                    INFORMATION SOURCES

                    Primary sources

                    • Manufacturers and suppliers
                    • Channel partners
                    • Industry experts
                    • Strategic decision makers

                    Secondary sources

                    • Industry journals and periodicals
                    • Government data
                    • Financial reports of key industry players
                    • Historical data
                    • Press releases

                    DATA ANALYSIS

                    Data Synthesis

                    • Collation of data
                    • Estimation of key figures
                    • Analysis of derived insights

                    Data Validation

                    • Triangulation with data models
                    • Reference against proprietary databases
                    • Corroboration with industry experts

                    REPORT WRITING

                    Qualitative

                    • Market drivers
                    • Market challenges
                    • Market trends
                    • Five forces analysis

                    Quantitative

                    • Market size and forecast
                    • Market segmentation
                    • Geographical insights
                    • Competitive landscape

                    Interested in this report?

                    Get your sample now to see our research methodology and insights!

                    Download Now

                    Frequently Asked Questions

                    Payment As A Service market growth will increase by $ 10.4 mn during 2024-2028 .

                    The Payment As A Service market is expected to grow at a CAGR of 17% during 2024-2028 .

                    Payment As A Service market is segmented by Application( Retail, Healthcare, Hospitality, Others)

                    ABOUT-PAYMENTS.com B.V., Agilysys Inc., Alphabet Inc., Aurus Inc., BlueSnap Inc., Fidelity National Information Services Inc., First American Payment Systems L.P., First Data Corp., Helcim Inc., Ingenico Group SA, MTACC Ltd., PayPal Holdings Inc., Paysafe Ltd., Paystand Inc., PPRO Financial Ltd., Stripe Inc., Thales Group, Total System Services LLC, Valitor, VeriFone Inc. are a few of the key vendors in the Payment As A Service market.

                    APAC will register the highest growth rate of 49% among the other regions. Therefore, the Payment As A Service market in APAC is expected to garner significant business opportunities for the vendors during the forecast period.

                    India, China, US, UK, South Korea

                    • High adoption of contactless payment solutionsThe introduction of mobile payment as a service is the driving factor this market.
                    • such as Apple Pay is the driving factor this market.
                    • Samsung Pay is the driving factor this market.
                    • and Android Pay is the driving factor this market.
                    • has simplified the process of paying bills. Customers are no longer required to carry credit or debit cards. In October 2018 is the driving factor this market.
                    • Square launched Terminal is the driving factor this market.
                    • a POS terminal is the driving factor this market.
                    • accepting mobile payments through Apple Pay is the driving factor this market.
                    • Google Pay is the driving factor this market.
                    • Samsung Pay is the driving factor this market.
                    • and NFC. The Terminal is a portable device that can accept and process payments over Wi-Fi and printout receipts. One of the main reasons big players are offering the NFC-based mobile payment option is the security feature is the driving factor this market.
                    • which prevents the consumer and retailer from accessing the card information or security code illegitimately. Users are initially required to save their financial data on their smartphones. They can conduct transactions by bringing the phone closer to the vendor's contactless payment-capable POS system. Once a connection has been established is the driving factor this market.
                    • users can approve the transaction by scanning their fingerprints or entering a password. The increased adoption of mobile devices and wearables has popularized the use of mobile payments. Many retailers are adopting platforms like NFC POS terminals that facilitate mobile payments. NFC POS terminals also boost the value and effectiveness of a retailer's marketing efforts. The process of streamlining operations helps retailers generate more revenue. Retailers worldwide realize the benefits of NFC POS terminals and are aligning them with their operations and processes to enhance the overall relationship between their respective brands and customers. The high adoption of contactless EMV cards will likely encourage the implementation of NFC POS terminals. The growing need for faster checkouts at retail outlets is the driving factor this market.
                    • high adoption of EMV cards is the driving factor this market.
                    • effective information management among retailers is the driving factor this market.
                    • and the increased focus on secure payments contribute to the growth of the global payment gateways market. The growing adoption of NFC-enabled mobile payment solutions is expected to drive the market during the forecast period. The availability of contactless payment POS terminals and payment options will also contribute to market growth. The evolution of technology and the availability of NFC-based devices have further expanded the consumer base for NFC transactions and payment gateways in retail or brick-and-mortar stores. is the driving factor this market.

                    The Payment As A Service market vendors should focus on grabbing business opportunities from the Retail segment as it accounted for the largest market share in the base year.