Payment Orchestration Platform Market Analysis, Size, and Forecast 2026-2030: North America (US, Canada, and Mexico), Europe (Germany, UK, and France), APAC (China, India, and Japan), Middle East and Africa (Saudi Arabia, UAE, and South Africa), South America (Brazil, Argentina, and Colombia), and Rest of World (ROW)

Payment Orchestration Platform Market Analysis, Size, and Forecast 2026-2030:
North America (US, Canada, and Mexico), Europe (Germany, UK, and France), APAC (China, India, and Japan), Middle East and Africa (Saudi Arabia, UAE, and South Africa), South America (Brazil, Argentina, and Colombia), and Rest of World (ROW)

Published: Dec 2025 312 Pages SKU: IRTNTR81221

Market Overview at a Glance

$4.27 B
Market Opportunity
24.5%
CAGR 2025 - 2030
35.2%
North America Growth
$703.5 Mn
Retail and e-commerce segment 2024

Payment Orchestration Platform Market Size 2026-2030

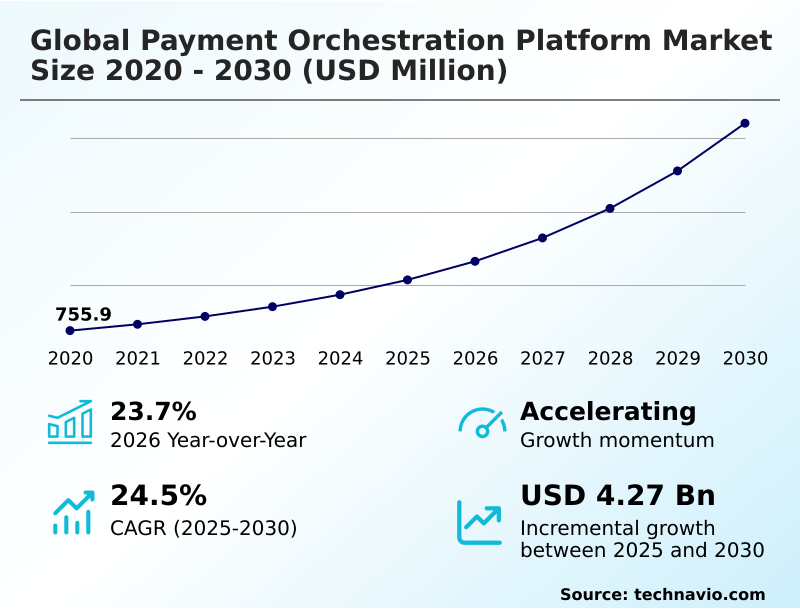
The payment orchestration platform market size is valued to increase by USD 4.27 billion, at a CAGR of 24.5% from 2025 to 2030. Demand for cross-border interoperability and unified global settlement will drive the payment orchestration platform market.

Major Market Trends & Insights

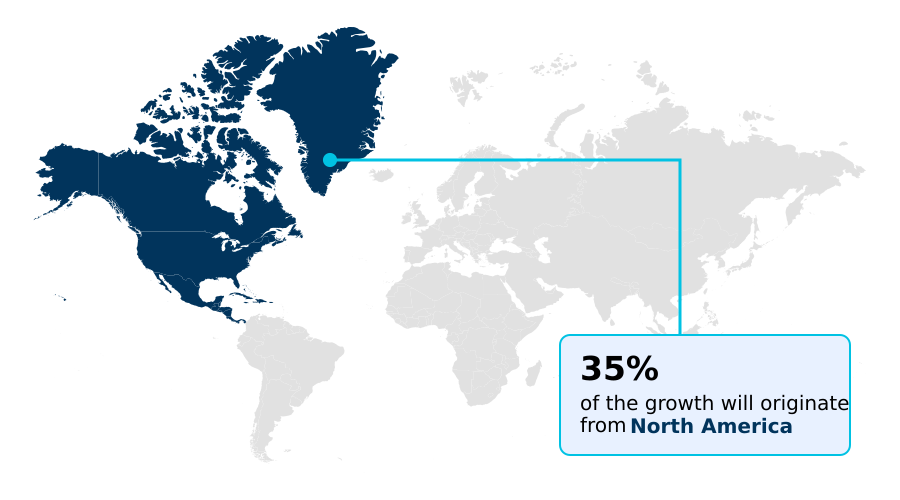
  • North America dominated the market and accounted for a 35.2% growth during the forecast period.
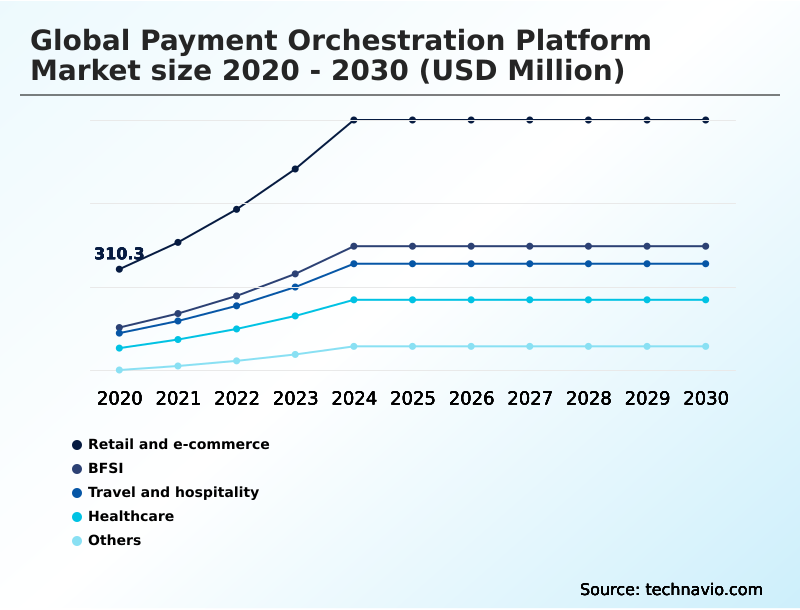
  • By End-user - Retail and e-commerce segment was valued at USD 703.5 million in 2024
  • By Deployment - Cloud based segment accounted for the largest market revenue share in 2024

Market Size & Forecast

  • Market Opportunities: USD 5.66 billion
  • Market Future Opportunities: USD 4.27 billion
  • CAGR from 2025 to 2030 : 24.5%

Market Summary

  • The payment orchestration platform market is defined by its role as a sophisticated middleware layer designed to simplify the complexities of modern digital commerce. For enterprises, the primary driver is the need to manage a fragmented global payment landscape, requiring cross-border interoperability to connect with numerous acquiring banks and local payment methods (LPMs) through a single API integration.
  • A significant trend is the evolution of these platforms from simple transaction routers to comprehensive hubs for transaction lifecycle management, incorporating advanced capabilities like chargeback automation and payout orchestration. For instance, a global subscription service utilizes an orchestration platform's smart retries and support for diverse payment flows to reduce involuntary churn, directly enhancing customer retention.
  • However, the market faces challenges from the erosion of vendor neutrality as major payment processors introduce their own orchestration services. This dynamic forces businesses to weigh the convenience of an integrated solution against the benefits of an agnostic platform that ensures operational resilience and optimizes cost structures across multiple providers.

What will be the Size of the Payment Orchestration Platform Market during the forecast period?

Get Key Insights on Market Forecast (PDF) Request Free Sample

How is the Payment Orchestration Platform Market Segmented?

The payment orchestration platform industry research report provides comprehensive data (region-wise segment analysis), with forecasts and estimates in "USD million" for the period 2026-2030, as well as historical data from 2020-2024 for the following segments.

  • End-user
    • Retail and e-commerce
    • BFSI
    • Travel and hospitality
    • Healthcare
    • Others
  • Deployment
    • Cloud based
    • On-Premises
  • Application
    • Cross border transactions
    • Risk management
    • Advanced analytics and reporting
    • Others
  • Geography
    • North America
      • US
      • Canada
      • Mexico
    • Europe
      • Germany
      • UK
      • France
    • APAC
      • China
      • India
      • Japan
    • Middle East and Africa
      • Saudi Arabia
      • UAE
      • South Africa
    • South America
      • Brazil
      • Argentina
      • Colombia
    • Rest of World (ROW)

By End-user Insights

The retail and e-commerce segment is estimated to witness significant growth during the forecast period.

The retail and e-commerce segment leads in adoption, driven by the critical need for revenue optimization and a seamless user experience.

Merchants leverage platforms to enhance the checkout experience, using intelligent routing and smart retries for authorization rate maximization, which can improve success rates by over 5%.

These systems provide essential multi-acquirer support, enabling businesses to navigate backend processing complexities and maintain transaction resiliency. By supporting diverse local payment methods (LPMs), orchestration of payment flows becomes a cornerstone for international expansion, directly impacting customer retention.

This strategic approach to payment processing is vital for managing global operations, reducing revenue leakage, and sustaining a competitive edge in a crowded digital marketplace, ensuring a positive return on investment.

Request Free Sample

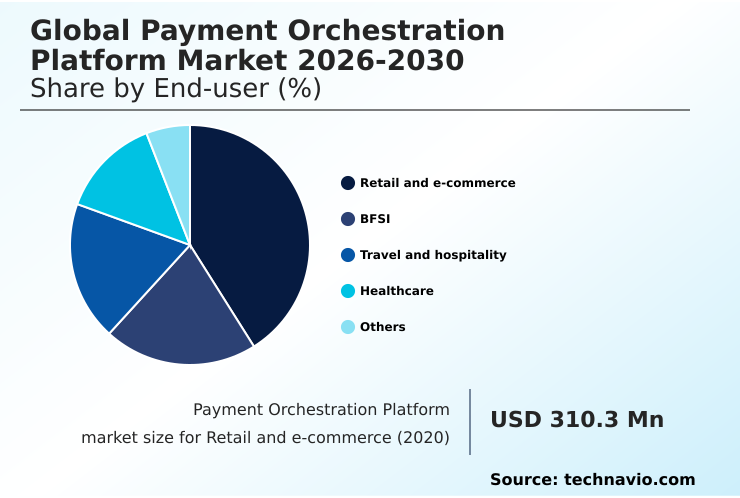
The Retail and e-commerce segment was valued at USD 703.5 million in 2024 and showed a gradual increase during the forecast period.

Request Free Sample

Regional Analysis

North America is estimated to contribute 35.2% to the growth of the global market during the forecast period.Technavio’s analysts have elaborately explained the regional trends and drivers that shape the market during the forecast period.

See How Payment Orchestration Platform Market Demand is Rising in North America Request Free Sample

The geographic landscape is characterized by distinct regional dynamics. In North America, mature markets focus on cost structure optimization and treasury and liquidity services, with multi-processor strategies boosting authorization rates by 3-5%.

In contrast, APAC is defined by its fragmented ecosystem, where local payment methods account for over 60% of digital transactions, making payout orchestration and dynamic currency conversion essential for managing payment flows.

Latin America is undergoing significant ecosystem consolidation, simplifying cross-border settlement for merchants entering the region. Meanwhile, the Middle East and Africa are leveraging omnichannel payments for high-growth sectors like travel and retail.

Across all regions, platforms enabling a unified commerce experience are gaining traction, addressing the universal need to reduce technical debt and streamline compliance management.

Market Dynamics

Our researchers analyzed the data with 2025 as the base year, along with the key drivers, trends, and challenges. A holistic analysis of drivers will help companies refine their marketing strategies to gain a competitive advantage.

  • Deciding between a traditional payment gateway vs orchestration platform is a critical inflection point for modern enterprises. While some consider the cost of building in-house orchestration, the complexity and ongoing maintenance favor specialized third-party solutions. The primary benefit lies in improving authorization rates with smart routing, which intelligently directs transactions to the best-fit processor in real-time.
  • This capability is crucial for reducing involuntary subscription churn in recurring revenue models. Furthermore, a key strategy involves the seamless integration of diverse payment options, such as integrating BNPL into checkout flows to meet consumer demand without adding technical debt.
  • Beyond initial acceptance, these platforms are instrumental in automating chargeback dispute resolution, a process that can reduce associated operational overhead by more than 60% compared to manual methods. For global businesses, a local payment method integration strategy is non-negotiable for market penetration. Advanced platforms also address the complexities of orchestrating cross-border marketplace payouts and managing foreign exchange in payment flows.
  • Foundational to this is ensuring PCI compliance with tokenization, which secures customer data while providing the flexibility needed for managing multi-processor payment routing. The move toward achieving ISO 20022 message compliance is also simplified, alongside centralizing multi-country payment reconciliation.

What are the key market drivers leading to the rise in the adoption of Payment Orchestration Platform Industry?

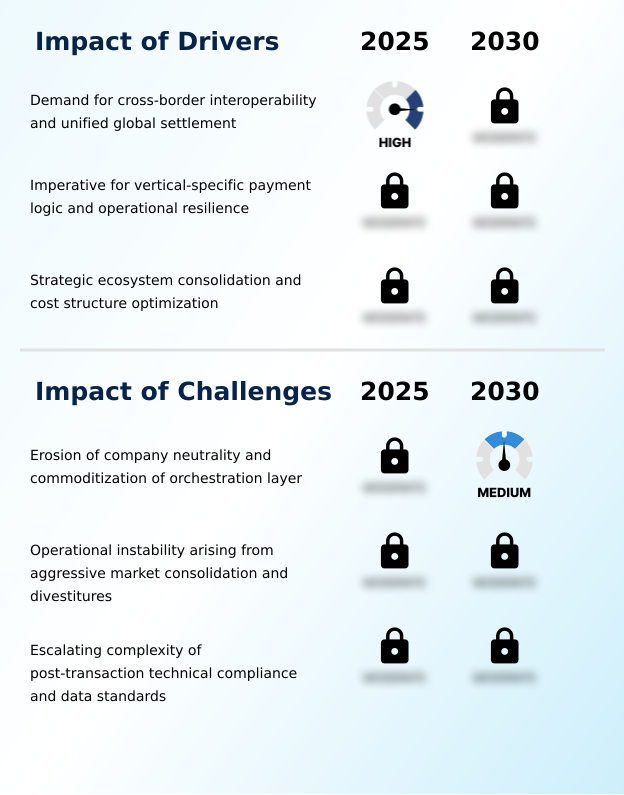
  • The primary market driver is the growing demand for cross-border interoperability, which enables unified global settlement and streamlined payment management across disparate regions.

  • The market is primarily driven by the enterprise need for cross-border interoperability and a unified approach to managing payment stack fragmentation. Businesses are adopting these platforms to reduce cross-border transaction fees by an average of 15% through intelligent routing.
  • The increasing demand for vertical-specific payment logic, particularly in travel, requires support for complex processes like split payments and the handling of Level 2 and Level 3 data, which specialized platforms deliver with over 99% settlement accuracy.
  • Furthermore, the relentless pursuit of cost structure optimization and operational resilience compels merchants to adopt a multi-processor strategy. This is facilitated by on-premises deployment or cloud-based SaaS architecture, allowing for dynamic management of acquiring banks and significant technical debt reduction.

What are the market trends shaping the Payment Orchestration Platform Industry?

  • A key market trend is the convergence of traditional payment processing and dedicated orchestration layers. This blurs the lines between financial settlement services and neutral routing technology.

  • Key trends are reshaping the market, led by the evolution toward comprehensive transaction lifecycle management. Platforms are integrating advanced AI and open banking connectivity to move beyond simple routing. AI-driven models now deliver a 3-5% uplift in authorization rates compared to static rules.
  • Another major shift is the focus on back-office automation, where automated data normalization and reconciliation capabilities can reduce manual workloads by over 40%. The convergence of payment gateway functions with agnostic middleware is creating hybrid systems that handle both routing and settlement.
  • This trend supports complex financial products like BNPL integration and simplifies the management of the entire payment stack, providing enterprises with a single source of truth for all transaction data.

What challenges does the Payment Orchestration Platform Industry face during its growth?

  • A key challenge affecting industry growth is the erosion of vendor neutrality, coupled with the increasing commoditization of the core orchestration layer by large ecosystem players.

  • The market faces significant challenges, including the erosion of vendor neutrality as major financial technology firms bundle their own orchestration features. This dynamic complicates the goal of achieving a truly agnostic middleware solution. The operational instability caused by constant industry consolidation is another major issue, with company divestitures impacting an estimated 20% of enterprise merchants' backend processing setups.
  • Furthermore, escalating technical complexity around post-transaction processes creates hurdles. The necessity for ISO 20022 compliance, advanced dispute management, and adherence to data sovereignty regulations can increase platform implementation timelines by up to 25%, demanding deeper expertise in financial messaging and compliance management from vendors.

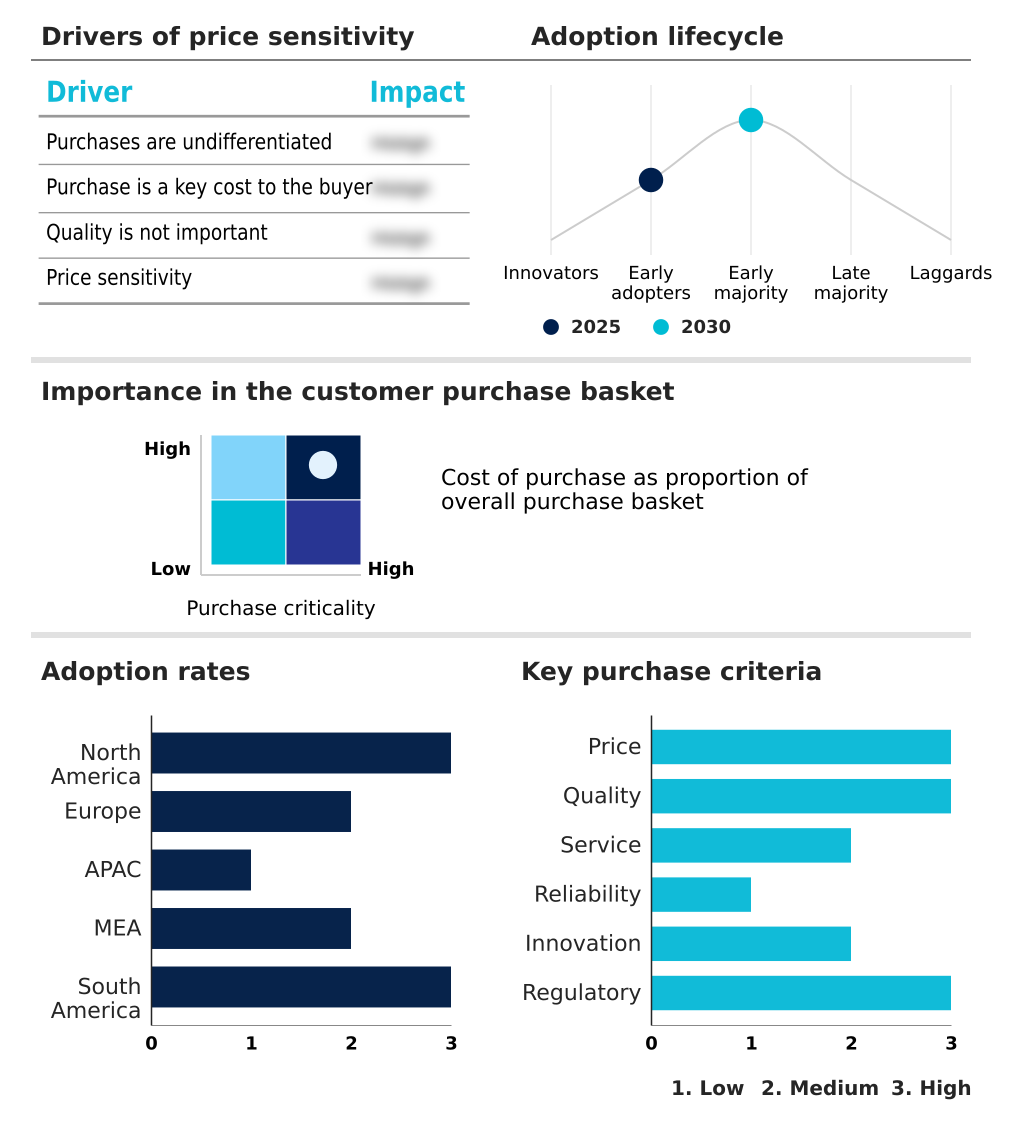
Exclusive Technavio Analysis on Customer Landscape

The payment orchestration platform market forecasting report includes the adoption lifecycle of the market, covering from the innovator’s stage to the laggard’s stage. It focuses on adoption rates in different regions based on penetration. Furthermore, the payment orchestration platform market report also includes key purchase criteria and drivers of price sensitivity to help companies evaluate and develop their market growth analysis strategies.

Customer Landscape of Payment Orchestration Platform Industry

Competitive Landscape

Companies are implementing various strategies, such as strategic alliances, payment orchestration platform market forecast, partnerships, mergers and acquisitions, geographical expansion, and product/service launches, to enhance their presence in the industry.

ACI Worldwide Inc. - Core offerings provide a unified middleware layer, enabling intelligent routing, multi-acquirer support, and centralized fraud management through a single API integration for global payment processing.

The industry research and growth report includes detailed analyses of the competitive landscape of the market and information about key companies, including:

  • ACI Worldwide Inc.
  • Adyen NV
  • APEXX Fintech Ltd.
  • BlueSnap Inc.
  • Bridger AI Ltd.
  • CellPoint Digital
  • Checkout Ltd.
  • Corefy
  • Gr4vy Inc.
  • IXOPAY GmbH
  • ModoPayments LLC
  • Payoneer Global Inc.
  • PayPal Holdings Inc.
  • PayU
  • Rapyd Financial Ltd.
  • Rebilly Inc.
  • Spreedly Inc.
  • Stripe Inc.
  • Worldline SA

Qualitative and quantitative analysis of companies has been conducted to help clients understand the wider business environment as well as the strengths and weaknesses of key industry players. Data is qualitatively analyzed to categorize companies as pure play, category-focused, industry-focused, and diversified; it is quantitatively analyzed to categorize companies as dominant, leading, strong, tentative, and weak.

Recent Development and News in Payment orchestration platform market

  • In March, 2025, Rapyd completed its acquisition of PayU's Global Payment Organisation (GPO) assets, significantly expanding its payment network and acquiring capabilities across Latin America and Africa.
  • In April, 2025, CellPoint Digital and Checkout.com entered a strategic partnership to provide a combined solution for travel merchants, integrating advanced routing technology with a high-performance global acquiring network.
  • In April, 2025, eBay announced a partnership with Checkout.com, leveraging the latter as a primary global payment partner to help optimize authorization rates and transaction performance for its marketplace.
  • In May, 2025, Stripe launched Stripe Orchestration, a new offering that allows enterprise users to route transactions to third-party payment processors directly from the Stripe platform, validating the multi-processor strategy.

Dive into Technavio’s robust research methodology, blending expert interviews, extensive data synthesis, and validated models for unparalleled Payment Orchestration Platform Market insights. See full methodology.

Market Scope
Page number 312
Base year 2025
Historic period 2020-2024
Forecast period 2026-2030
Growth momentum & CAGR Accelerate at a CAGR of 24.5%
Market growth 2026-2030 USD 4272.2 million
Market structure Fragmented
YoY growth 2025-2026(%) 23.7%
Key countries US, Canada, Mexico, Germany, UK, France, The Netherlands, Italy, Spain, China, India, Japan, South Korea, Australia, Indonesia, Saudi Arabia, UAE, South Africa, Israel, Turkey, Brazil, Argentina and Colombia
Competitive landscape Leading Companies, Market Positioning of Companies, Competitive Strategies, and Industry Risks

Request Free Sample

Research Analyst Overview

  • The payment orchestration platform market is centered on a sophisticated middleware layer, often built on a SaaS architecture, which provides a single API access point to a web of financial services. This API integration is fundamental to its value, enabling intelligent routing and multi-acquirer support for true unified commerce.
  • Core capabilities include robust fraud management, secure tokenization, and card vaulting to ensure transaction resiliency. Platforms manage complex payment processing for everything from split payments and BNPL integration to omnichannel payments, while also handling payout orchestration.
  • A key boardroom consideration is the technology's role in risk mitigation, particularly regarding ISO 20022 compliance and the handling of financial messaging, where platforms can reduce compliance-related errors by over 95%. Support for open banking connectivity and real-time payment rails is becoming standard.
  • These systems offer features like smart retries, chargeback automation, and revenue recovery tools, all contributing to a more efficient and secure payment ecosystem that supports cross-border interoperability and diverse local payment methods (LPMs).

What are the Key Data Covered in this Payment Orchestration Platform Market Research and Growth Report?

  • What is the expected growth of the Payment Orchestration Platform Market between 2026 and 2030?

    • USD 4.27 billion, at a CAGR of 24.5%

  • What segmentation does the market report cover?

    • The report is segmented by End-user (Retail and e-commerce, BFSI, Travel and hospitality, Healthcare, and Others), Deployment (Cloud based, and On-premises), Application (Cross border transactions, Risk management, Advanced analytics and reporting, and Others) and Geography (North America, Europe, APAC, Middle East and Africa, South America)

  • Which regions are analyzed in the report?

    • North America, Europe, APAC, Middle East and Africa and South America

  • What are the key growth drivers and market challenges?

    • Demand for cross-border interoperability and unified global settlement, Erosion of company neutrality and commoditization of orchestration layer

  • Who are the major players in the Payment Orchestration Platform Market?

    • ACI Worldwide Inc., Adyen NV, APEXX Fintech Ltd., BlueSnap Inc., Bridger AI Ltd., CellPoint Digital, Checkout Ltd., Corefy, Gr4vy Inc., IXOPAY GmbH, ModoPayments LLC, Payoneer Global Inc., PayPal Holdings Inc., PayU, Rapyd Financial Ltd., Rebilly Inc., Spreedly Inc., Stripe Inc. and Worldline SA

Market Research Insights

  • Market dynamics are shifting payments from a cost center to a strategic tool for revenue optimization and enhanced customer retention. Enterprises navigate payment stack fragmentation by adopting a multi-processor strategy, which improves operational resilience against provider outages.
  • This approach has been shown to boost authorization rate maximization by up to 5% while advanced back-office automation can reduce manual reconciliation costs by 40%. The emphasis is on achieving a seamless frontend customer experience decoupled from backend processing complexities. As ecosystem consolidation continues, maintaining vendor neutrality becomes critical for leveraging competitive transaction fees.
  • Businesses now use orchestration to manage complex payment flows, ensure data normalization for a single source of truth, and support specialized vertical-specific payment logic, turning their payment infrastructure into a competitive advantage.

We can help! Our analysts can customize this payment orchestration platform market research report to meet your requirements.

Get in touch

1. Executive Summary

1.1 Market overview

Executive Summary - Chart on Market Overview
Executive Summary - Data Table on Market Overview
Executive Summary - Chart on Global Market Characteristics
Executive Summary - Chart on Market by Geography
Executive Summary - Chart on Market Segmentation by End-user
Executive Summary - Chart on Market Segmentation by Deployment
Executive Summary - Chart on Market Segmentation by Application
Executive Summary - Chart on Incremental Growth
Executive Summary - Data Table on Incremental Growth
Executive Summary - Chart on Company Market Positioning

2. Technavio Analysis

2.1 Analysis of price sensitivity, lifecycle, customer purchase basket, adoption rates, and purchase criteria

2.2 Criticality of inputs and Factors of differentiation

Chart on Overview on criticality of inputs and factors of differentiation

2.3 Factors of disruption

Chart on Overview on factors of disruption

2.4 Impact of drivers and challenges

Chart on Impact of drivers and challenges in 2025 and 2030

3. Market Landscape

3.1 Market ecosystem

Chart on Parent Market
Data Table on - Parent Market

3.2 Market characteristics

Chart on Market characteristics analysis

3.3 Value chain analysis

Chart on Value chain analysis

4. Market Sizing

4.1 Market definition

Data Table on Offerings of companies included in the market definition

4.2 Market segment analysis

Market segments

4.3 Market size 2025

4.4 Market outlook: Forecast for 2025-2030

Chart on Global - Market size and forecast 2025-2030 ($ million)
Data Table on Global - Market size and forecast 2025-2030 ($ million)
Chart on Global Market: Year-over-year growth 2025-2030 (%)
Data Table on Global Market: Year-over-year growth 2025-2030 (%)

5. Historic Market Size

5.1 Global Payment Orchestration Platform Market 2020 - 2024

Historic Market Size - Data Table on Global Payment Orchestration Platform Market 2020 - 2024 ($ million)

5.2 End-user segment analysis 2020 - 2024

Historic Market Size - End-user Segment 2020 - 2024 ($ million)

5.3 Deployment segment analysis 2020 - 2024

Historic Market Size - Deployment Segment 2020 - 2024 ($ million)

5.4 Application segment analysis 2020 - 2024

Historic Market Size - Application Segment 2020 - 2024 ($ million)

5.5 Geography segment analysis 2020 - 2024

Historic Market Size - Geography Segment 2020 - 2024 ($ million)

5.6 Country segment analysis 2020 - 2024

Historic Market Size - Country Segment 2020 - 2024 ($ million)

6. Qualitative Analysis

6.1 The AI impact on global payment orchestration platform market

7. Five Forces Analysis

7.1 Five forces summary

Five forces analysis - Comparison between 2025 and 2030

7.2 Bargaining power of buyers

Bargaining power of buyers - Impact of key factors 2025 and 2030

7.3 Bargaining power of suppliers

Bargaining power of suppliers - Impact of key factors in 2025 and 2030

7.4 Threat of new entrants

Threat of new entrants - Impact of key factors in 2025 and 2030

7.5 Threat of substitutes

Threat of substitutes - Impact of key factors in 2025 and 2030

7.6 Threat of rivalry

Threat of rivalry - Impact of key factors in 2025 and 2030

7.7 Market condition

Chart on Market condition - Five forces 2025 and 2030

8. Market Segmentation by End-user

8.1 Market segments

Chart on End-user - Market share 2025-2030 (%)
Data Table on End-user - Market share 2025-2030 (%)

8.2 Comparison by End-user

Chart on Comparison by End-user
Data Table on Comparison by End-user

8.3 Retail and e-commerce - Market size and forecast 2025-2030

Chart on Retail and e-commerce - Market size and forecast 2025-2030 ($ million)
Data Table on Retail and e-commerce - Market size and forecast 2025-2030 ($ million)
Chart on Retail and e-commerce - Year-over-year growth 2025-2030 (%)
Data Table on Retail and e-commerce - Year-over-year growth 2025-2030 (%)

8.4 BFSI - Market size and forecast 2025-2030

Chart on BFSI - Market size and forecast 2025-2030 ($ million)
Data Table on BFSI - Market size and forecast 2025-2030 ($ million)
Chart on BFSI - Year-over-year growth 2025-2030 (%)
Data Table on BFSI - Year-over-year growth 2025-2030 (%)

8.5 Travel and hospitality - Market size and forecast 2025-2030

Chart on Travel and hospitality - Market size and forecast 2025-2030 ($ million)
Data Table on Travel and hospitality - Market size and forecast 2025-2030 ($ million)
Chart on Travel and hospitality - Year-over-year growth 2025-2030 (%)
Data Table on Travel and hospitality - Year-over-year growth 2025-2030 (%)

8.6 Healthcare - Market size and forecast 2025-2030

Chart on Healthcare - Market size and forecast 2025-2030 ($ million)
Data Table on Healthcare - Market size and forecast 2025-2030 ($ million)
Chart on Healthcare - Year-over-year growth 2025-2030 (%)
Data Table on Healthcare - Year-over-year growth 2025-2030 (%)

8.7 Others - Market size and forecast 2025-2030

Chart on Others - Market size and forecast 2025-2030 ($ million)
Data Table on Others - Market size and forecast 2025-2030 ($ million)
Chart on Others - Year-over-year growth 2025-2030 (%)
Data Table on Others - Year-over-year growth 2025-2030 (%)

8.8 Market opportunity by End-user

Market opportunity by End-user ($ million)
Data Table on Market opportunity by End-user ($ million)

9. Market Segmentation by Deployment

9.1 Market segments

Chart on Deployment - Market share 2025-2030 (%)
Data Table on Deployment - Market share 2025-2030 (%)

9.2 Comparison by Deployment

Chart on Comparison by Deployment
Data Table on Comparison by Deployment

9.3 Cloud based - Market size and forecast 2025-2030

Chart on Cloud based - Market size and forecast 2025-2030 ($ million)
Data Table on Cloud based - Market size and forecast 2025-2030 ($ million)
Chart on Cloud based - Year-over-year growth 2025-2030 (%)
Data Table on Cloud based - Year-over-year growth 2025-2030 (%)

9.4 On-Premises - Market size and forecast 2025-2030

Chart on On-Premises - Market size and forecast 2025-2030 ($ million)
Data Table on On-Premises - Market size and forecast 2025-2030 ($ million)
Chart on On-Premises - Year-over-year growth 2025-2030 (%)
Data Table on On-Premises - Year-over-year growth 2025-2030 (%)

9.5 Market opportunity by Deployment

Market opportunity by Deployment ($ million)
Data Table on Market opportunity by Deployment ($ million)

10. Market Segmentation by Application

10.1 Market segments

Chart on Application - Market share 2025-2030 (%)
Data Table on Application - Market share 2025-2030 (%)

10.2 Comparison by Application

Chart on Comparison by Application
Data Table on Comparison by Application

10.3 Cross border transactions - Market size and forecast 2025-2030

Chart on Cross border transactions - Market size and forecast 2025-2030 ($ million)
Data Table on Cross border transactions - Market size and forecast 2025-2030 ($ million)
Chart on Cross border transactions - Year-over-year growth 2025-2030 (%)
Data Table on Cross border transactions - Year-over-year growth 2025-2030 (%)

10.4 Risk management - Market size and forecast 2025-2030

Chart on Risk management - Market size and forecast 2025-2030 ($ million)
Data Table on Risk management - Market size and forecast 2025-2030 ($ million)
Chart on Risk management - Year-over-year growth 2025-2030 (%)
Data Table on Risk management - Year-over-year growth 2025-2030 (%)

10.5 Advanced analytics and reporting - Market size and forecast 2025-2030

Chart on Advanced analytics and reporting - Market size and forecast 2025-2030 ($ million)
Data Table on Advanced analytics and reporting - Market size and forecast 2025-2030 ($ million)
Chart on Advanced analytics and reporting - Year-over-year growth 2025-2030 (%)
Data Table on Advanced analytics and reporting - Year-over-year growth 2025-2030 (%)

10.6 Others - Market size and forecast 2025-2030

Chart on Others - Market size and forecast 2025-2030 ($ million)
Data Table on Others - Market size and forecast 2025-2030 ($ million)
Chart on Others - Year-over-year growth 2025-2030 (%)
Data Table on Others - Year-over-year growth 2025-2030 (%)

10.7 Market opportunity by Application

Market opportunity by Application ($ million)
Data Table on Market opportunity by Application ($ million)

11. Customer Landscape

11.1 Customer landscape overview

Analysis of price sensitivity, lifecycle, customer purchase basket, adoption rates, and purchase criteria

12. Geographic Landscape

12.1 Geographic segmentation

Chart on Market share by geography 2025-2030 (%)
Data Table on Market share by geography 2025-2030 (%)

12.2 Geographic comparison

Chart on Geographic comparison
Data Table on Geographic comparison

12.3 North America - Market size and forecast 2025-2030

Chart on North America - Market size and forecast 2025-2030 ($ million)
Data Table on North America - Market size and forecast 2025-2030 ($ million)
Chart on North America - Year-over-year growth 2025-2030 (%)
Data Table on North America - Year-over-year growth 2025-2030 (%)
Chart on Regional Comparison - North America
Data Table on Regional Comparison - North America

12.3.1 US - Market size and forecast 2025-2030

Chart on US - Market size and forecast 2025-2030 ($ million)
Data Table on US - Market size and forecast 2025-2030 ($ million)
Chart on US - Year-over-year growth 2025-2030 (%)
Data Table on US - Year-over-year growth 2025-2030 (%)

12.3.2 Canada - Market size and forecast 2025-2030

Chart on Canada - Market size and forecast 2025-2030 ($ million)
Data Table on Canada - Market size and forecast 2025-2030 ($ million)
Chart on Canada - Year-over-year growth 2025-2030 (%)
Data Table on Canada - Year-over-year growth 2025-2030 (%)

12.3.3 Mexico - Market size and forecast 2025-2030

Chart on Mexico - Market size and forecast 2025-2030 ($ million)
Data Table on Mexico - Market size and forecast 2025-2030 ($ million)
Chart on Mexico - Year-over-year growth 2025-2030 (%)
Data Table on Mexico - Year-over-year growth 2025-2030 (%)

12.4 Europe - Market size and forecast 2025-2030

Chart on Europe - Market size and forecast 2025-2030 ($ million)
Data Table on Europe - Market size and forecast 2025-2030 ($ million)
Chart on Europe - Year-over-year growth 2025-2030 (%)
Data Table on Europe - Year-over-year growth 2025-2030 (%)
Chart on Regional Comparison - Europe
Data Table on Regional Comparison - Europe

12.4.1 Germany - Market size and forecast 2025-2030

Chart on Germany - Market size and forecast 2025-2030 ($ million)
Data Table on Germany - Market size and forecast 2025-2030 ($ million)
Chart on Germany - Year-over-year growth 2025-2030 (%)
Data Table on Germany - Year-over-year growth 2025-2030 (%)

12.4.2 UK - Market size and forecast 2025-2030

Chart on UK - Market size and forecast 2025-2030 ($ million)
Data Table on UK - Market size and forecast 2025-2030 ($ million)
Chart on UK - Year-over-year growth 2025-2030 (%)
Data Table on UK - Year-over-year growth 2025-2030 (%)

12.4.3 France - Market size and forecast 2025-2030

Chart on France - Market size and forecast 2025-2030 ($ million)
Data Table on France - Market size and forecast 2025-2030 ($ million)
Chart on France - Year-over-year growth 2025-2030 (%)
Data Table on France - Year-over-year growth 2025-2030 (%)

12.4.4 The Netherlands - Market size and forecast 2025-2030

Chart on The Netherlands - Market size and forecast 2025-2030 ($ million)
Data Table on The Netherlands - Market size and forecast 2025-2030 ($ million)
Chart on The Netherlands - Year-over-year growth 2025-2030 (%)
Data Table on The Netherlands - Year-over-year growth 2025-2030 (%)

12.4.5 Italy - Market size and forecast 2025-2030

Chart on Italy - Market size and forecast 2025-2030 ($ million)
Data Table on Italy - Market size and forecast 2025-2030 ($ million)
Chart on Italy - Year-over-year growth 2025-2030 (%)
Data Table on Italy - Year-over-year growth 2025-2030 (%)

12.4.6 Spain - Market size and forecast 2025-2030

Chart on Spain - Market size and forecast 2025-2030 ($ million)
Data Table on Spain - Market size and forecast 2025-2030 ($ million)
Chart on Spain - Year-over-year growth 2025-2030 (%)
Data Table on Spain - Year-over-year growth 2025-2030 (%)

12.5 APAC - Market size and forecast 2025-2030

Chart on APAC - Market size and forecast 2025-2030 ($ million)
Data Table on APAC - Market size and forecast 2025-2030 ($ million)
Chart on APAC - Year-over-year growth 2025-2030 (%)
Data Table on APAC - Year-over-year growth 2025-2030 (%)
Chart on Regional Comparison - APAC
Data Table on Regional Comparison - APAC

12.5.1 China - Market size and forecast 2025-2030

Chart on China - Market size and forecast 2025-2030 ($ million)
Data Table on China - Market size and forecast 2025-2030 ($ million)
Chart on China - Year-over-year growth 2025-2030 (%)
Data Table on China - Year-over-year growth 2025-2030 (%)

12.5.2 India - Market size and forecast 2025-2030

Chart on India - Market size and forecast 2025-2030 ($ million)
Data Table on India - Market size and forecast 2025-2030 ($ million)
Chart on India - Year-over-year growth 2025-2030 (%)
Data Table on India - Year-over-year growth 2025-2030 (%)

12.5.3 Japan - Market size and forecast 2025-2030

Chart on Japan - Market size and forecast 2025-2030 ($ million)
Data Table on Japan - Market size and forecast 2025-2030 ($ million)
Chart on Japan - Year-over-year growth 2025-2030 (%)
Data Table on Japan - Year-over-year growth 2025-2030 (%)

12.5.4 South Korea - Market size and forecast 2025-2030

Chart on South Korea - Market size and forecast 2025-2030 ($ million)
Data Table on South Korea - Market size and forecast 2025-2030 ($ million)
Chart on South Korea - Year-over-year growth 2025-2030 (%)
Data Table on South Korea - Year-over-year growth 2025-2030 (%)

12.5.5 Australia - Market size and forecast 2025-2030

Chart on Australia - Market size and forecast 2025-2030 ($ million)
Data Table on Australia - Market size and forecast 2025-2030 ($ million)
Chart on Australia - Year-over-year growth 2025-2030 (%)
Data Table on Australia - Year-over-year growth 2025-2030 (%)

12.5.6 Indonesia - Market size and forecast 2025-2030

Chart on Indonesia - Market size and forecast 2025-2030 ($ million)
Data Table on Indonesia - Market size and forecast 2025-2030 ($ million)
Chart on Indonesia - Year-over-year growth 2025-2030 (%)
Data Table on Indonesia - Year-over-year growth 2025-2030 (%)

12.6 Middle East and Africa - Market size and forecast 2025-2030

Chart on Middle East and Africa - Market size and forecast 2025-2030 ($ million)
Data Table on Middle East and Africa - Market size and forecast 2025-2030 ($ million)
Chart on Middle East and Africa - Year-over-year growth 2025-2030 (%)
Data Table on Middle East and Africa - Year-over-year growth 2025-2030 (%)
Chart on Regional Comparison - Middle East and Africa
Data Table on Regional Comparison - Middle East and Africa

12.6.1 Saudi Arabia - Market size and forecast 2025-2030

Chart on Saudi Arabia - Market size and forecast 2025-2030 ($ million)
Data Table on Saudi Arabia - Market size and forecast 2025-2030 ($ million)
Chart on Saudi Arabia - Year-over-year growth 2025-2030 (%)
Data Table on Saudi Arabia - Year-over-year growth 2025-2030 (%)

12.6.2 UAE - Market size and forecast 2025-2030

Chart on UAE - Market size and forecast 2025-2030 ($ million)
Data Table on UAE - Market size and forecast 2025-2030 ($ million)
Chart on UAE - Year-over-year growth 2025-2030 (%)
Data Table on UAE - Year-over-year growth 2025-2030 (%)

12.6.3 South Africa - Market size and forecast 2025-2030

Chart on South Africa - Market size and forecast 2025-2030 ($ million)
Data Table on South Africa - Market size and forecast 2025-2030 ($ million)
Chart on South Africa - Year-over-year growth 2025-2030 (%)
Data Table on South Africa - Year-over-year growth 2025-2030 (%)

12.6.4 Israel - Market size and forecast 2025-2030

Chart on Israel - Market size and forecast 2025-2030 ($ million)
Data Table on Israel - Market size and forecast 2025-2030 ($ million)
Chart on Israel - Year-over-year growth 2025-2030 (%)
Data Table on Israel - Year-over-year growth 2025-2030 (%)

12.6.5 Turkey - Market size and forecast 2025-2030

Chart on Turkey - Market size and forecast 2025-2030 ($ million)
Data Table on Turkey - Market size and forecast 2025-2030 ($ million)
Chart on Turkey - Year-over-year growth 2025-2030 (%)
Data Table on Turkey - Year-over-year growth 2025-2030 (%)

12.7 South America - Market size and forecast 2025-2030

Chart on South America - Market size and forecast 2025-2030 ($ million)
Data Table on South America - Market size and forecast 2025-2030 ($ million)
Chart on South America - Year-over-year growth 2025-2030 (%)
Data Table on South America - Year-over-year growth 2025-2030 (%)
Chart on Regional Comparison - South America
Data Table on Regional Comparison - South America

12.7.1 Brazil - Market size and forecast 2025-2030

Chart on Brazil - Market size and forecast 2025-2030 ($ million)
Data Table on Brazil - Market size and forecast 2025-2030 ($ million)
Chart on Brazil - Year-over-year growth 2025-2030 (%)
Data Table on Brazil - Year-over-year growth 2025-2030 (%)

12.7.2 Argentina - Market size and forecast 2025-2030

Chart on Argentina - Market size and forecast 2025-2030 ($ million)
Data Table on Argentina - Market size and forecast 2025-2030 ($ million)
Chart on Argentina - Year-over-year growth 2025-2030 (%)
Data Table on Argentina - Year-over-year growth 2025-2030 (%)

12.7.3 Colombia - Market size and forecast 2025-2030

Chart on Colombia - Market size and forecast 2025-2030 ($ million)
Data Table on Colombia - Market size and forecast 2025-2030 ($ million)
Chart on Colombia - Year-over-year growth 2025-2030 (%)
Data Table on Colombia - Year-over-year growth 2025-2030 (%)

12.8 Market opportunity by geography

Market opportunity by geography ($ million)
Data Tables on Market opportunity by geography ($ million)

13. Drivers, Challenges, and Opportunity

13.1 Market drivers

Demand for cross-border interoperability and unified global settlement
Imperative for vertical-specific payment logic and operational resilience
Strategic ecosystem consolidation and cost structure optimization

13.2 Market challenges

Erosion of company neutrality and commoditization of orchestration layer
Operational instability arising from aggressive market consolidation and divestitures
Escalating complexity of post-transaction technical compliance and data standards

13.3 Impact of drivers and challenges

Impact of drivers and challenges in 2025 and 2030

13.4 Market opportunities

Convergence of payment processing and orchestration layers
Evolution from transaction routing to lifecycle revenue management
Integration of artificial intelligence and open banking standards

14. Competitive Landscape

14.1 Overview

14.2

Overview on criticality of inputs and factors of differentiation

14.3 Landscape disruption

Overview on factors of disruption

14.4 Industry risks

Impact of key risks on business

15. Competitive Analysis

15.1 Companies profiled

Companies covered

15.2 Company ranking index

15.3 Market positioning of companies

Matrix on companies position and classification

15.4 ACI Worldwide Inc.

ACI Worldwide Inc. - Overview
ACI Worldwide Inc. - Business segments
ACI Worldwide Inc. - Key news
ACI Worldwide Inc. - Key offerings
ACI Worldwide Inc. - Segment focus
SWOT

15.5 Adyen NV

Adyen NV - Overview
Adyen NV - Product / Service
Adyen NV - Key offerings
SWOT

15.6 APEXX Fintech Ltd.

APEXX Fintech Ltd. - Overview
APEXX Fintech Ltd. - Product / Service
APEXX Fintech Ltd. - Key offerings
SWOT

15.7 BlueSnap Inc.

BlueSnap Inc. - Overview
BlueSnap Inc. - Product / Service
BlueSnap Inc. - Key offerings
SWOT

15.8 CellPoint Digital

CellPoint Digital - Overview
CellPoint Digital - Product / Service
CellPoint Digital - Key offerings
SWOT

15.9 Checkout Ltd.

Checkout Ltd. - Overview
Checkout Ltd. - Product / Service
Checkout Ltd. - Key offerings
SWOT

15.10 Gr4vy Inc.

Gr4vy Inc. - Overview
Gr4vy Inc. - Product / Service
Gr4vy Inc. - Key offerings
SWOT

15.11 IXOPAY GmbH

IXOPAY GmbH - Overview
IXOPAY GmbH - Product / Service
IXOPAY GmbH - Key offerings
SWOT

15.12 Payoneer Global Inc.

Payoneer Global Inc. - Overview
Payoneer Global Inc. - Product / Service
Payoneer Global Inc. - Key offerings
SWOT

15.13 PayPal Holdings Inc.

PayPal Holdings Inc. - Overview
PayPal Holdings Inc. - Product / Service
PayPal Holdings Inc. - Key news
PayPal Holdings Inc. - Key offerings
SWOT

15.14 Rapyd Financial Ltd.

Rapyd Financial Ltd. - Overview
Rapyd Financial Ltd. - Product / Service
Rapyd Financial Ltd. - Key offerings
SWOT

15.15 Rebilly Inc.

Rebilly Inc. - Overview
Rebilly Inc. - Product / Service
Rebilly Inc. - Key offerings
SWOT

15.16 Spreedly Inc.

Spreedly Inc. - Overview
Spreedly Inc. - Product / Service
Spreedly Inc. - Key offerings
SWOT

15.17 Stripe Inc.

Stripe Inc. - Overview
Stripe Inc. - Product / Service
Stripe Inc. - Key offerings
SWOT

15.18 Worldline SA

Worldline SA - Overview
Worldline SA - Business segments
Worldline SA - Key offerings
Worldline SA - Segment focus
SWOT

16. Appendix

16.1 Scope of the report

Market definition
Objectives
Notes and caveats

16.2 Inclusions and exclusions checklist

Inclusions checklist
Exclusions checklist

16.3 Currency conversion rates for US$

16.4 Research methodology

16.5 Data procurement

Information sources

16.6 Data validation

16.7 Validation techniques employed for market sizing

16.8 Data synthesis

16.9 360 degree market analysis

16.10 List of abbreviations

Research Methodology

Technavio presents a detailed picture of the market by way of study, synthesis, and summation of data from multiple sources. The analysts have presented the various facets of the market with a particular focus on identifying the key industry influencers. The data thus presented is comprehensive, reliable, and the result of extensive research, both primary and secondary.

INFORMATION SOURCES

Primary sources

  • Manufacturers and suppliers
  • Channel partners
  • Industry experts
  • Strategic decision makers

Secondary sources

  • Industry journals and periodicals
  • Government data
  • Financial reports of key industry players
  • Historical data
  • Press releases

DATA ANALYSIS

Data Synthesis

  • Collation of data
  • Estimation of key figures
  • Analysis of derived insights

Data Validation

  • Triangulation with data models
  • Reference against proprietary databases
  • Corroboration with industry experts

REPORT WRITING

Qualitative

  • Market drivers
  • Market challenges
  • Market trends
  • Five forces analysis

Quantitative

  • Market size and forecast
  • Market segmentation
  • Geographical insights
  • Competitive landscape

Interested in this report?

Get your sample now to see our research methodology and insights!

Download Now

Frequently Asked Questions

Payment Orchestration Platform market growth will increase by USD 4272.2 million during 2026-2030 .

The Payment Orchestration Platform market is expected to grow at a CAGR of 24.5% during 2026-2030 .

Payment Orchestration Platform market is segmented by End-user (Retail and e-commerce, BFSI, Travel and hospitality, Healthcare, Others) Deployment (Cloud based, On-Premises) Application (Cross border transactions, Risk management, Advanced analytics and reporting, Others)

ACI Worldwide Inc., Adyen NV, APEXX Fintech Ltd., BlueSnap Inc., Bridger AI Ltd., CellPoint Digital, Checkout Ltd., Corefy, Gr4vy Inc., IXOPAY GmbH, ModoPayments LLC, Payoneer Global Inc., PayPal Holdings Inc., PayU, Rapyd Financial Ltd., Rebilly Inc., Spreedly Inc., Stripe Inc., Worldline SA are a few of the key vendors in the Payment Orchestration Platform market.

North America will register the highest growth rate of 35.2% among the other regions. Therefore, the Payment Orchestration Platform market in North America is expected to garner significant business opportunities for the vendors during the forecast period.

US, Canada, Mexico, Germany, UK, France, The Netherlands, Italy, Spain, China, India, Japan, South Korea, Australia, Indonesia, Saudi Arabia, UAE, South Africa, Israel, Turkey, Brazil, Argentina, Colombia

  • Demand for cross-border interoperability and unified global settlement is the driving factor this market.

The Payment Orchestration Platform market vendors should focus on grabbing business opportunities from the End-user segment as it accounted for the largest market share in the base year.