PC Peripherals Market Analysis North America, APAC, Europe, South America, Middle East and Africa - US, China, Canada, UK, Japan, India, Germany, Italy, Brazil, UAE - Size and Forecast 2025-2029

PC Peripherals Market Analysis North America, APAC, Europe, South America, Middle East and Africa - US, China, Canada, UK, Japan, India, Germany, Italy, Brazil, UAE - Size and Forecast 2025-2029

Published: Jan 2025 204 Pages SKU: IRTNTR43036

Market Overview at a Glance

$70.8 B
Market Opportunity
8.5%
CAGR
7.7
YoY growth 2024-2025(%)

PC Peripherals Market Size 2025-2029

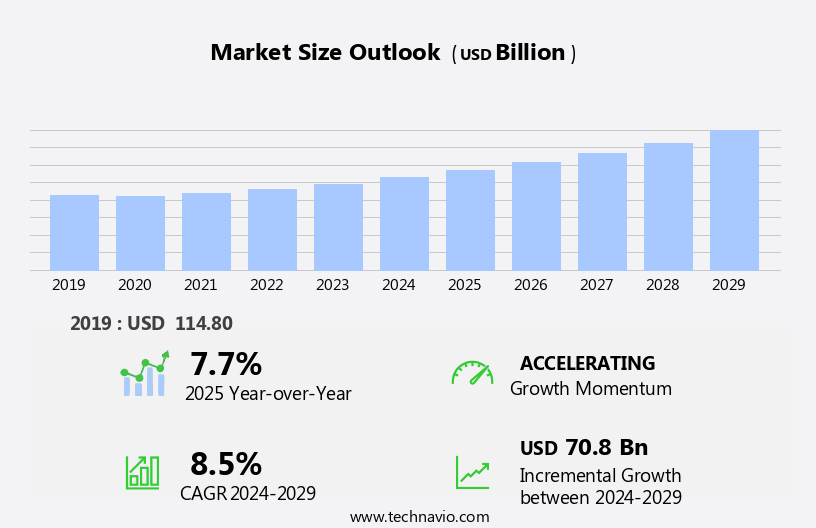
The pc peripherals market size is forecast to increase by USD 70.8 billion at a CAGR of 8.5% between 2024 and 2029.

  • The market is experiencing significant growth, driven by the increasing popularity of gaming and esports. This trend is fueled by the rising number of avid gamers and the continuous advancements in technology, leading to more and interactive gaming experiences. Furthermore, strategic partnerships and acquisitions among market players are on the rise, as companies seek to expand their product offerings and enhance their competitive positions. However, the market is not without challenges. The proliferation of counterfeit products poses a significant threat, as these low-quality imitations not only undermine brand reputation but also compromise user safety. To capitalize on market opportunities and navigate challenges effectively, companies must focus on innovation, quality, and brand protection.
  • By offering high-performance, reliable, and secure peripherals, they can differentiate themselves from the competition and build trust with their customers. Additionally, collaborating with industry leaders and investing in research and development can help companies stay ahead of the curve and meet the evolving demands of the market.

What will be the Size of the PC Peripherals Market during the forecast period?

PC Peripherals Market Size

 Request Free Sample

  • The market in the US is a dynamic and expansive industry, encompassing a wide range of devices that enhance and expand the functionality of computers. Key market drivers include the increasing demand for compatibility with various system requirements and output devices, such as DVI and HDMI displays, as well as the growing preference for wireless connections via Bluetooth, Wi-Fi, and USB. Notable peripheral categories include networking devices like modems and routers, wired and wireless input devices such as keyboards and mice, output devices like printers and speakers, and storage devices like external hard drives and flash drives.
  • Additionally, accessories like scanners, microphones, and webcams continue to gain popularity. Market growth is fueled by the ongoing digitization of industries and the increasing use of technology in everyday life. The market size is substantial, with continuous innovation and advancements in technology driving growth and direction. Overall, the market is a vibrant and ever-evolving sector, providing essential tools for enhancing productivity and connectivity in the digital age.

How is this PC Peripherals Industry segmented?

The pc peripherals industry research report provides comprehensive data (region-wise segment analysis), with forecasts and estimates in "USD billion" for the period 2025-2029, as well as historical data from 2019-2023 for the following segments.
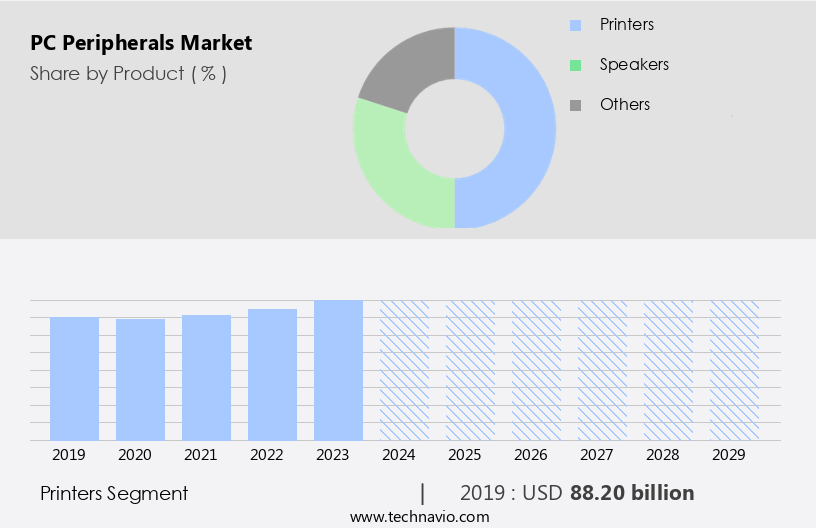
  • Product
    • Printers
    • Speakers
    • Others
  • End-user
    • Business
    • Consumers
  • Geography
    • North America
      • US
      • Canada
    • APAC
      • China
      • India
      • Japan
    • Europe
      • Germany
      • Italy
      • UK
    • South America
      • Brazil
    • Middle East and Africa
      • UAE

By Product Insights

The printers segment is estimated to witness significant growth during the forecast period.

The printer segment in the market experiences growth driven by the advertising and education sectors, which require large quantities of physical media for posters, books, and banners. However, the segment's expansion is sluggish due to the transition to e-learning and online advertising. The advantages of digital advertising, such as quick and extensive reach, cost savings, and time efficiency, are compelling alternatives. A significant trend in the printer market is the increasing adoption of 3D printers, which offer more intricate designs, faster production, and lower manufacturing costs compared to traditional printing. Despite these benefits, traditional printing maintains its relevance due to its ability to produce high-quality, tactile outputs that can evoke a stronger emotional response.

Control registers, data acquisition systems, and data acquisition software play essential roles in the functionality of data acquisition hardware, enabling seamless communication between the host computer and external devices. These components are crucial for productivity in industries such as electrophysiology and signal processing. USB, PCI, and ISA interface units facilitate the connection of various peripherals, including keyboards, mice, scanners, microphones, speakers, and external hard drives. Networking devices, such as modems, routers, and serial ports, enable wireless connections and expand the capabilities of the host computer. Performance is enhanced through D/A processing, sampling clock, and sampling rates, ensuring data throughput and compatibility with various software and operating systems.

Event-driven operating systems and specialized peripherals, including infrared, Wi-Fi, and Bluetooth devices, offer additional functionality and flexibility for users. Regular driver updates, system requirements, and software compatibility are essential for maintaining optimal performance and troubleshooting any issues.

PC Peripherals Market Size

Get a glance at the market report of share of various segments Request Free Sample

The Printers segment was valued at USD 88.20 billion in 2019 and showed a gradual increase during the forecast period.

Regional Analysis

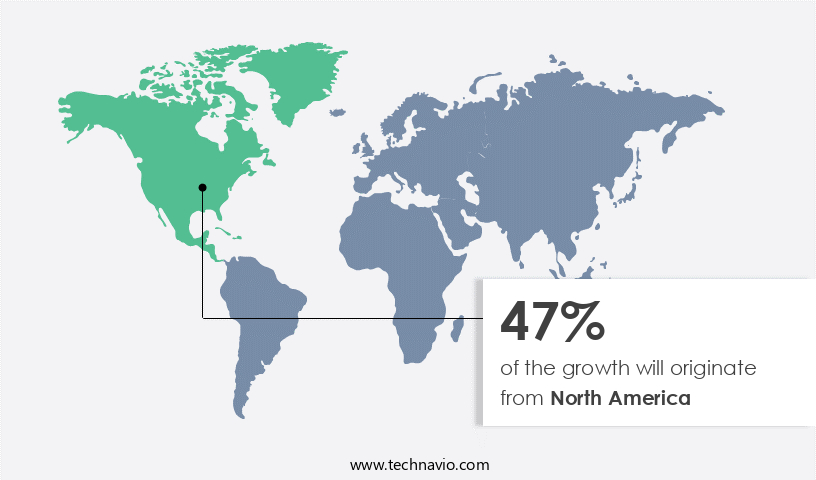
North America is estimated to contribute 47% to the growth of the global market during the forecast period.Technavio’s analysts have elaborately explained the regional trends and drivers that shape the market during the forecast period.

PC Peripherals Market Share by Geography

For more insights on the market size of various regions, Request Free Sample

The market in North America is experiencing significant growth due to the increasing adoption of technology and the expanding use of PCs in various industries. Major factors driving this market include the presence of leading companies such as Apple, Google, and Amazon, who have captured a substantial share through extensive marketing efforts. Additionally, the increasing Internet penetration and data traffic have fueled demand for PCs and peripherals from enterprises and industries like manufacturing, hospitality, IT, and more. PC peripherals offer a high-performance pathway for enhancing productivity through devices such as monitors with interfaces like DVI and HDMI, data acquisition systems with control registers, scanners, and wireless peripherals.

Output devices like printers and speakers, as well as storage devices such as external hard drives and flash drives, are essential for data processing and management. Input devices like keyboards, mice, and microphones, along with specialized peripherals like programmable amplifiers and data acquisition hardware, enable event-driven operating systems to interact with the host computer and process analog signals using A/D and D/A processing. Networking devices like modems, routers, and Ethernet interfaces facilitate wireless connections and software compatibility, while interface units like PCI, USB, ISA, and serial ports ensure seamless data throughput. The market's growth is further supported by the availability of software compatibility and software support libraries, device drivers, and troubleshooting and maintenance resources.

Key peripherals include scanners, data acquisition systems, and networking devices, which offer compatibility with various operating systems and event-driven operating systems. The market's growth is expected to continue as technology advances and businesses increasingly rely on PC peripherals for data acquisition, signal processing, and productivity enhancement.

Market Dynamics

Our researchers analyzed the data with 2024 as the base year, along with the key drivers, trends, and challenges. A holistic analysis of drivers will help companies refine their marketing strategies to gain a competitive advantage.

What are the key market drivers leading to the rise in the adoption of PC Peripherals Industry?

  • Growing popularity of gaming and esports is the key driver of the market. 

  • The market has experienced notable growth due to the increasing popularity of gaming and esports. Gamers and professionals in this field require high-performance peripherals, such as keyboards, mice, and headsets, which offer fast response times, precision, and customization options. These specialized devices cater to the unique needs of gaming and esports, enabling users to enhance their experience and gain a competitive edge.
  • The rise of competitive gaming and esports tournaments has further fueled the demand for advanced peripherals. As a result, manufacturers are continually innovating to meet the evolving requirements of this market.

What are the market trends shaping the PC Peripherals Industry?

  • Rising strategic partnerships and acquisitions is the upcoming market trend. 

  • The market is experiencing growth due to an increasing number of strategic partnerships and acquisitions among companies. These alliances aim to enhance their competitive edge by jointly developing initiatives, investing capital according to market trends, and integrating advanced technologies into their products. As a result, the production of PC peripherals with improved efficiency and compatibility with advanced technologies and components is expected. This trend is anticipated to positively impact the market during the forecast period. companies are focusing on expanding their businesses by collaborating with other market players to cater to the growing demand for PC peripherals that can be integrated into various computing devices, including smartphones and PCs.
  • The market growth can be attributed to the strategic benefits derived from these partnerships and acquisitions, which include the sharing of resources, knowledge, and expertise to create innovative and technologically advanced solutions.

What challenges does the PC Peripherals Industry face during its growth?

  • Growing counterfeit products is a key challenge affecting the industry growth. 

  • The market faces a significant challenge from the prevalence of counterfeit products. These imitations are readily available at local offline stores and online marketplaces, attracting price-conscious consumers. The growing popularity of counterfeit smart and portable Bluetooth speakers is intensifying price competition in the market. Moreover, counterfeit accessories are widely available on various online retail platforms. Despite efforts by market companies to restrict sales, the ease of access to these products through diverse distribution channels, including physical and digital retailers in numerous countries, poses a formidable challenge to controlling counterfeit sales.

Exclusive Customer Landscape

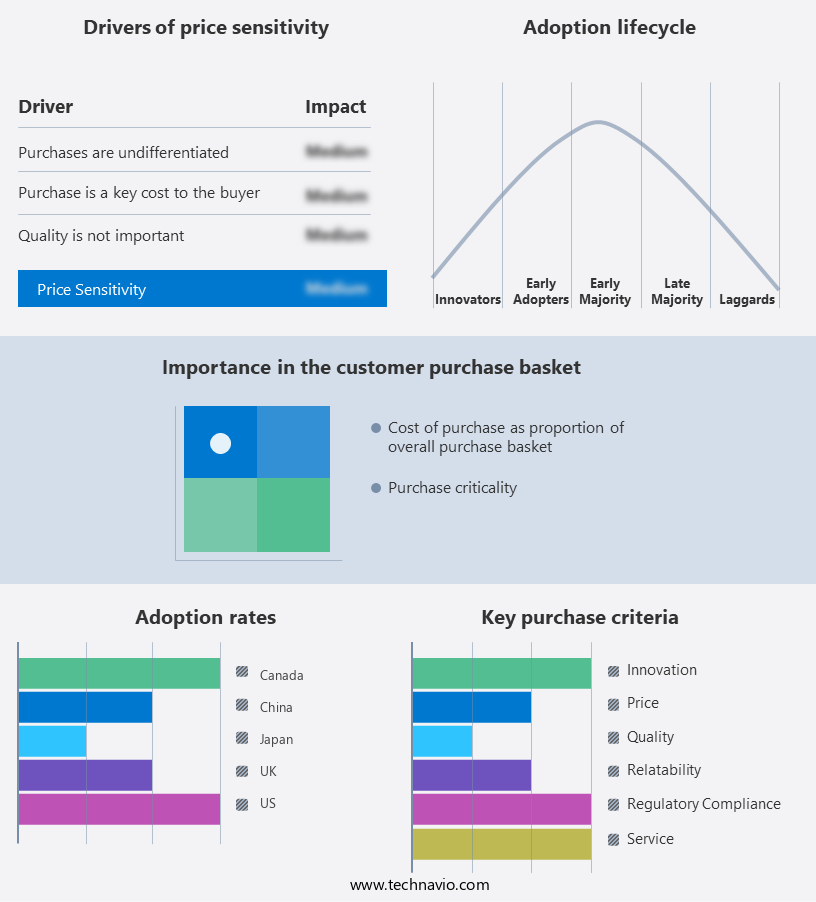
The pc peripherals market forecasting report includes the adoption lifecycle of the market, covering from the innovator’s stage to the laggard’s stage. It focuses on adoption rates in different regions based on penetration. Furthermore, the pc peripherals market report also includes key purchase criteria and drivers of price sensitivity to help companies evaluate and develop their market growth analysis strategies.

PC Peripherals Market Share by Geography

 Customer Landscape

Key Companies & Market Insights

Companies are implementing various strategies, such as strategic alliances, pc peripherals market forecast, partnerships, mergers and acquisitions, geographical expansion, and product/service launches, to enhance their presence in the industry.

Acer Inc. - This company specializes in providing a range of PC peripherals, including Connect devices, mice, and Acer vero sleeves. Our offerings enhance user experience by enabling seamless connectivity and protection for computing devices. These peripherals cater to various needs, ensuring compatibility and functionality across diverse systems. With a focus on innovation and quality, our products elevate productivity and convenience for professionals and enthusiasts alike.

The industry research and growth report includes detailed analyses of the competitive landscape of the market and information about key companies, including:

  • Acer Inc.
  • Brother Industries Ltd.
  • Canon Inc.
  • Dell Technologies Inc.
  • FURUKAWA Co. Ltd.
  • HP Inc.
  • Intel Corp.
  • International Business Machines Corp.
  • Lexmark International Inc.
  • Logitech International SA
  • Microsoft Corp.
  • Panasonic Holdings Corp.
  • Ricoh Co. Ltd.
  • Samsung Electronics Co. Ltd.
  • Seagate Technology LLC
  • Seiko Epson Corp.
  • Sony Group Corp.
  • Toshiba Corp.
  • Western Digital Corp.
  • Xerox Holdings Corp.

Qualitative and quantitative analysis of companies has been conducted to help clients understand the wider business environment as well as the strengths and weaknesses of key industry players. Data is qualitatively analyzed to categorize companies as pure play, category-focused, industry-focused, and diversified; it is quantitatively analyzed to categorize companies as dominant, leading, strong, tentative, and weak.

Research Analyst Overview

The high-performance pathway of the peripheral market continues to evolve, driven by advancements in technology and the increasing demand for enhanced productivity. One significant aspect of this evolution is the ongoing development of various interfaces, such as DVI and HDMI, which facilitate seamless communication between peripherals and host computers. Control registers play a crucial role in the functionality of data acquisition systems, enabling the configuration and monitoring of various parameters. These systems are essential in various industries, including scientific research, where precise data acquisition is necessary. Customer support is another essential factor in the peripheral market, ensuring that users can effectively utilize their devices and troubleshoot any potential issues.

Display technology is another area of focus, with the increasing popularity of high-definition displays and the emergence of virtual reality and augmented reality applications. Scanners, both wired and wireless, are also in high demand, providing users with the ability to digitize physical documents and data. Networking devices, such as modems and routers, have become essential peripherals in today's connected world. Data translation and signal processing are critical functions that enable seamless communication between different devices and systems. Microphones and speakers are also popular peripherals, enhancing the user experience in various applications, including multimedia and communication. Data acquisition hardware, including data acquisition software and specialized peripherals, are essential in industries where real-time data processing is necessary.

Event-driven operating systems and device drivers play a crucial role in enabling efficient communication between the host computer and external devices. Input devices, such as keyboards and mice, remain a staple in the peripheral market, with a focus on ergonomics and productivity. Output devices, including printers and speakers, provide users with the ability to produce physical outputs and enhance the overall user experience. Peripheral interface ports, including PCI, USB, ISA, and PCIe, enable the connection of external devices to the host computer. Wired and wireless connections, including Ethernet, Wi-Fi, Bluetooth, and infrared, offer users flexibility and convenience.

Maintenance and troubleshooting are essential aspects of the peripheral market, with many manufacturers providing software support libraries and driver updates to ensure compatibility and optimal performance. Compatibility with various operating systems and software applications is also a critical factor in the success of peripherals in the market. In the realm of specialized peripherals, there is a growing demand for devices that cater to specific industries and applications, such as electrophysiology equipment and programmable amplifiers. These devices offer users advanced functionality and enhanced performance, making them indispensable in their respective fields. Overall, the peripheral market is a dynamic and evolving landscape, driven by technological advancements and the increasing demand for enhanced productivity and connectivity.

The focus on user experience, compatibility, and performance will continue to shape the market in the coming years.

Market Scope

Report Coverage

Details

Page number

204

Base year

2024

Historic period

2019-2023

Forecast period

2025-2029

Growth momentum & CAGR

Accelerate at a CAGR of 8.5%

Market growth 2025-2029

USD 70.8 billion

Market structure

Fragmented

YoY growth 2024-2025(%)

7.7

Key countries

US, China, Canada, UK, Japan, India, Germany, Italy, Brazil, and UAE

Competitive landscape

Leading Companies, Market Positioning of Companies, Competitive Strategies, and Industry Risks

Request Free Sample

What are the Key Data Covered in this PC Peripherals Market Research and Growth Report?

  • CAGR of the PC Peripherals industry during the forecast period
  • Detailed information on factors that will drive the growth and forecasting between 2025 and 2029
  • Precise estimation of the size of the market and its contribution of the industry in focus to the parent market
  • Accurate predictions about upcoming growth and trends and changes in consumer behaviour
  • Growth of the market across North America, APAC, Europe, South America, and Middle East and Africa
  • Thorough analysis of the market’s competitive landscape and detailed information about companies
  • Comprehensive analysis of factors that will challenge the pc peripherals market growth of industry companies

We can help! Our analysts can customize this pc peripherals market research report to meet your requirements.

Get in touch


1 Executive Summary

  • 1.1 Market overview
    • Executive Summary - Chart on Market Overview
    • Executive Summary - Data Table on Market Overview
    • Executive Summary - Chart on Global Market Characteristics
    • Executive Summary - Chart on Market by Geography
    • Executive Summary - Chart on Market Segmentation by Product
    • Executive Summary - Chart on Market Segmentation by End-user
    • Executive Summary - Chart on Incremental Growth
    • Executive Summary - Data Table on Incremental Growth
    • Executive Summary - Chart on Company Market Positioning

2 Technavio Analysis

  • 2.1 Analysis of price sensitivity, lifecycle, customer purchase basket, adoption rates, and purchase criteria
    • Analysis of price sensitivity, lifecycle, customer purchase basket, adoption rates, and purchase criteria
  • 2.2 Criticality of inputs and Factors of differentiation
    • Overview on criticality of inputs and factors of differentiation
  • 2.3 Factors of disruption
    • Overview on factors of disruption
  • 2.4 Impact of drivers and challenges
    • Impact of drivers and challenges in 2024 and 2029

3 Market Landscape

  • 3.1 Market ecosystem
    • Parent Market
    • Data Table on - Parent Market
  • 3.2 Market characteristics
    • Market characteristics analysis
  • 3.3 Value chain analysis
    • Value chain analysis

4 Market Sizing

  • 4.1 Market definition
    • Offerings of companies included in the market definition
  • 4.2 Market segment analysis
    • Market segments
  • 4.3 Market size 2024
    • 4.4 Market outlook: Forecast for 2024-2029
      • Chart on Global - Market size and forecast 2024-2029 ($ billion)
      • Data Table on Global - Market size and forecast 2024-2029 ($ billion)
      • Chart on Global Market: Year-over-year growth 2024-2029 (%)
      • Data Table on Global Market: Year-over-year growth 2024-2029 (%)

    5 Historic Market Size

    • 5.1 Global PC Peripherals Market 2019 - 2023
      • Historic Market Size - Data Table on Global PC Peripherals Market 2019 - 2023 ($ billion)
    • 5.2 Product segment analysis 2019 - 2023
      • Historic Market Size - Product Segment 2019 - 2023 ($ billion)
    • 5.3 End-user segment analysis 2019 - 2023
      • Historic Market Size - End-user Segment 2019 - 2023 ($ billion)
    • 5.4 Geography segment analysis 2019 - 2023
      • Historic Market Size - Geography Segment 2019 - 2023 ($ billion)
    • 5.5 Country segment analysis 2019 - 2023
      • Historic Market Size - Country Segment 2019 - 2023 ($ billion)

    6 Qualitative Analysis

    • 6.1 Impact of AI in Global PC Peripherals Market

      7 Five Forces Analysis

      • 7.1 Five forces summary
        • Five forces analysis - Comparison between 2024 and 2029
      • 7.2 Bargaining power of buyers
        • Bargaining power of buyers - Impact of key factors 2024 and 2029
      • 7.3 Bargaining power of suppliers
        • Bargaining power of suppliers - Impact of key factors in 2024 and 2029
      • 7.4 Threat of new entrants
        • Threat of new entrants - Impact of key factors in 2024 and 2029
      • 7.5 Threat of substitutes
        • Threat of substitutes - Impact of key factors in 2024 and 2029
      • 7.6 Threat of rivalry
        • Threat of rivalry - Impact of key factors in 2024 and 2029
      • 7.7 Market condition
        • Chart on Market condition - Five forces 2024 and 2029

      8 Market Segmentation by Product

      • 8.1 Market segments
        • Chart on Product - Market share 2024-2029 (%)
        • Data Table on Product - Market share 2024-2029 (%)
      • 8.2 Comparison by Product
        • Chart on Comparison by Product
        • Data Table on Comparison by Product
      • 8.3 Printers - Market size and forecast 2024-2029
        • Chart on Printers - Market size and forecast 2024-2029 ($ billion)
        • Data Table on Printers - Market size and forecast 2024-2029 ($ billion)
        • Chart on Printers - Year-over-year growth 2024-2029 (%)
        • Data Table on Printers - Year-over-year growth 2024-2029 (%)
      • 8.4 Speakers - Market size and forecast 2024-2029
        • Chart on Speakers - Market size and forecast 2024-2029 ($ billion)
        • Data Table on Speakers - Market size and forecast 2024-2029 ($ billion)
        • Chart on Speakers - Year-over-year growth 2024-2029 (%)
        • Data Table on Speakers - Year-over-year growth 2024-2029 (%)
      • 8.5 Others - Market size and forecast 2024-2029
        • Chart on Others - Market size and forecast 2024-2029 ($ billion)
        • Data Table on Others - Market size and forecast 2024-2029 ($ billion)
        • Chart on Others - Year-over-year growth 2024-2029 (%)
        • Data Table on Others - Year-over-year growth 2024-2029 (%)
      • 8.6 Market opportunity by Product
        • Market opportunity by Product ($ billion)
        • Data Table on Market opportunity by Product ($ billion)

      9 Market Segmentation by End-user

      • 9.1 Market segments
        • Chart on End-user - Market share 2024-2029 (%)
        • Data Table on End-user - Market share 2024-2029 (%)
      • 9.2 Comparison by End-user
        • Chart on Comparison by End-user
        • Data Table on Comparison by End-user
      • 9.3 Business - Market size and forecast 2024-2029
        • Chart on Business - Market size and forecast 2024-2029 ($ billion)
        • Data Table on Business - Market size and forecast 2024-2029 ($ billion)
        • Chart on Business - Year-over-year growth 2024-2029 (%)
        • Data Table on Business - Year-over-year growth 2024-2029 (%)
      • 9.4 Consumers - Market size and forecast 2024-2029
        • Chart on Consumers - Market size and forecast 2024-2029 ($ billion)
        • Data Table on Consumers - Market size and forecast 2024-2029 ($ billion)
        • Chart on Consumers - Year-over-year growth 2024-2029 (%)
        • Data Table on Consumers - Year-over-year growth 2024-2029 (%)
      • 9.5 Market opportunity by End-user
        • Market opportunity by End-user ($ billion)
        • Data Table on Market opportunity by End-user ($ billion)

      10 Customer Landscape

      • 10.1 Customer landscape overview
        • Analysis of price sensitivity, lifecycle, customer purchase basket, adoption rates, and purchase criteria

      11 Geographic Landscape

      • 11.1 Geographic segmentation
        • Chart on Market share by geography 2024-2029 (%)
        • Data Table on Market share by geography 2024-2029 (%)
      • 11.2 Geographic comparison
        • Chart on Geographic comparison
        • Data Table on Geographic comparison
      • 11.3 North America - Market size and forecast 2024-2029
        • Chart on North America - Market size and forecast 2024-2029 ($ billion)
        • Data Table on North America - Market size and forecast 2024-2029 ($ billion)
        • Chart on North America - Year-over-year growth 2024-2029 (%)
        • Data Table on North America - Year-over-year growth 2024-2029 (%)
      • 11.4 APAC - Market size and forecast 2024-2029
        • Chart on APAC - Market size and forecast 2024-2029 ($ billion)
        • Data Table on APAC - Market size and forecast 2024-2029 ($ billion)
        • Chart on APAC - Year-over-year growth 2024-2029 (%)
        • Data Table on APAC - Year-over-year growth 2024-2029 (%)
      • 11.5 Europe - Market size and forecast 2024-2029
        • Chart on Europe - Market size and forecast 2024-2029 ($ billion)
        • Data Table on Europe - Market size and forecast 2024-2029 ($ billion)
        • Chart on Europe - Year-over-year growth 2024-2029 (%)
        • Data Table on Europe - Year-over-year growth 2024-2029 (%)
      • 11.6 South America - Market size and forecast 2024-2029
        • Chart on South America - Market size and forecast 2024-2029 ($ billion)
        • Data Table on South America - Market size and forecast 2024-2029 ($ billion)
        • Chart on South America - Year-over-year growth 2024-2029 (%)
        • Data Table on South America - Year-over-year growth 2024-2029 (%)
      • 11.7 Middle East and Africa - Market size and forecast 2024-2029
        • Chart on Middle East and Africa - Market size and forecast 2024-2029 ($ billion)
        • Data Table on Middle East and Africa - Market size and forecast 2024-2029 ($ billion)
        • Chart on Middle East and Africa - Year-over-year growth 2024-2029 (%)
        • Data Table on Middle East and Africa - Year-over-year growth 2024-2029 (%)
      • 11.8 US - Market size and forecast 2024-2029
        • Chart on US - Market size and forecast 2024-2029 ($ billion)
        • Data Table on US - Market size and forecast 2024-2029 ($ billion)
        • Chart on US - Year-over-year growth 2024-2029 (%)
        • Data Table on US - Year-over-year growth 2024-2029 (%)
      • 11.9 China - Market size and forecast 2024-2029
        • Chart on China - Market size and forecast 2024-2029 ($ billion)
        • Data Table on China - Market size and forecast 2024-2029 ($ billion)
        • Chart on China - Year-over-year growth 2024-2029 (%)
        • Data Table on China - Year-over-year growth 2024-2029 (%)
      • 11.10 Canada - Market size and forecast 2024-2029
        • Chart on Canada - Market size and forecast 2024-2029 ($ billion)
        • Data Table on Canada - Market size and forecast 2024-2029 ($ billion)
        • Chart on Canada - Year-over-year growth 2024-2029 (%)
        • Data Table on Canada - Year-over-year growth 2024-2029 (%)
      • 11.11 UK - Market size and forecast 2024-2029
        • Chart on UK - Market size and forecast 2024-2029 ($ billion)
        • Data Table on UK - Market size and forecast 2024-2029 ($ billion)
        • Chart on UK - Year-over-year growth 2024-2029 (%)
        • Data Table on UK - Year-over-year growth 2024-2029 (%)
      • 11.12 Japan - Market size and forecast 2024-2029
        • Chart on Japan - Market size and forecast 2024-2029 ($ billion)
        • Data Table on Japan - Market size and forecast 2024-2029 ($ billion)
        • Chart on Japan - Year-over-year growth 2024-2029 (%)
        • Data Table on Japan - Year-over-year growth 2024-2029 (%)
      • 11.13 India - Market size and forecast 2024-2029
        • Chart on India - Market size and forecast 2024-2029 ($ billion)
        • Data Table on India - Market size and forecast 2024-2029 ($ billion)
        • Chart on India - Year-over-year growth 2024-2029 (%)
        • Data Table on India - Year-over-year growth 2024-2029 (%)
      • 11.14 Germany - Market size and forecast 2024-2029
        • Chart on Germany - Market size and forecast 2024-2029 ($ billion)
        • Data Table on Germany - Market size and forecast 2024-2029 ($ billion)
        • Chart on Germany - Year-over-year growth 2024-2029 (%)
        • Data Table on Germany - Year-over-year growth 2024-2029 (%)
      • 11.15 Italy - Market size and forecast 2024-2029
        • Chart on Italy - Market size and forecast 2024-2029 ($ billion)
        • Data Table on Italy - Market size and forecast 2024-2029 ($ billion)
        • Chart on Italy - Year-over-year growth 2024-2029 (%)
        • Data Table on Italy - Year-over-year growth 2024-2029 (%)
      • 11.16 Brazil - Market size and forecast 2024-2029
        • Chart on Brazil - Market size and forecast 2024-2029 ($ billion)
        • Data Table on Brazil - Market size and forecast 2024-2029 ($ billion)
        • Chart on Brazil - Year-over-year growth 2024-2029 (%)
        • Data Table on Brazil - Year-over-year growth 2024-2029 (%)
      • 11.17 UAE - Market size and forecast 2024-2029
        • Chart on UAE - Market size and forecast 2024-2029 ($ billion)
        • Data Table on UAE - Market size and forecast 2024-2029 ($ billion)
        • Chart on UAE - Year-over-year growth 2024-2029 (%)
        • Data Table on UAE - Year-over-year growth 2024-2029 (%)
      • 11.18 Market opportunity by geography
        • Market opportunity by geography ($ billion)
        • Data Tables on Market opportunity by geography ($ billion)

      12 Drivers, Challenges, and Opportunity/Restraints

      • 12.1 Market drivers
        • 12.2 Market challenges
          • 12.3 Impact of drivers and challenges
            • Impact of drivers and challenges in 2024 and 2029
          • 12.4 Market opportunities/restraints

            13 Competitive Landscape

            • 13.1 Overview
              • 13.2 Competitive Landscape
                • Overview on criticality of inputs and factors of differentiation
              • 13.3 Landscape disruption
                • Overview on factors of disruption
              • 13.4 Industry risks
                • Impact of key risks on business

              14 Competitive Analysis

              • 14.1 Companies profiled
                • Companies covered
              • 14.2 Company ranking index
                • Company ranking index
              • 14.3 Market positioning of companies
                • Matrix on companies position and classification
              • 14.4 Acer Inc.
                • Acer Inc. - Overview
                • Acer Inc. - Business segments
                • Acer Inc. - Key news
                • Acer Inc. - Key offerings
                • Acer Inc. - Segment focus
                • SWOT
              • 14.5 Brother Industries Ltd.
                • Brother Industries Ltd. - Overview
                • Brother Industries Ltd. - Business segments
                • Brother Industries Ltd. - Key news
                • Brother Industries Ltd. - Key offerings
                • Brother Industries Ltd. - Segment focus
                • SWOT
              • 14.6 Canon Inc.
                • Canon Inc. - Overview
                • Canon Inc. - Business segments
                • Canon Inc. - Key news
                • Canon Inc. - Key offerings
                • Canon Inc. - Segment focus
                • SWOT
              • 14.7 Dell Technologies Inc.
                • Dell Technologies Inc. - Overview
                • Dell Technologies Inc. - Business segments
                • Dell Technologies Inc. - Key news
                • Dell Technologies Inc. - Key offerings
                • Dell Technologies Inc. - Segment focus
                • SWOT
              • 14.8 FURUKAWA Co. Ltd.
                • FURUKAWA Co. Ltd. - Overview
                • FURUKAWA Co. Ltd. - Business segments
                • FURUKAWA Co. Ltd. - Key news
                • FURUKAWA Co. Ltd. - Key offerings
                • FURUKAWA Co. Ltd. - Segment focus
                • SWOT
              • 14.9 HP Inc.
                • HP Inc. - Overview
                • HP Inc. - Business segments
                • HP Inc. - Key news
                • HP Inc. - Key offerings
                • HP Inc. - Segment focus
                • SWOT
              • 14.10 Intel Corp.
                • Intel Corp. - Overview
                • Intel Corp. - Business segments
                • Intel Corp. - Key news
                • Intel Corp. - Key offerings
                • Intel Corp. - Segment focus
                • SWOT
              • 14.11 International Business Machines Corp.
                • International Business Machines Corp. - Overview
                • International Business Machines Corp. - Business segments
                • International Business Machines Corp. - Key news
                • International Business Machines Corp. - Key offerings
                • International Business Machines Corp. - Segment focus
                • SWOT
              • 14.12 Lexmark International Inc.
                • Lexmark International Inc. - Overview
                • Lexmark International Inc. - Product / Service
                • Lexmark International Inc. - Key news
                • Lexmark International Inc. - Key offerings
                • SWOT
              • 14.13 Microsoft Corp.
                • Microsoft Corp. - Overview
                • Microsoft Corp. - Business segments
                • Microsoft Corp. - Key news
                • Microsoft Corp. - Key offerings
                • Microsoft Corp. - Segment focus
                • SWOT
              • 14.14 Seagate Technology LLC
                • Seagate Technology LLC - Overview
                • Seagate Technology LLC - Product / Service
                • Seagate Technology LLC - Key news
                • Seagate Technology LLC - Key offerings
                • SWOT
              • 14.15 Seiko Epson Corp.
                • Seiko Epson Corp. - Overview
                • Seiko Epson Corp. - Business segments
                • Seiko Epson Corp. - Key news
                • Seiko Epson Corp. - Key offerings
                • Seiko Epson Corp. - Segment focus
                • SWOT
              • 14.16 Sony Group Corp.
                • Sony Group Corp. - Overview
                • Sony Group Corp. - Business segments
                • Sony Group Corp. - Key offerings
                • Sony Group Corp. - Segment focus
                • SWOT
              • 14.17 Toshiba Corp.
                • Toshiba Corp. - Overview
                • Toshiba Corp. - Business segments
                • Toshiba Corp. - Key news
                • Toshiba Corp. - Key offerings
                • Toshiba Corp. - Segment focus
                • SWOT
              • 14.18 Western Digital Corp.
                • Western Digital Corp. - Overview
                • Western Digital Corp. - Business segments
                • Western Digital Corp. - Key offerings
                • Western Digital Corp. - Segment focus
                • SWOT

              15 Appendix

              • 15.1 Scope of the report
                • 15.2 Inclusions and exclusions checklist
                  • Inclusions checklist
                  • Exclusions checklist
                • 15.3 Currency conversion rates for US$
                  • Currency conversion rates for US$
                • 15.4 Research methodology
                  • Research methodology
                • 15.5 Data procurement
                  • Information sources
                • 15.6 Data validation
                  • Data validation
                • 15.7 Validation techniques employed for market sizing
                  • Validation techniques employed for market sizing
                • 15.8 Data synthesis
                  • Data synthesis
                • 15.9 360 degree market analysis
                  • 360 degree market analysis
                • 15.10 List of abbreviations
                  • List of abbreviations

                Research Methodology

                Technavio presents a detailed picture of the market by way of study, synthesis, and summation of data from multiple sources. The analysts have presented the various facets of the market with a particular focus on identifying the key industry influencers. The data thus presented is comprehensive, reliable, and the result of extensive research, both primary and secondary.

                INFORMATION SOURCES

                Primary sources

                • Manufacturers and suppliers
                • Channel partners
                • Industry experts
                • Strategic decision makers

                Secondary sources

                • Industry journals and periodicals
                • Government data
                • Financial reports of key industry players
                • Historical data
                • Press releases

                DATA ANALYSIS

                Data Synthesis

                • Collation of data
                • Estimation of key figures
                • Analysis of derived insights

                Data Validation

                • Triangulation with data models
                • Reference against proprietary databases
                • Corroboration with industry experts

                REPORT WRITING

                Qualitative

                • Market drivers
                • Market challenges
                • Market trends
                • Five forces analysis

                Quantitative

                • Market size and forecast
                • Market segmentation
                • Geographical insights
                • Competitive landscape

                Interested in this report?

                Get your sample now to see our research methodology and insights!

                Download Now

                Frequently Asked Questions

                Pc Peripherals market growth will increase by $ 70.8 bn during 2025-2029 .

                The Pc Peripherals market is expected to grow at a CAGR of 8.5% during 2025-2029 .

                Pc Peripherals market is segmented by Product( Printers, Speakers, Others, South America, MEA) End-user( Business, Consumers, Others)

                Acer Inc., Brother Industries Ltd., Canon Inc., Dell Technologies Inc., FURUKAWA Co. Ltd., HP Inc., Intel Corp., International Business Machines Corp., Lexmark International Inc., Logitech International SA, Microsoft Corp., Panasonic Holdings Corp., Ricoh Co. Ltd., Samsung Electronics Co. Ltd., Seagate Technology LLC, Seiko Epson Corp., Sony Group Corp., Toshiba Corp., Western Digital Corp., Xerox Holdings Corp. are a few of the key vendors in the Pc Peripherals market.

                North America will register the highest growth rate of 47% among the other regions. Therefore, the Pc Peripherals market in North America is expected to garner significant business opportunities for the vendors during the forecast period.

                US, China, Canada, UK, Japan, India, Germany, Italy, Brazil, UAE

                • Growing popularity of gaming and esportsGaming and esports have become increasingly popular in recent years is the driving factor this market.
                • and this trend has had a significant impact on the global PC peripherals market. Here are some of the ways in which gaming and esports are driving the demand for PC peripherals:High-Performance Requirements: Gamers and esports professionals demand high-performance PC peripherals that offer fast response times is the driving factor this market.
                • precision is the driving factor this market.
                • and customization options. This has led to the development of specialized gaming keyboards is the driving factor this market.
                • mice is the driving factor this market.
                • and headsets that are optimized for gaming and esports.Competitive Gaming: The rise of competitive gaming and esports has led to an increased demand for specialized peripherals that can give players an edge over their competitors. Companies are investing in research and development to create products that offer superior performance and features.Streaming and Content Creation: Many gamers and esports professionals also create content is the driving factor this market.
                • such as live streams and videos is the driving factor this market.
                • for their fans. This has led to an increased demand for peripherals such as webcams is the driving factor this market.
                • microphones is the driving factor this market.
                • and capture cards that enable high-quality content creation.Personalization: Gaming and esports enthusiasts are often passionate about their hobbies and want to express this passion through their peripherals. This has led to an increased demand for personalized and customizable peripherals is the driving factor this market.
                • such as gaming keyboards with programmable RGB lighting.The gaming and esports markets are growing rapidly is the driving factor this market.
                • with more and more people getting involved in these activities. This has created a large and growing market for PC peripherals that are optimized for gaming and esports. Thus is the driving factor this market.
                • the growing popularity of gaming and esports is expected to drive the growth of the global PC peripherals market during the forecast period. is the driving factor this market.

                The Pc Peripherals market vendors should focus on grabbing business opportunities from the Printers segment as it accounted for the largest market share in the base year.