
PCR System for Food Diagnostics Market Size 2024-2028
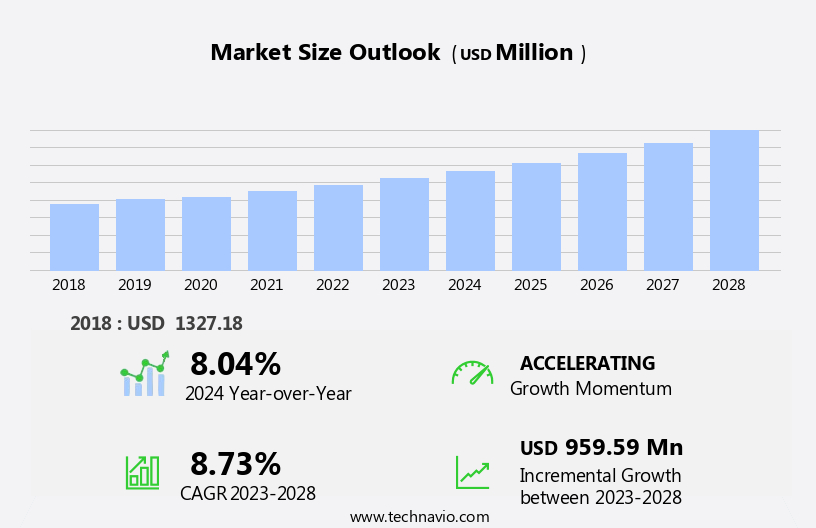
The pcr system for food diagnostics market size is forecast to increase by USD 959.59 million at a CAGR of 8.73% between 2023 and 2028.
- The market is experiencing significant growth due to the rising incidence of foodborne illnesses and increasing consumer awareness about food safety. According to the Centers for Disease Control and Prevention (CDC), approximately 48 million Americans fall ill from foodborne diseases each year, leading to approximately 128,000 hospitalizations and 3,000 deaths. This trend is expected to continue, driving the demand for advanced diagnostic tools to ensure food safety. Moreover, climate change and global warming are posing new challenges to food production, increasing the need for rapid and accurate food diagnostics. Extreme weather conditions, such as droughts and floods, can contaminate food supplies, leading to foodborne illnesses.
- PCR systems offer a reliable and efficient solution for detecting foodborne pathogens, enabling food manufacturers and regulatory authorities to ensure food safety and protect public health. Companies seeking to capitalize on this market opportunity should focus on developing user-friendly, cost-effective, and high-throughput PCR systems for food diagnostics. Additionally, partnerships with food industry players and regulatory authorities can provide valuable market insights and facilitate market entry.
What will be the Size of the PCR System for Food Diagnostics Market during the forecast period?
- The PCR (Polymerase Chain Reaction) system for food diagnostics is a critical technology in the global food industry, enabling rapid and accurate detection and quantification of foodborne pathogens. This market is driven by the increasing demand for enhanced food safety and quality, with automation being a key trend. PCR utilizes a DNA template from the food sample, DNA-polymerase, and primers to amplify specific nucleotide sequences related to target pathogens. Fluorescent dyes and thermocyclers facilitate the detection process, while automated sample enrichment and multiplex PCR techniques enhance throughput and specificity. The food diagnostics PCR market is significant and growing, with applications ranging from HACCP verification to contamination quantification.
- Emerging pathogens and the need for increased sensitivity and specificity continue to fuel market expansion. The technology's ability to provide rapid results and its alignment with molecular biology principles further strengthens its position in food microbiology. AOAC validation and continuous advancements in PCR technology contribute to its widespread acceptance and use.
How is this PCR System for Food Diagnostics Industry segmented?
The pcr system for food diagnostics industry research report provides comprehensive data (region-wise segment analysis), with forecasts and estimates in "USD million" for the period 2024-2028, as well as historical data from 2018-2022 for the following segments.
- Application
- Household
- Commercial
- Product
- Consumables
- Instruments
- Geography
- North America
- US
- Canada
- Europe
- France
- Germany
- UK
- Asia
- Rest of World (ROW)
- North America
By Application Insights
The household segment is estimated to witness significant growth during the forecast period.
The PCR (Polymerase Chain Reaction) system plays a significant role in food diagnostics, enabling rapid and specific detection of food allergens, food quality issues, genetically modified organisms, and contaminants. This automated technology uses primers to amplify DNA sequences, enhancing sensitivity and selectivity. Food microbiology applications, such as the detection of Listeria monocytogenes, Escherichia coli, Salmonella, Campylobacter, and other foodborne pathogens, benefit from PCR's high specificity and ability to perform quantitative analysis. The increasing prevalence of foodborne diseases, food adulteration cases, and consumer safety concerns drive the demand for advanced analytical methods in food diagnostics. Sample enrichment techniques and internal amplification controls ensure accurate and reliable results.
Multiplex PCR technology allows for the simultaneous detection of multiple targets, increasing efficiency and reducing costs. The market for PCR systems in food diagnostics is expected to grow as food industries prioritize quality control and pathogen detection to prevent contamination and protect consumer safety. Instrument capacity and DNA-polymerase advancements contribute to the market's expansion. The technology's ability to detect emerging pathogens and spoilage organisms further strengthens its importance in the food industry. Standardization and automation are essential aspects of PCR system applications, ensuring consistent and reliable results. The AOAC validation and HACCP verification processes ensure the technology's accuracy and reliability for food diagnostics.
PCR systems are essential tools in molecular biology for food authentication and amplification processes.
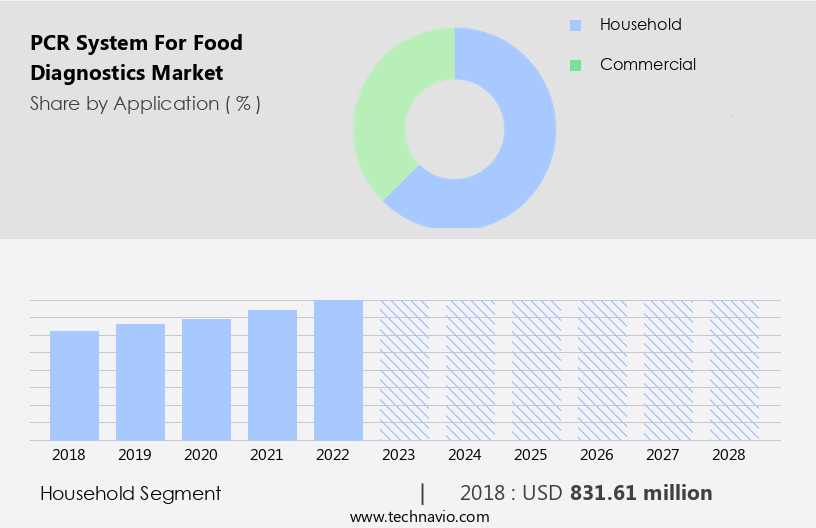
Get a glance at the market report of share of various segments Request Free Sample
The Household segment was valued at USD 831.61 million in 2018 and showed a gradual increase during the forecast period.
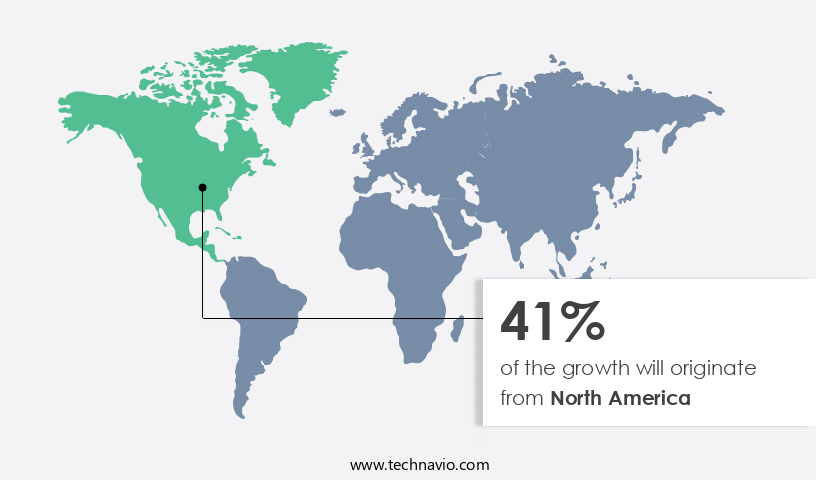
Regional Analysis
North America is estimated to contribute 41% to the growth of the global market during the forecast period.Technavio’s analysts have elaborately explained the regional trends and drivers that shape the market during the forecast period.
For more insights on the market size of various regions, Request Free Sample
The PCR (Polymerase Chain Reaction) system plays a crucial role in food diagnostics, enabling the specific detection of food allergens, pathogens, genetically modified organisms, and spoilage organisms. This automated technology uses primers to amplify DNA sequences, enhancing the sensitivity and selectivity of detection methods. Quantitative PCR is a valuable tool for measuring the concentration of nucleotides in food samples, ensuring food quality and consumer safety. The food diagnostics market is driven by the need for rapid detection of foodborne diseases caused by pathogens such as Listeria monocytogenes, Escherichia coli, Salmonella, and Campylobacter. The increasing prevalence of foodborne illnesses and the stringent regulatory requirements for food microbiology and HACCP verification necessitate the adoption of advanced analytical methods.
PCR technology offers significant advantages, including the ability to detect multiple pathogens through multiplex PCR and the use of internal amplification controls for quality assurance. Automation and standardization of PCR processes further enhance the efficiency and reliability of food diagnostics. The presence of several regulatory organizations in North America makes these countries major contributors to the food diagnostics market. Ensuring compliance with the standards is essential for food companies to maintain the marketing of their products. In Canada, Health Canada and the Canadian Food Inspection Agency oversee food safety regulations, while six independent surveillance systems are used to estimate foodborne illnesses.
These include the Canadian Notifiable Disease Surveillance System, the National Enteric Surveillance Program, the Enhanced National Listeriosis Surveillance, FoodNet Canada, the Provincial and Territorial Reportable Disease Surveillance System, and the National Studies on Acute Gastrointestinal Illness.
Market Dynamics
Our researchers analyzed the data with 2023 as the base year, along with the key drivers, trends, and challenges. A holistic analysis of drivers will help companies refine their marketing strategies to gain a competitive advantage.
What are the key market drivers leading to the rise in the adoption of PCR System for Food Diagnostics Industry?
- Rising foodborne illnesses is the key driver of the market.
- Food safety is a significant concern due to the presence of microorganisms in plant-based and animal-based food products. Contamination can occur during production, processing, or consumption, leading to food spoilage and foodborne illnesses. According to , approximately 48 million people fall ill from foodborne diseases yearly, with around 128,000 hospitalizations and 3,000 fatalities. These health issues pose a serious threat to public well-being. To ensure food safety and prevent contamination, the PCR (Polymerase Chain Reaction) system is widely used in food diagnostics.
- This technology enables the detection and identification of specific pathogens, enabling food manufacturers and regulatory bodies to take appropriate measures. The PCR system's accuracy, sensitivity, and rapid results make it an essential tool in maintaining food safety standards. Food diagnostics using the PCR system contribute significantly to reducing the health risks associated with foodborne illnesses.
What are the market trends shaping the PCR System for Food Diagnostics Industry?
- Increasing consumer awareness about food safety is the upcoming market trend.
- In today's interconnected world, food safety awareness among consumers has gained significant importance. With easy access to various forms of media, consumers are increasingly making informed decisions regarding their food purchases. Food labels are a crucial source of vital nutritional and safety information. Social media is also being utilized to promote food safety awareness. The International Food Information Council (IFIC) monitors data flow through traditional and social media to ensure accurate dissemination of technical food safety information globally. The Centers for Disease Control and Prevention (CDC) provides a platform on its website for consumers to access food safety best practices.
- The PCR system plays a vital role in food diagnostics, ensuring food safety and quality. This technology is essential for detecting foodborne pathogens and contaminants, enabling food manufacturers and regulatory bodies to take swift action to prevent foodborne illnesses. The increasing consumer demand for safe and high-quality food, coupled with stringent regulatory requirements, is driving the growth of the food diagnostics market. The PCR system's ability to provide rapid and accurate results makes it an indispensable tool in the food industry.
What challenges does the PCR System for Food Diagnostics Industry face during its growth?
- Climate change and global warming affecting food production is a key challenge affecting the industry growth.
- Climate change, a significant global concern, is attributed to human activities, primarily the excessive use of fossil fuels, leading to rising carbon dioxide levels in the environment. This environmental shift adversely impacts food production and safety. Two primary challenges resulting from climate change are drought and extreme weather conditions. A drought occurs when below-average precipitation levels prevent adequate water supply to farms, impeding crop growth. Extreme weather conditions, such as heavy rainfall, hailstorms, and high temperatures, can also damage crops and livestock.
- These factors necessitate advanced diagnostic tools to ensure food safety and maintain food security. The PCR system for food diagnostics plays a crucial role in identifying contaminants and pathogens, ensuring the production of safe and healthy food for consumers. This technology offers rapid, accurate, and sensitive results, making it an essential tool in the food industry's response to climate change-related challenges.
Exclusive Customer Landscape
The pcr system for food diagnostics market forecasting report includes the adoption lifecycle of the market, covering from the innovator’s stage to the laggard’s stage. It focuses on adoption rates in different regions based on penetration. Furthermore, the pcr system for food diagnostics market report also includes key purchase criteria and drivers of price sensitivity to help companies evaluate and develop their market growth analysis strategies.
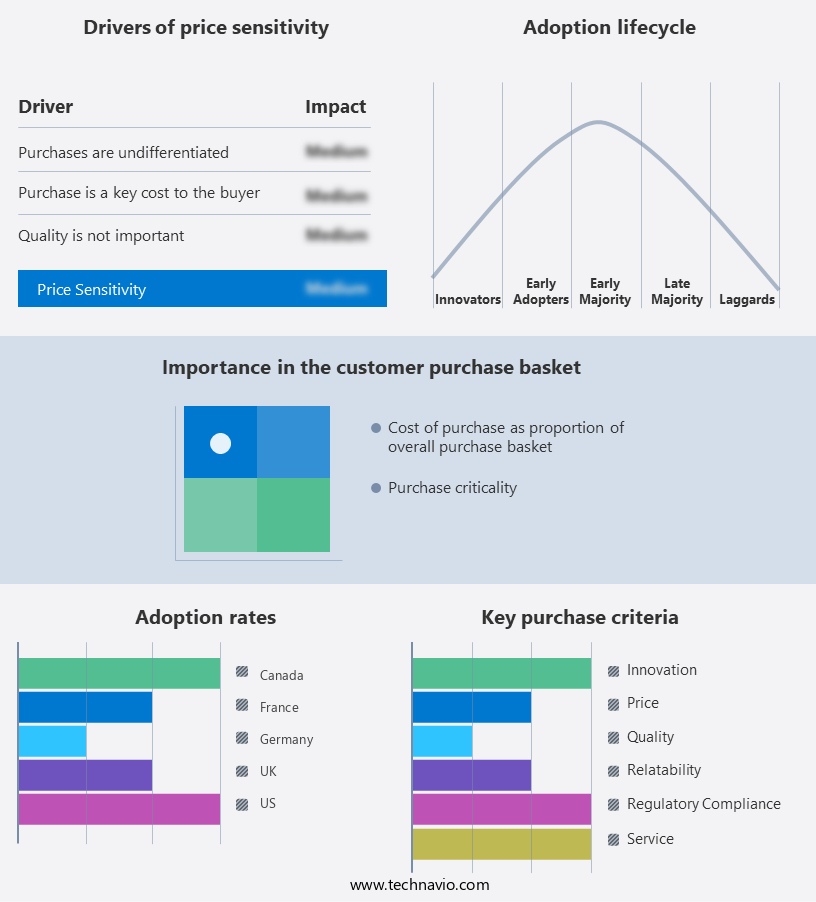
Customer Landscape
Key Companies & Market Insights
Companies are implementing various strategies, such as strategic alliances, pcr system for food diagnostics market forecast, partnerships, mergers and acquisitions, geographical expansion, and product/service launches, to enhance their presence in the industry.
Agilent Technologies Inc. - The company provides a cutting-edge PCR diagnostic solution, featuring the AriaMx real-time PCR system. This fully integrated qPCR system encompasses amplification, detection, and data analysis capabilities. It comprises a novel thermal cycler, an advanced optical system with LED excitation source, and comprehensive data analysis software, delivering accurate and efficient results for various applications.
The industry research and growth report includes detailed analyses of the competitive landscape of the market and information about key companies, including:
- Agilent Technologies Inc.
- Bio Rad Laboratories Inc.
- bioMerieux SA
- EW Group GmBH
- Generon SpA
- Genesystem
- Lumex Instruments
- LuminUltra Technologies Ltd
- Merck and Co. Inc.
- Microsynth AG
- Minerva Biolabs GmbH
- Molbio Diagnostics Pvt. Ltd.
- Mylab Discovery Solutions Pvt Ltd.
- PerkinElmer Inc
- QIAGEN NV
- QuantuMDx Group Ltd.
- R Biopharm AG
- SAN Group GmbH
- Thermo Fisher Scientific Inc.
- Xiamen Zeesan Biotech Co. Ltd.
Qualitative and quantitative analysis of companies has been conducted to help clients understand the wider business environment as well as the strengths and weaknesses of key industry players. Data is qualitatively analyzed to categorize companies as pure play, category-focused, industry-focused, and diversified; it is quantitatively analyzed to categorize companies as dominant, leading, strong, tentative, and weak.
Research Analyst Overview
The PCR (Polymerase Chain Reaction) system has revolutionized the field of food diagnostics, providing a and efficient solution for the detection of various contaminants and foodborne pathogens. This molecular biology-based technology utilizes primers to selectively amplify specific DNA sequences, enabling the identification of food allergens, genetically modified organisms (GMOs), spoilage organisms, and foodborne pathogens with high sensitivity and specificity. The PCR system's ability to detect contaminants at trace levels makes it an essential tool in ensuring food quality and consumer safety. The automation of PCR instruments and the capacity to process multiple samples in parallel have significantly reduced the time and resources required for food diagnostics.
Sample enrichment techniques are often employed to increase the amount of target DNA in the sample, enhancing the sensitivity of the PCR assay. DNA-polymerase, a crucial component of the PCR reaction, catalyzes the synthesis of new DNA strands based on the template DNA and the provided primers. Standardization of PCR methods is crucial for accurate and reliable results. The use of internal amplification controls and stringent quality control measures ensures the consistency and reliability of PCR-based food diagnostics. The application of PCR technology extends to the detection of emerging pathogens, including Listeria monocytogenes, Eschericherichia coli, Salmonella, and Campylobacter.
Rapid detection of these pathogens is vital for food microbiology and HACCP (Hazard Analysis and Critical Control Points) verification. The AOAC (Association of Analytical Communities) validation of PCR-based methods further solidifies their role as a trusted analytical tool in the food industry. The technology's versatility and ability to perform multiplex PCR, which allows the simultaneous detection of multiple targets, make it an indispensable component of modern food diagnostics. The PCR system's role in food diagnostics is paramount in maintaining food safety and ensuring the authenticity of food products. Its sensitivity and selectivity, coupled with the ongoing advancements in automation and instrument capacity, continue to drive its adoption in the food industry.
In , the PCR system's impact on food diagnostics is undeniable. Its ability to detect contaminants and foodborne pathogens with high sensitivity and specificity, coupled with its automation and standardization, makes it an essential tool in maintaining food quality and ensuring consumer safety. The ongoing advancements in this technology continue to expand its applications and enhance its capabilities, solidifying its role as a cornerstone of food diagnostics.
|
Market Scope |
|
|
Report Coverage |
Details |
|
Page number |
156 |
|
Base year |
2023 |
|
Historic period |
2018-2022 |
|
Forecast period |
2024-2028 |
|
Growth momentum & CAGR |
Accelerate at a CAGR of 8.73% |
|
Market growth 2024-2028 |
USD 959.59 million |
|
Market structure |
Fragmented |
|
YoY growth 2023-2024(%) |
8.04 |
|
Key countries |
US, Canada, Germany, UK, and France |
|
Competitive landscape |
Leading Companies, Market Positioning of Companies, Competitive Strategies, and Industry Risks |
What are the Key Data Covered in this PCR System for Food Diagnostics Market Research and Growth Report?
- CAGR of the PCR System for Food Diagnostics industry during the forecast period
- Detailed information on factors that will drive the growth and forecasting between 2024 and 2028
- Precise estimation of the size of the market and its contribution of the industry in focus to the parent market
- Accurate predictions about upcoming growth and trends and changes in consumer behaviour
- Growth of the market across North America, Europe, Asia, and Rest of World (ROW)
- Thorough analysis of the market’s competitive landscape and detailed information about companies
- Comprehensive analysis of factors that will challenge the pcr system for food diagnostics market growth of industry companies
We can help! Our analysts can customize this pcr system for food diagnostics market research report to meet your requirements.
 RIA -
RIA - 
