Personalized Nutrition Market Analysis, Size, and Forecast 2026-2030: North America (US, Canada, and Mexico), Europe (Germany, UK, and France), APAC (China, Japan, and India), South America (Brazil, Argentina, and Colombia), Middle East and Africa (Saudi Arabia, UAE, and Israel), and Rest of World (ROW)

Personalized Nutrition Market Analysis, Size, and Forecast 2026-2030:
North America (US, Canada, and Mexico), Europe (Germany, UK, and France), APAC (China, Japan, and India), South America (Brazil, Argentina, and Colombia), Middle East and Africa (Saudi Arabia, UAE, and Israel), and Rest of World (ROW)

Published: Dec 2025 289 Pages SKU: IRTNTR76080

Market Overview at a Glance

$9.94 B
Market Opportunity
12.1%
CAGR 2025 - 2030
38.8%
North America Growth
$6.55 B
Active measurement segment 2024

Personalized Nutrition Market Size 2026-2030

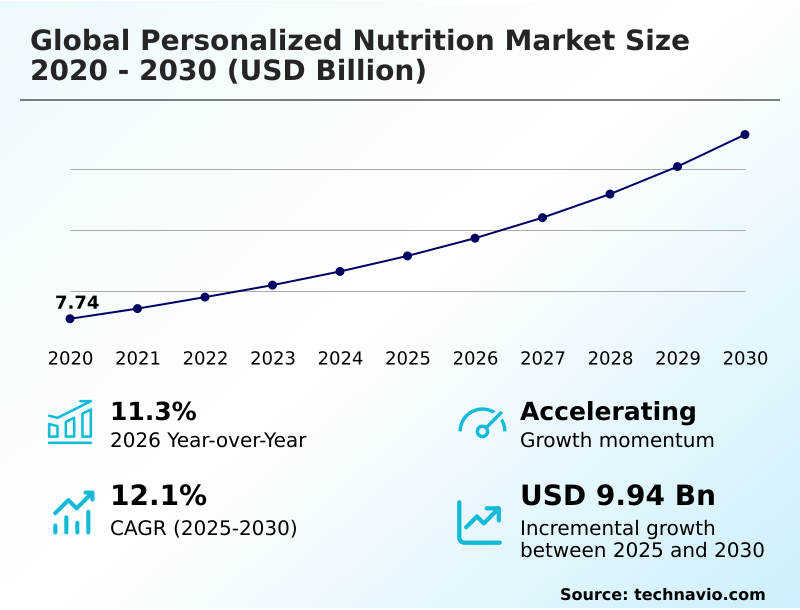
The personalized nutrition market size is valued to increase by USD 9.94 billion, at a CAGR of 12.1% from 2025 to 2030. Growing adoption of personalized nutrition products among athletes will drive the personalized nutrition market.

Major Market Trends & Insights

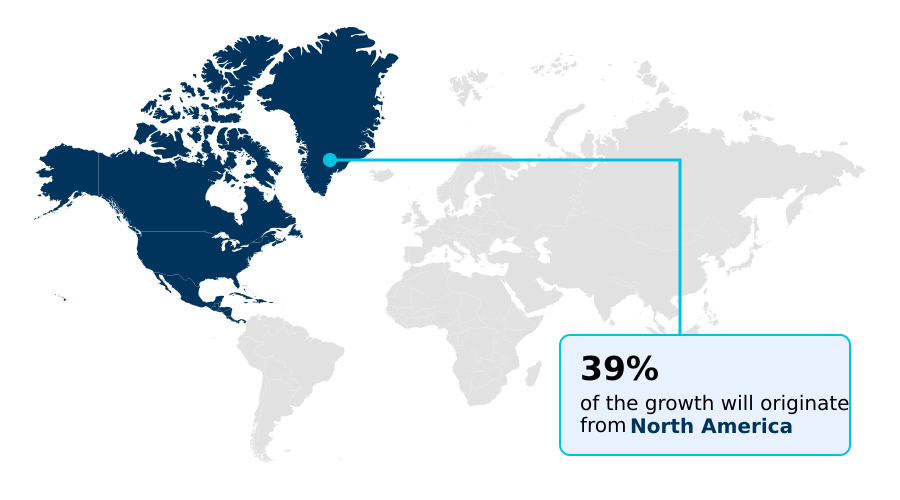
  • North America dominated the market and accounted for a 38.8% growth during the forecast period.
  • By Product Type - Active measurement segment was valued at USD 6.55 billion in 2024
  • By End-user - Direct to consumer segment accounted for the largest market revenue share in 2024

Market Size & Forecast

  • Market Opportunities: USD 15.07 billion
  • Market Future Opportunities: USD 9.94 billion
  • CAGR from 2025 to 2030 : 12.1%

Market Summary

What will be the Size of the Personalized Nutrition Market during the forecast period?

Get Key Insights on Market Forecast (PDF) Request Free Sample

How is the Personalized Nutrition Market Segmented?

The personalized nutrition industry research report provides comprehensive data (region-wise segment analysis), with forecasts and estimates in "USD million" for the period 2026-2030, as well as historical data from 2020-2024 for the following segments.

  • Product type
    • Active measurement
    • Standard measurement
  • End-user
    • Direct to consumer
    • Fitness centers
    • Hospital and clinics
    • Institutions
  • Age group
    • Adults
    • Geriatric
    • Pediatric
  • Geography
    • North America
      • US
      • Canada
      • Mexico
    • Europe
      • Germany
      • UK
      • France
    • APAC
      • China
      • Japan
      • India
    • South America
      • Brazil
      • Argentina
      • Colombia
    • Middle East and Africa
      • Saudi Arabia
      • UAE
      • Israel
    • Rest of World (ROW)

By Product Type Insights

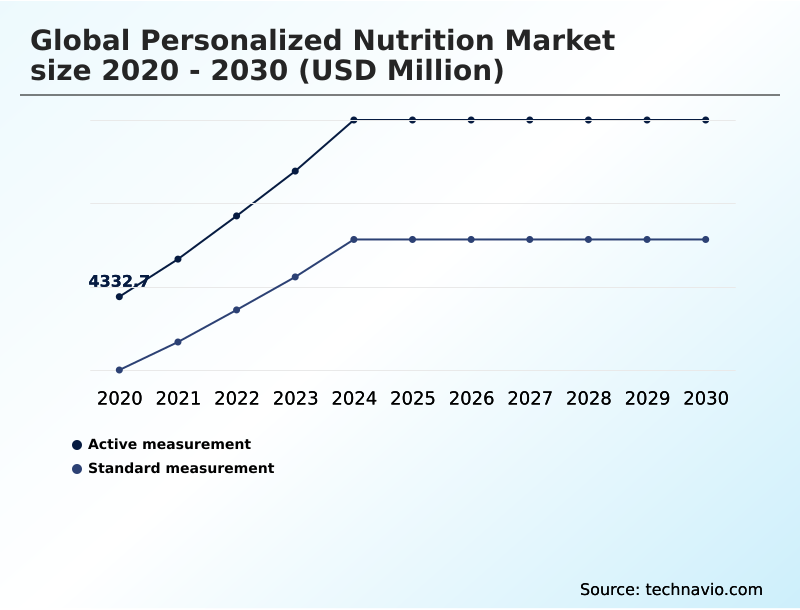
The active measurement segment is estimated to witness significant growth during the forecast period.

Request Free Sample

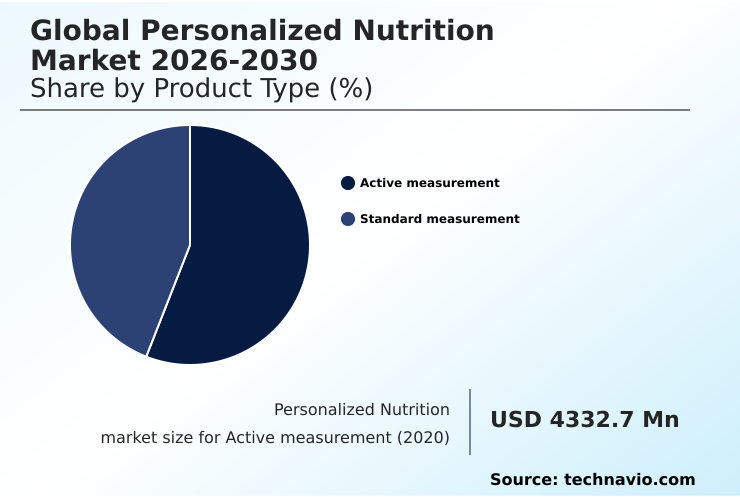
The Active measurement segment was valued at USD 6.55 billion in 2024 and showed a gradual increase during the forecast period.

Request Free Sample

Regional Analysis

North America is estimated to contribute 38.8% to the growth of the global market during the forecast period.Technavio’s analysts have elaborately explained the regional trends and drivers that shape the market during the forecast period.

See How Personalized Nutrition Market Demand is Rising in North America Request Free Sample

Market Dynamics

Our researchers analyzed the data with 2025 as the base year, along with the key drivers, trends, and challenges. A holistic analysis of drivers will help companies refine their marketing strategies to gain a competitive advantage.

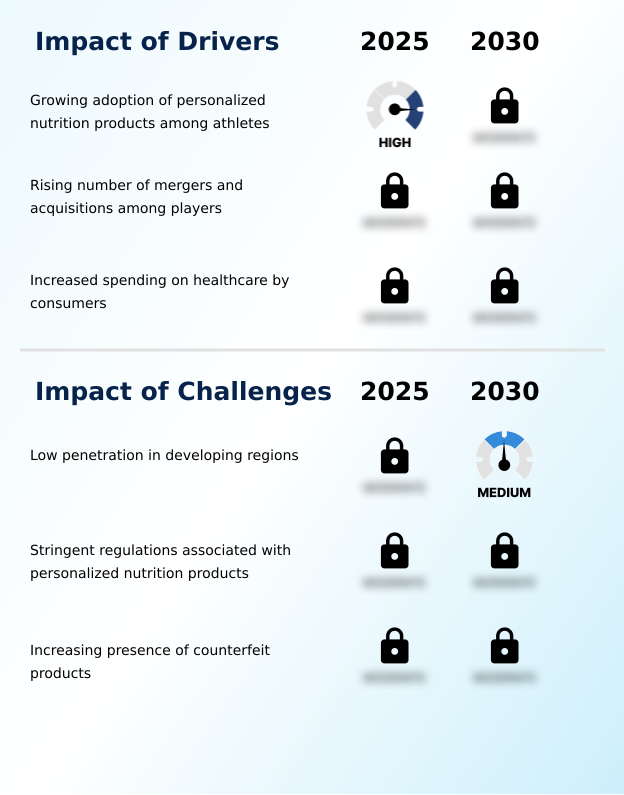
What are the key market drivers leading to the rise in the adoption of Personalized Nutrition Industry?

What are the market trends shaping the Personalized Nutrition Industry?

What challenges does the Personalized Nutrition Industry face during its growth?

Exclusive Technavio Analysis on Customer Landscape

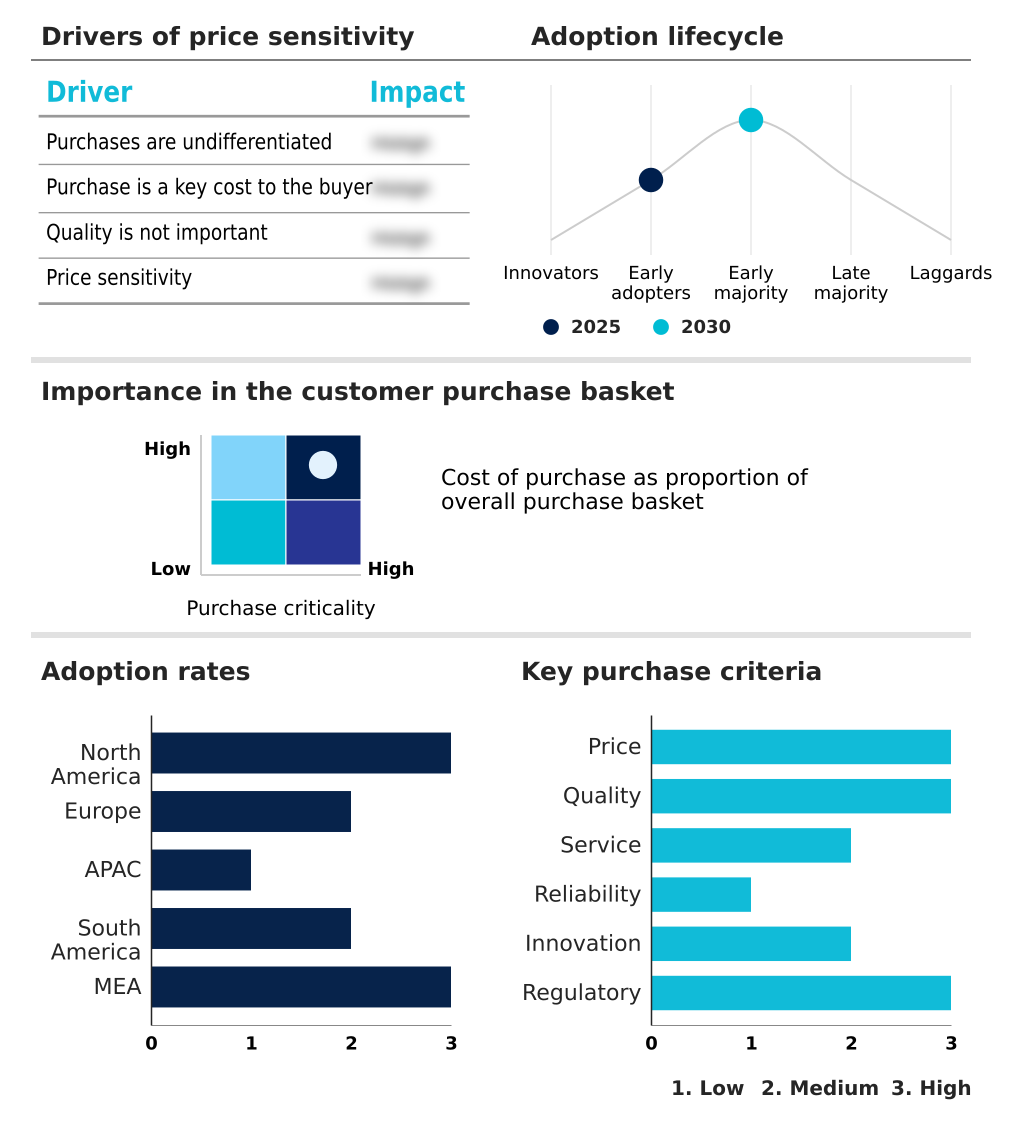
The personalized nutrition market forecasting report includes the adoption lifecycle of the market, covering from the innovator’s stage to the laggard’s stage. It focuses on adoption rates in different regions based on penetration. Furthermore, the personalized nutrition market report also includes key purchase criteria and drivers of price sensitivity to help companies evaluate and develop their market growth analysis strategies.

Customer Landscape of Personalized Nutrition Industry

Competitive Landscape

Companies are implementing various strategies, such as strategic alliances, personalized nutrition market forecast, partnerships, mergers and acquisitions, geographical expansion, and product/service launches, to enhance their presence in the industry.

Abbott Laboratories -

The industry research and growth report includes detailed analyses of the competitive landscape of the market and information about key companies, including:

  • Abbott Laboratories
  • Amway Corp.
  • Archer Daniels Midland Co.
  • Bactolac Pharmaceutical Inc.
  • Balchem Inc.
  • BASF SE
  • BIRON HEALTH GROUP
  • BlueDot Inc.
  • DSM Firmenich AG
  • Fagron NV
  • Nestle SA
  • Nourished Official
  • Nutrigenomix Inc.
  • Prenetics Global Ltd.
  • Segterra Inc.

Qualitative and quantitative analysis of companies has been conducted to help clients understand the wider business environment as well as the strengths and weaknesses of key industry players. Data is qualitatively analyzed to categorize companies as pure play, category-focused, industry-focused, and diversified; it is quantitatively analyzed to categorize companies as dominant, leading, strong, tentative, and weak.

Recent Development and News in Personalized nutrition market

Dive into Technavio’s robust research methodology, blending expert interviews, extensive data synthesis, and validated models for unparalleled Personalized Nutrition Market insights. See full methodology.

Market Scope
Page number 289
Base year 2025
Historic period 2020-2024
Forecast period 2026-2030
Growth momentum & CAGR Accelerate at a CAGR of 12.1%
Market growth 2026-2030 USD 9936.7 million
Market structure Fragmented
YoY growth 2025-2026(%) 11.3%
Key countries US, Canada, Mexico, Germany, UK, France, Italy, Spain, The Netherlands, China, Japan, India, South Korea, Australia, Indonesia, Brazil, Argentina, Colombia, Saudi Arabia, UAE, Israel, South Africa and Turkey
Competitive landscape Leading Companies, Market Positioning of Companies, Competitive Strategies, and Industry Risks

Request Free Sample

Research Analyst Overview

What are the Key Data Covered in this Personalized Nutrition Market Research and Growth Report?

  • What is the expected growth of the Personalized Nutrition Market between 2026 and 2030?

    • USD 9.94 billion, at a CAGR of 12.1%

  • What segmentation does the market report cover?

    • The report is segmented by Product Type (Active measurement, and Standard measurement), End-user (Direct to consumer, Wellness and fitness centers, Hospital and clinics, and Institutions), Age Group (Adults, Geriatric, and Pediatric) and Geography (North America, Europe, APAC, South America, Middle East and Africa)

  • Which regions are analyzed in the report?

    • North America, Europe, APAC, South America and Middle East and Africa

  • What are the key growth drivers and market challenges?

    • Growing adoption of personalized nutrition products among athletes, Low penetration in developing regions

  • Who are the major players in the Personalized Nutrition Market?

    • Abbott Laboratories, Amway Corp., Archer Daniels Midland Co., Bactolac Pharmaceutical Inc., Balchem Inc., BASF SE, BIRON HEALTH GROUP, BlueDot Inc., DSM Firmenich AG, Fagron NV, Nestle SA, Nourished Official, Nutrigenomix Inc., Prenetics Global Ltd. and Segterra Inc.

Market Research Insights

We can help! Our analysts can customize this personalized nutrition market research report to meet your requirements.

Get in touch

1. Executive Summary

1.1 Market overview

Executive Summary - Chart on Market Overview
Executive Summary - Data Table on Market Overview
Executive Summary - Chart on Global Market Characteristics
Executive Summary - Chart on Market by Geography
Executive Summary - Chart on Market Segmentation by Product Type
Executive Summary - Chart on Market Segmentation by End-user
Executive Summary - Chart on Market Segmentation by Age Group
Executive Summary - Chart on Incremental Growth
Executive Summary - Data Table on Incremental Growth
Executive Summary - Chart on Company Market Positioning

2. Technavio Analysis

2.1 Analysis of price sensitivity, lifecycle, customer purchase basket, adoption rates, and purchase criteria

2.2 Criticality of inputs and Factors of differentiation

Chart on Overview on criticality of inputs and factors of differentiation

2.3 Factors of disruption

Chart on Overview on factors of disruption

2.4 Impact of drivers and challenges

Chart on Impact of drivers and challenges in 2025 and 2030

3. Market Landscape

3.1 Market ecosystem

Chart on Parent Market
Data Table on - Parent Market

3.2 Market characteristics

Chart on Market characteristics analysis

3.3 Value chain analysis

Chart on Value chain analysis

4. Market Sizing

4.1 Market definition

Data Table on Offerings of companies included in the market definition

4.2 Market segment analysis

Market segments

4.3 Market size 2025

4.4 Market outlook: Forecast for 2025-2030

Chart on Global - Market size and forecast 2025-2030 ($ million)
Data Table on Global - Market size and forecast 2025-2030 ($ million)
Chart on Global Market: Year-over-year growth 2025-2030 (%)
Data Table on Global Market: Year-over-year growth 2025-2030 (%)

5. Historic Market Size

5.1 Global Personalized Nutrition Market 2020 - 2024

Historic Market Size - Data Table on Global Personalized Nutrition Market 2020 - 2024 ($ million)

5.2 Product Type segment analysis 2020 - 2024

Historic Market Size - Product Type Segment 2020 - 2024 ($ million)

5.3 End-user segment analysis 2020 - 2024

Historic Market Size - End-user Segment 2020 - 2024 ($ million)

5.4 Age Group segment analysis 2020 - 2024

Historic Market Size - Age Group Segment 2020 - 2024 ($ million)

5.5 Geography segment analysis 2020 - 2024

Historic Market Size - Geography Segment 2020 - 2024 ($ million)

5.6 Country segment analysis 2020 - 2024

Historic Market Size - Country Segment 2020 - 2024 ($ million)

6. Qualitative Analysis

6.1 The AI impact on Global Personalized Nutrition Market

7. Five Forces Analysis

7.1 Five forces summary

Five forces analysis - Comparison between 2025 and 2030

7.2 Bargaining power of buyers

Bargaining power of buyers - Impact of key factors 2025 and 2030

7.3 Bargaining power of suppliers

Bargaining power of suppliers - Impact of key factors in 2025 and 2030

7.4 Threat of new entrants

Threat of new entrants - Impact of key factors in 2025 and 2030

7.5 Threat of substitutes

Threat of substitutes - Impact of key factors in 2025 and 2030

7.6 Threat of rivalry

Threat of rivalry - Impact of key factors in 2025 and 2030

7.7 Market condition

Chart on Market condition - Five forces 2025 and 2030

8. Market Segmentation by Product Type

8.1 Market segments

Chart on Product Type - Market share 2025-2030 (%)
Data Table on Product Type - Market share 2025-2030 (%)

8.2 Comparison by Product Type

Chart on Comparison by Product Type
Data Table on Comparison by Product Type

8.3 Active measurement - Market size and forecast 2025-2030

Chart on Active measurement - Market size and forecast 2025-2030 ($ million)
Data Table on Active measurement - Market size and forecast 2025-2030 ($ million)
Chart on Active measurement - Year-over-year growth 2025-2030 (%)
Data Table on Active measurement - Year-over-year growth 2025-2030 (%)

8.4 Standard measurement - Market size and forecast 2025-2030

Chart on Standard measurement - Market size and forecast 2025-2030 ($ million)
Data Table on Standard measurement - Market size and forecast 2025-2030 ($ million)
Chart on Standard measurement - Year-over-year growth 2025-2030 (%)
Data Table on Standard measurement - Year-over-year growth 2025-2030 (%)

8.5 Market opportunity by Product Type

Market opportunity by Product Type ($ million)
Data Table on Market opportunity by Product Type ($ million)

9. Market Segmentation by End-user

9.1 Market segments

Chart on End-user - Market share 2025-2030 (%)
Data Table on End-user - Market share 2025-2030 (%)

9.2 Comparison by End-user

Chart on Comparison by End-user
Data Table on Comparison by End-user

9.3 Direct to consumer - Market size and forecast 2025-2030

Chart on Direct to consumer - Market size and forecast 2025-2030 ($ million)
Data Table on Direct to consumer - Market size and forecast 2025-2030 ($ million)
Chart on Direct to consumer - Year-over-year growth 2025-2030 (%)
Data Table on Direct to consumer - Year-over-year growth 2025-2030 (%)

9.4 Fitness centers - Market size and forecast 2025-2030

Chart on Fitness centers - Market size and forecast 2025-2030 ($ million)
Data Table on Fitness centers - Market size and forecast 2025-2030 ($ million)
Chart on Fitness centers - Year-over-year growth 2025-2030 (%)
Data Table on Fitness centers - Year-over-year growth 2025-2030 (%)

9.5 Hospital and clinics - Market size and forecast 2025-2030

Chart on Hospital and clinics - Market size and forecast 2025-2030 ($ million)
Data Table on Hospital and clinics - Market size and forecast 2025-2030 ($ million)
Chart on Hospital and clinics - Year-over-year growth 2025-2030 (%)
Data Table on Hospital and clinics - Year-over-year growth 2025-2030 (%)

9.6 Institutions - Market size and forecast 2025-2030

Chart on Institutions - Market size and forecast 2025-2030 ($ million)
Data Table on Institutions - Market size and forecast 2025-2030 ($ million)
Chart on Institutions - Year-over-year growth 2025-2030 (%)
Data Table on Institutions - Year-over-year growth 2025-2030 (%)

9.7 Market opportunity by End-user

Market opportunity by End-user ($ million)
Data Table on Market opportunity by End-user ($ million)

10. Market Segmentation by Age Group

10.1 Market segments

Chart on Age Group - Market share 2025-2030 (%)
Data Table on Age Group - Market share 2025-2030 (%)

10.2 Comparison by Age Group

Chart on Comparison by Age Group
Data Table on Comparison by Age Group

10.3 Adults - Market size and forecast 2025-2030

Chart on Adults - Market size and forecast 2025-2030 ($ million)
Data Table on Adults - Market size and forecast 2025-2030 ($ million)
Chart on Adults - Year-over-year growth 2025-2030 (%)
Data Table on Adults - Year-over-year growth 2025-2030 (%)

10.4 Geriatric - Market size and forecast 2025-2030

Chart on Geriatric - Market size and forecast 2025-2030 ($ million)
Data Table on Geriatric - Market size and forecast 2025-2030 ($ million)
Chart on Geriatric - Year-over-year growth 2025-2030 (%)
Data Table on Geriatric - Year-over-year growth 2025-2030 (%)

10.5 Pediatric - Market size and forecast 2025-2030

Chart on Pediatric - Market size and forecast 2025-2030 ($ million)
Data Table on Pediatric - Market size and forecast 2025-2030 ($ million)
Chart on Pediatric - Year-over-year growth 2025-2030 (%)
Data Table on Pediatric - Year-over-year growth 2025-2030 (%)

10.6 Market opportunity by Age Group

Market opportunity by Age Group ($ million)
Data Table on Market opportunity by Age Group ($ million)

11. Customer Landscape

11.1 Customer landscape overview

Analysis of price sensitivity, lifecycle, customer purchase basket, adoption rates, and purchase criteria

12. Geographic Landscape

12.1 Geographic segmentation

Chart on Market share by geography 2025-2030 (%)
Data Table on Market share by geography 2025-2030 (%)

12.2 Geographic comparison

Chart on Geographic comparison
Data Table on Geographic comparison

12.3 North America - Market size and forecast 2025-2030

Chart on North America - Market size and forecast 2025-2030 ($ million)
Data Table on North America - Market size and forecast 2025-2030 ($ million)
Chart on North America - Year-over-year growth 2025-2030 (%)
Data Table on North America - Year-over-year growth 2025-2030 (%)
Chart on Regional Comparison - North America
Data Table on Regional Comparison - North America

12.3.1 US - Market size and forecast 2025-2030

Chart on US - Market size and forecast 2025-2030 ($ million)
Data Table on US - Market size and forecast 2025-2030 ($ million)
Chart on US - Year-over-year growth 2025-2030 (%)
Data Table on US - Year-over-year growth 2025-2030 (%)

12.3.2 Canada - Market size and forecast 2025-2030

Chart on Canada - Market size and forecast 2025-2030 ($ million)
Data Table on Canada - Market size and forecast 2025-2030 ($ million)
Chart on Canada - Year-over-year growth 2025-2030 (%)
Data Table on Canada - Year-over-year growth 2025-2030 (%)

12.3.3 Mexico - Market size and forecast 2025-2030

Chart on Mexico - Market size and forecast 2025-2030 ($ million)
Data Table on Mexico - Market size and forecast 2025-2030 ($ million)
Chart on Mexico - Year-over-year growth 2025-2030 (%)
Data Table on Mexico - Year-over-year growth 2025-2030 (%)

12.4 Europe - Market size and forecast 2025-2030

Chart on Europe - Market size and forecast 2025-2030 ($ million)
Data Table on Europe - Market size and forecast 2025-2030 ($ million)
Chart on Europe - Year-over-year growth 2025-2030 (%)
Data Table on Europe - Year-over-year growth 2025-2030 (%)
Chart on Regional Comparison - Europe
Data Table on Regional Comparison - Europe

12.4.1 Germany - Market size and forecast 2025-2030

Chart on Germany - Market size and forecast 2025-2030 ($ million)
Data Table on Germany - Market size and forecast 2025-2030 ($ million)
Chart on Germany - Year-over-year growth 2025-2030 (%)
Data Table on Germany - Year-over-year growth 2025-2030 (%)

12.4.2 UK - Market size and forecast 2025-2030

Chart on UK - Market size and forecast 2025-2030 ($ million)
Data Table on UK - Market size and forecast 2025-2030 ($ million)
Chart on UK - Year-over-year growth 2025-2030 (%)
Data Table on UK - Year-over-year growth 2025-2030 (%)

12.4.3 France - Market size and forecast 2025-2030

Chart on France - Market size and forecast 2025-2030 ($ million)
Data Table on France - Market size and forecast 2025-2030 ($ million)
Chart on France - Year-over-year growth 2025-2030 (%)
Data Table on France - Year-over-year growth 2025-2030 (%)

12.4.4 Italy - Market size and forecast 2025-2030

Chart on Italy - Market size and forecast 2025-2030 ($ million)
Data Table on Italy - Market size and forecast 2025-2030 ($ million)
Chart on Italy - Year-over-year growth 2025-2030 (%)
Data Table on Italy - Year-over-year growth 2025-2030 (%)

12.4.5 Spain - Market size and forecast 2025-2030

Chart on Spain - Market size and forecast 2025-2030 ($ million)
Data Table on Spain - Market size and forecast 2025-2030 ($ million)
Chart on Spain - Year-over-year growth 2025-2030 (%)
Data Table on Spain - Year-over-year growth 2025-2030 (%)

12.4.6 The Netherlands - Market size and forecast 2025-2030

Chart on The Netherlands - Market size and forecast 2025-2030 ($ million)
Data Table on The Netherlands - Market size and forecast 2025-2030 ($ million)
Chart on The Netherlands - Year-over-year growth 2025-2030 (%)
Data Table on The Netherlands - Year-over-year growth 2025-2030 (%)

12.5 APAC - Market size and forecast 2025-2030

Chart on APAC - Market size and forecast 2025-2030 ($ million)
Data Table on APAC - Market size and forecast 2025-2030 ($ million)
Chart on APAC - Year-over-year growth 2025-2030 (%)
Data Table on APAC - Year-over-year growth 2025-2030 (%)
Chart on Regional Comparison - APAC
Data Table on Regional Comparison - APAC

12.5.1 China - Market size and forecast 2025-2030

Chart on China - Market size and forecast 2025-2030 ($ million)
Data Table on China - Market size and forecast 2025-2030 ($ million)
Chart on China - Year-over-year growth 2025-2030 (%)
Data Table on China - Year-over-year growth 2025-2030 (%)

12.5.2 Japan - Market size and forecast 2025-2030

Chart on Japan - Market size and forecast 2025-2030 ($ million)
Data Table on Japan - Market size and forecast 2025-2030 ($ million)
Chart on Japan - Year-over-year growth 2025-2030 (%)
Data Table on Japan - Year-over-year growth 2025-2030 (%)

12.5.3 India - Market size and forecast 2025-2030

Chart on India - Market size and forecast 2025-2030 ($ million)
Data Table on India - Market size and forecast 2025-2030 ($ million)
Chart on India - Year-over-year growth 2025-2030 (%)
Data Table on India - Year-over-year growth 2025-2030 (%)

12.5.4 South Korea - Market size and forecast 2025-2030

Chart on South Korea - Market size and forecast 2025-2030 ($ million)
Data Table on South Korea - Market size and forecast 2025-2030 ($ million)
Chart on South Korea - Year-over-year growth 2025-2030 (%)
Data Table on South Korea - Year-over-year growth 2025-2030 (%)

12.5.5 Australia - Market size and forecast 2025-2030

Chart on Australia - Market size and forecast 2025-2030 ($ million)
Data Table on Australia - Market size and forecast 2025-2030 ($ million)
Chart on Australia - Year-over-year growth 2025-2030 (%)
Data Table on Australia - Year-over-year growth 2025-2030 (%)

12.5.6 Indonesia - Market size and forecast 2025-2030

Chart on Indonesia - Market size and forecast 2025-2030 ($ million)
Data Table on Indonesia - Market size and forecast 2025-2030 ($ million)
Chart on Indonesia - Year-over-year growth 2025-2030 (%)
Data Table on Indonesia - Year-over-year growth 2025-2030 (%)

12.6 South America - Market size and forecast 2025-2030

Chart on South America - Market size and forecast 2025-2030 ($ million)
Data Table on South America - Market size and forecast 2025-2030 ($ million)
Chart on South America - Year-over-year growth 2025-2030 (%)
Data Table on South America - Year-over-year growth 2025-2030 (%)
Chart on Regional Comparison - South America
Data Table on Regional Comparison - South America

12.6.1 Brazil - Market size and forecast 2025-2030

Chart on Brazil - Market size and forecast 2025-2030 ($ million)
Data Table on Brazil - Market size and forecast 2025-2030 ($ million)
Chart on Brazil - Year-over-year growth 2025-2030 (%)
Data Table on Brazil - Year-over-year growth 2025-2030 (%)

12.6.2 Argentina - Market size and forecast 2025-2030

Chart on Argentina - Market size and forecast 2025-2030 ($ million)
Data Table on Argentina - Market size and forecast 2025-2030 ($ million)
Chart on Argentina - Year-over-year growth 2025-2030 (%)
Data Table on Argentina - Year-over-year growth 2025-2030 (%)

12.6.3 Colombia - Market size and forecast 2025-2030

Chart on Colombia - Market size and forecast 2025-2030 ($ million)
Data Table on Colombia - Market size and forecast 2025-2030 ($ million)
Chart on Colombia - Year-over-year growth 2025-2030 (%)
Data Table on Colombia - Year-over-year growth 2025-2030 (%)

12.7 Middle East and Africa - Market size and forecast 2025-2030

Chart on Middle East and Africa - Market size and forecast 2025-2030 ($ million)
Data Table on Middle East and Africa - Market size and forecast 2025-2030 ($ million)
Chart on Middle East and Africa - Year-over-year growth 2025-2030 (%)
Data Table on Middle East and Africa - Year-over-year growth 2025-2030 (%)
Chart on Regional Comparison - Middle East and Africa
Data Table on Regional Comparison - Middle East and Africa

12.7.1 Saudi Arabia - Market size and forecast 2025-2030

Chart on Saudi Arabia - Market size and forecast 2025-2030 ($ million)
Data Table on Saudi Arabia - Market size and forecast 2025-2030 ($ million)
Chart on Saudi Arabia - Year-over-year growth 2025-2030 (%)
Data Table on Saudi Arabia - Year-over-year growth 2025-2030 (%)

12.7.2 UAE - Market size and forecast 2025-2030

Chart on UAE - Market size and forecast 2025-2030 ($ million)
Data Table on UAE - Market size and forecast 2025-2030 ($ million)
Chart on UAE - Year-over-year growth 2025-2030 (%)
Data Table on UAE - Year-over-year growth 2025-2030 (%)

12.7.3 Israel - Market size and forecast 2025-2030

Chart on Israel - Market size and forecast 2025-2030 ($ million)
Data Table on Israel - Market size and forecast 2025-2030 ($ million)
Chart on Israel - Year-over-year growth 2025-2030 (%)
Data Table on Israel - Year-over-year growth 2025-2030 (%)

12.7.4 South Africa - Market size and forecast 2025-2030

Chart on South Africa - Market size and forecast 2025-2030 ($ million)
Data Table on South Africa - Market size and forecast 2025-2030 ($ million)
Chart on South Africa - Year-over-year growth 2025-2030 (%)
Data Table on South Africa - Year-over-year growth 2025-2030 (%)

12.7.5 Turkey - Market size and forecast 2025-2030

Chart on Turkey - Market size and forecast 2025-2030 ($ million)
Data Table on Turkey - Market size and forecast 2025-2030 ($ million)
Chart on Turkey - Year-over-year growth 2025-2030 (%)
Data Table on Turkey - Year-over-year growth 2025-2030 (%)

12.8 Market opportunity by geography

Market opportunity by geography ($ million)
Data Tables on Market opportunity by geography ($ million)

13. Drivers, Challenges, and Opportunity

13.1 Market drivers

Growing adoption of personalized nutrition products among athletes
Rising number of mergers and acquisitions among players
Increased spending on healthcare by consumers

13.2 Market challenges

Low penetration in developing regions
Stringent regulations associated with personalized nutrition products
Increasing presence of counterfeit products

13.3 Impact of drivers and challenges

Impact of drivers and challenges in 2025 and 2030

13.4 Market opportunities

DNA-based personalized nutrition gaining traction
High penetration of e-commerce
Robust growth of nutraceutical Industry

14. Competitive Landscape

14.1 Overview

14.2

Overview on criticality of inputs and factors of differentiation

14.3 Landscape disruption

Overview on factors of disruption

14.4 Industry risks

Impact of key risks on business

15. Competitive Analysis

15.1 Companies profiled

Companies covered

15.2 Company ranking index

15.3 Market positioning of companies

Matrix on companies position and classification

15.4 Abbott Laboratories

Abbott Laboratories - Overview
Abbott Laboratories - Business segments
Abbott Laboratories - Key news
Abbott Laboratories - Key offerings
Abbott Laboratories - Segment focus
SWOT

15.5 Amway Corp.

Amway Corp. - Overview
Amway Corp. - Product / Service
Amway Corp. - Key news
Amway Corp. - Key offerings
SWOT

15.6 Archer Daniels Midland Co.

Archer Daniels Midland Co. - Overview
Archer Daniels Midland Co. - Business segments
Archer Daniels Midland Co. - Key news
Archer Daniels Midland Co. - Key offerings
Archer Daniels Midland Co. - Segment focus
SWOT

15.7 Bactolac Pharmaceutical Inc.

Bactolac Pharmaceutical Inc. - Overview
Bactolac Pharmaceutical Inc. - Product / Service
Bactolac Pharmaceutical Inc. - Key offerings
SWOT

15.8 Balchem Inc.

Balchem Inc. - Overview
Balchem Inc. - Business segments
Balchem Inc. - Key offerings
Balchem Inc. - Segment focus
SWOT

15.9 BASF SE

BASF SE - Overview
BASF SE - Business segments
BASF SE - Key news
BASF SE - Key offerings
BASF SE - Segment focus
SWOT

15.10 BIRON HEALTH GROUP

BIRON HEALTH GROUP - Overview
BIRON HEALTH GROUP - Product / Service
BIRON HEALTH GROUP - Key offerings
SWOT

15.11 BlueDot Inc.

BlueDot Inc. - Overview
BlueDot Inc. - Product / Service
BlueDot Inc. - Key offerings
SWOT

15.12 DSM Firmenich AG

DSM Firmenich AG - Overview
DSM Firmenich AG - Business segments
DSM Firmenich AG - Key news
DSM Firmenich AG - Key offerings
DSM Firmenich AG - Segment focus
SWOT

15.13 Fagron NV

Fagron NV - Overview
Fagron NV - Business segments
Fagron NV - Key offerings
Fagron NV - Segment focus
SWOT

15.14 Nestle SA

Nestle SA - Overview
Nestle SA - Business segments
Nestle SA - Key news
Nestle SA - Key offerings
Nestle SA - Segment focus
SWOT

15.15 Nourished Official

Nourished Official - Overview
Nourished Official - Product / Service
Nourished Official - Key offerings
SWOT

15.16 Nutrigenomix Inc.

Nutrigenomix Inc. - Overview
Nutrigenomix Inc. - Product / Service
Nutrigenomix Inc. - Key offerings
SWOT

15.17 Prenetics Global Ltd.

Prenetics Global Ltd. - Overview
Prenetics Global Ltd. - Business segments
Prenetics Global Ltd. - Key offerings
Prenetics Global Ltd. - Segment focus
SWOT

15.18 Segterra Inc.

Segterra Inc. - Overview
Segterra Inc. - Product / Service
Segterra Inc. - Key offerings
SWOT

16. Appendix

16.1 Scope of the report

Market definition
Objectives
Notes and caveats

16.2 Inclusions and exclusions checklist

Inclusions checklist
Exclusions checklist

16.3 Currency conversion rates for US$

16.4 Research methodology

16.5 Data procurement

Information sources

16.6 Data validation

16.7 Validation techniques employed for market sizing

16.8 Data synthesis

16.9 360 degree market analysis

16.10 List of abbreviations

Research Methodology

Technavio presents a detailed picture of the market by way of study, synthesis, and summation of data from multiple sources. The analysts have presented the various facets of the market with a particular focus on identifying the key industry influencers. The data thus presented is comprehensive, reliable, and the result of extensive research, both primary and secondary.

INFORMATION SOURCES

Primary sources

  • Manufacturers and suppliers
  • Channel partners
  • Industry experts
  • Strategic decision makers

Secondary sources

  • Industry journals and periodicals
  • Government data
  • Financial reports of key industry players
  • Historical data
  • Press releases

DATA ANALYSIS

Data Synthesis

  • Collation of data
  • Estimation of key figures
  • Analysis of derived insights

Data Validation

  • Triangulation with data models
  • Reference against proprietary databases
  • Corroboration with industry experts

REPORT WRITING

Qualitative

  • Market drivers
  • Market challenges
  • Market trends
  • Five forces analysis

Quantitative

  • Market size and forecast
  • Market segmentation
  • Geographical insights
  • Competitive landscape

Interested in this report?

Get your sample now to see our research methodology and insights!

Download Now

Frequently Asked Questions

Personalized Nutrition market growth will increase by USD 9936.7 million during 2026-2030 .

The Personalized Nutrition market is expected to grow at a CAGR of 12.1% during 2026-2030 .

Personalized Nutrition market is segmented by Product type (Active measurement, Standard measurement) End-user (Direct to consumer, Fitness centers, Hospital and clinics, Institutions) Age group (Adults, Geriatric, Pediatric)

Abbott Laboratories, Amway Corp., Archer Daniels Midland Co., Bactolac Pharmaceutical Inc., Balchem Inc., BASF SE, BIRON HEALTH GROUP, BlueDot Inc., DSM Firmenich AG, Fagron NV, Nestle SA, Nourished Official, Nutrigenomix Inc., Prenetics Global Ltd., Segterra Inc. are a few of the key vendors in the Personalized Nutrition market.

North America will register the highest growth rate of 38.8% among the other regions. Therefore, the Personalized Nutrition market in North America is expected to garner significant business opportunities for the vendors during the forecast period.

US, Canada, Mexico, Germany, UK, France, Italy, Spain, The Netherlands, China, Japan, India, South Korea, Australia, Indonesia, Brazil, Argentina, Colombia, Saudi Arabia, UAE, Israel, South Africa, Turkey

  • Growing adoption of personalized nutrition products among athletes is the driving factor this market.

The Personalized Nutrition market vendors should focus on grabbing business opportunities from the Product type segment as it accounted for the largest market share in the base year.