Thailand Plastic Market by End-user,Technique and Product - Forecast and Analysis 2024-2028

Thailand Plastic Market by End-user,Technique and Product - Forecast and Analysis 2024-2028

Published: Feb 2024 168 Pages SKU: IRTNTR72048

Market Overview at a Glance

$10.75 B
Market Opportunity
5.18%
CAGR
4.84
YoY growth 2023-2024(%)

Thailand Plastic Market Forecast 2024-2028

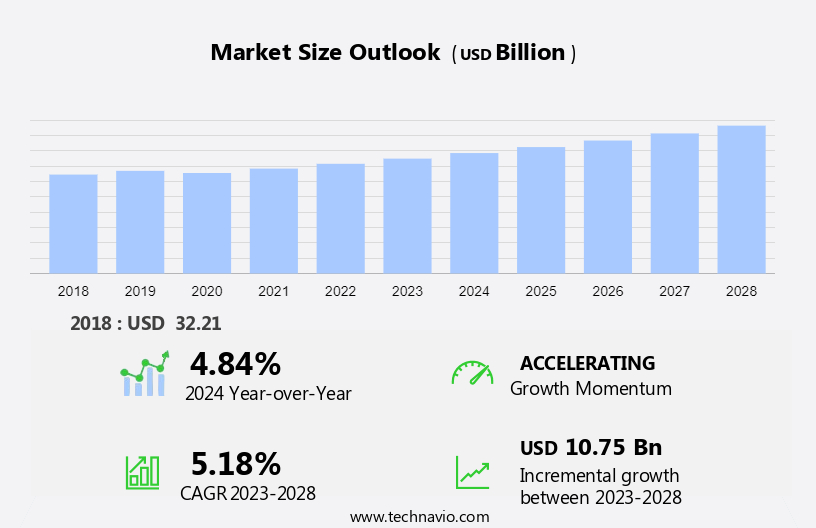
The Thailand Plastic Market size is forecast to increase by USD 10.75 billion, at a CAGR of 5.18% between 2023 and 2028. 

The growth rate of the market depends on several factors, including the ongoing advancements in plastic manufacturing technology, the increased investments, mergers, and acquisitions in the plastic market in Thailand and the innovation in plastic technologies, including lightweight materials and advanced applications. It also includes an in-depth analysis of drivers, trends, and challenges. Our report examines historic data from 2018 - 2022, besides analyzing the current market scenario.

What will be the  Market Size During the Forecast Period?

Plastic Market in Thailand Size

Request Free Sample in PDF

Market Definition 

Plastic is a multipurpose synthetic material made from polymers, which is primarily produced from petrochemical feedstocks such as ethylene. Plastic includes a wide spectrum of polymers with a range of qualities, such as durability, flexibility, and malleability. Plastic, which is widely used in the manufacturing of packaging, construction, consumer goods, and other industries, has become ubiquitous in modern life. Its versatility, low cost, and wide range of applications contribute to its popularity across different industries.

To Know more about the market report  Request Free Sample

Market Key Drivers, Trends, Challenges

Our researchers analyzed the market research and growth data with 2023  as the base year, along with the key market growth analysis, trends, and challenges. A holistic analysis of drivers, trends, and challenges will help companies refine their marketing strategies to gain a competitive advantage. 

Key Market Growth Analysis Driver

Ongoing advancements in plastic manufacturing technology drive market growth. The continuous developments in plastic production technology, especially the creation of biodegradable plastics and the introduction of innovative recycling processes such as chemical recycling, are a crucial driving force behind the growth of the market in Thailand. In addition, these technological advances are critical in resolving the environmental challenges surrounding the disposal of plastic waste.

Moreover, biodegradable polymers, which degrade naturally, provide a sustainable alternative to traditional non-biodegradable plastics, which ultimately reduces the long-term impact of plastic waste on the environment. In addition, this is consistent with the global trend toward the use of eco-friendly materials, reflecting shifting consumer tastes and rigorous environmental legislation across the world. Therefore, it is positively impacting the  market in Thailand. Hence, such factors are driving the market growth during the forecast period.

Significant  Market Trends and Analysis

Increasing adoption of circular economy practices is an emerging trend in the market. The growing adoption of circular economy practices is becoming a noticeable trend in the regional, signifying a shift toward sustainability. In addition, this trend is distinguished by the use of closed-loop recycling systems and a dedication to sustainable sourcing throughout the entire plastic manufacturing process.

Moreover, plastics manufacturers in Thailand are increasingly focused on building a circular economy in which plastic materials are recycled, repurposed, and reused to reduce the volume of plastic waste disposed of in landfills and their environmental effects. Furthermore, there is a growing emphasis on sustainable sourcing, including the use of eco-friendly raw materials and responsible buying processes. Therefore, it is positively impacting the market in Thailand. Hence, such factors are driving the market growth during the forecast period.

Major Challenge

Volatility in prices of raw materials used in plastic production is hindering the market growth. Ethylene, propylene, benzene, and styrene are some of the main raw materials used for the production of plastics. In addition, the oil and gas industry is one of the major suppliers of these raw materials. Furthermore, fluctuations in global crude oil prices adversely affect the prices of fractional petroleum products, which, in turn, affects the production cost of injection molded and other types of plastics.

For example, in February 2022, the global price of ethylene was USD700-USD800 per metric ton. Moreover, frequent fluctuations in global crude oil prices impact the price of raw materials significantly, including polyethylene and propylene, which are used in manufacturing plastics. Therefore, the regional market depends heavily on crude oil derivatives, whose prices may fluctuate widely. Thus, such factors are hindering the market growth during the forecast period.

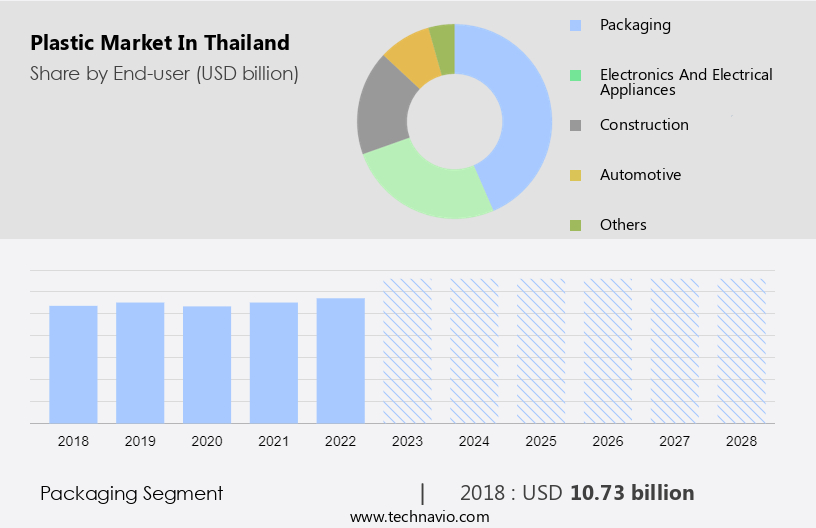
Segmentation by End-user, Technique, and Product

End-user Analysis 

The packaging segment is estimated to witness significant growth during the forecast period. The rise of this segment has been spurred by the rising demand for packaged goods, which, in turn, is being driven by urbanization, population growth, and changing consumer lifestyles. In addition, the food and beverage industry, in particular, has seen an increase in demand for plastic packaging due to its low cost, lightweight nature, and ability to extend the shelf life of products.

Plastic Market in Thailand Size

Get a glance at the market contribution of the End User  segment Request Free Sample

The packaging segment was the largest segment and was valued at USD 10.73 billion in 2018. Moreover, the boom in the e-commerce industry has boosted the growth of the packaging industry, with an increase in online retail resulting in a greater demand for safe and long-lasting packaging materials. In addition, as more consumers prefer the convenience of online purchasing, the need for plastic packaging solutions has risen dramatically. Furthermore, due to its convenience and economic advantages, plastic packaging provides improved product protection and enables more efficient transportation. In addition, manufacturers of different products are also using inventive packaging designs to entice customers and differentiate their products in a highly competitive market. Hence, such factors are fuelling the growth of this segment which in turn drives the market growth during the forecast period.

Technique Analysis 

Based on the technique, the market has been segmented into injection molding, blow molding, roto molding, casting, and others. The injection molding segment will account for the largest share of this segment. In Thailand, injection molding has developed as the major technique segment within the nation's plastic market, resulting in significant growth of the regional market. In addition, the market situation is characterized by increased demand for precision-engineered plastic components in a variety of end-user industries, including automotive, electronics, and packaging. Furthermore, injection molding is becoming increasingly popular among manufacturers in these industries because of its low cost, high efficiency in terms of the process, and ability to mold plastics into complex shapes and sizes Hence, such factors are fuelling the growth of this segment which in turn drives the market growth during the forecast period.

Key Companies

Companies are implementing various market growth and forecasting strategies by analyzing factors such as strategic alliances, partnerships, mergers and acquisitions, geographical expansion, and product or service launches, to enhance their presence in the market.

Arkema Group: The company offers LED lighting such as Bajaj Ivora 10-Watt LED Bulkhead Ceiling Light, Bajaj LED Deco Ping Pong 0.5W, Bajaj Ivora Plus LED Panel 12W SQR CDL.

The report also includes detailed analyses of the competitive landscape of the market and information about 15 market companies, including: 

3M Co., BASF SE, Berry Global Inc., Celanese Corp., Covestro AG, Dow Chemical Co., Eastman Chemical Co., EcoBlue Ltd., Formosa Plastics Corp., HMC Polymers Co. Ltd., Huhtamaki Oyj, INEOS Group Holdings SA, Kama Holdings Ltd., MITSUI and CO. LTD., Polyplex Corp. Ltd., PTT Public Co. Ltd., Siam Cement PCL, Thai Plastic Industries Co. Ltd., and Toray Industries Inc.

Qualitative and quantitative analysis of companies has been conducted to help clients understand the wider business environment as well as the strengths and weaknesses of key market players. Data is qualitatively analyzed to categorize companies as pure play, category-focused, industry-focused, and diversified; it is quantitatively analyzed to categorize companies as dominant, leading, strong, tentative, and weak.

Segment Overview

The market report predicts market growth by revenue and provides an analysis of the latest trends and growth opportunities from 2018 to 2028. 

  •  End-user Outlook 
    • Packaging
    • Electronics and electrical appliances
    • Construction
    • Automotive
    • Others
  • Technique Outlook
    • Injection molding
    • Blow molding
    • Roto molding
    • Casting
    • Others

Market Analyst Overview

The market plays a pivotal role in diverse sectors like supply chain, industrial activities, building and construction, and food and beverage packaging. Despite government regulations and plastic bans, the market witnesses a shift towards biodegradable plastics and the use of Polyethylene Terephthalate (PET) in various applications. PET resins with specific melt flow characteristics enhance molding tolerances and productivity, making them ideal for electrical applications such as motor housings, switches, and sensors. Polyolefins contribute to the plastic packaging industry, offering recyclability, strength, and versatility.

Moreover, in the food industry, PET is extensively used for containers, including takeout containers, frozen foods, carbonated drinks, juices, ketchup, bottled water, jars, baked goods containers, clamshells, deli containers, and microwave food trays. The market's focus on barrier properties and recycling operations attracts green-minded beverage producers, fostering the integration of recycled materials and enhancing recycling capacity in Thailand's plastic industry.

Thailand Plastic Market Scope

Report Coverage

Details

Page number

168

Base year

2023

Historic period

2018-2022

Forecast period

2024-2028

Growth momentum & CAGR

Accelerate at a CAGR of 5.18%

Market Growth 2024-2028

USD 10.75 billion

Market structure

Fragmented

YoY growth 2023-2024(%)

4.84

Competitive landscape

Leading Companies, Market Positioning of Companies, Competitive Strategies, and Industry Risks

Key companies profiled

3M Co., Arkema Group, BASF SE, Berry Global Inc., Celanese Corp., Covestro AG, Dow Chemical Co., Eastman Chemical Co., EcoBlue Ltd., Formosa Plastics Corp., HMC Polymers Co. Ltd., Huhtamaki Oyj, INEOS Group Holdings SA, Kama Holdings Ltd., MITSUI and CO. LTD., Polyplex Corp. Ltd., PTT Public Co. Ltd., Siam Cement PCL, Thai Plastic Industries Co. Ltd., and Toray Industries Inc.

Market dynamics

Parent market analysis, Market forecasting, Market growth inducers and obstacles, Fast-growing and slow-growing segment analysis, COVID-19 impact and recovery analysis and future consumer dynamics, Market condition analysis for the forecast period

Customization purview

If our report has not included the data that you are looking for, you can reach out to our analysts and get segments customized.

Request Free Sample

What are the Key Data Covered in this Market Research Report?

  • CAGR of the market forecast during the forecast period
  • Detailed information on factors that will drive the growth of the market  between 2023 and 2028
  • Precise estimation of the market size and its contribution to the market in focus on the parent market
  • Accurate predictions about upcoming trends and changes in consumer behavior
  • Growth of the market across Thailand
  • Thorough market analysis and report of the market’s competitive landscape and detailed information about companies
  • Comprehensive analysis of factors that will challenge the growth of market companies

We can help! Our analysts can customize this market research report to meet your requirements. Get in touch

1 Executive Summary

  • 1.1 Market overview
    • Exhibit 01: Executive Summary – Chart on Market Overview
    • Exhibit 02: Executive Summary – Data Table on Market Overview
    • Exhibit 03: Executive Summary – Chart on Country Market Characteristics
    • Exhibit 04: Executive Summary – Chart on Market Segmentation by End-user
    • Exhibit 05: Executive Summary – Chart on Market Segmentation by Technique
    • Exhibit 06: Executive Summary – Chart on Market Segmentation by Product
    • Exhibit 07: Executive Summary – Chart on Vendor Market Positioning

2 Market Landscape

  • 2.1 Market ecosystem
    • Exhibit 08: Parent market
    • Exhibit 09: Market Characteristics

3 Market Sizing

  • 3.1 Market definition
    • Exhibit 10: Offerings of vendors included in the market definition
  • 3.2 Market segment analysis
    • Exhibit 11: Market segments
  • 3.3 Market size 2023
    • 3.4 Market outlook: Forecast for 2023-2028
      • Exhibit 12: Chart on Thailand - Market size and forecast 2023-2028 ($ billion)
      • Exhibit 13: Data Table on Thailand - Market size and forecast 2023-2028 ($ billion)
      • Exhibit 14: Chart on Thailand: Year-over-year growth 2023-2028 (%)
      • Exhibit 15: Data Table on Thailand: Year-over-year growth 2023-2028 (%)

    4 Historic Market Size

    • 4.1 Plastic market in Thailand 2018 - 2022
      • Exhibit 16: Historic Market Size – Data Table on plastic market in Thailand 2018 - 2022 ($ billion)
    • 4.2 End-user Segment Analysis 2018 - 2022
      • Exhibit 17: Historic Market Size – End-user Segment 2018 - 2022 ($ billion)
    • 4.3 Technique Segment Analysis 2018 - 2022
      • Exhibit 18: Historic Market Size – Technique Segment 2018 - 2022 ($ billion)
    • 4.4 Product Segment Analysis 2018 - 2022
      • Exhibit 19: Historic Market Size – Product Segment 2018 - 2022 ($ billion)

    5 Five Forces Analysis

    • 5.1 Five forces summary
      • Exhibit 20: Five forces analysis - Comparison between 2023 and 2028
    • 5.2 Bargaining power of buyers
      • Exhibit 21: Chart on Bargaining power of buyers – Impact of key factors 2023 and 2028
    • 5.3 Bargaining power of suppliers
      • Exhibit 22: Bargaining power of suppliers – Impact of key factors in 2023 and 2028
    • 5.4 Threat of new entrants
      • Exhibit 23: Threat of new entrants – Impact of key factors in 2023 and 2028
    • 5.5 Threat of substitutes
      • Exhibit 24: Threat of substitutes – Impact of key factors in 2023 and 2028
    • 5.6 Threat of rivalry
      • Exhibit 25: Threat of rivalry – Impact of key factors in 2023 and 2028
    • 5.7 Market condition
      • Exhibit 26: Chart on Market condition - Five forces 2023 and 2028

    6 Market Segmentation by End-user

    • 6.1 Market segments
      • Exhibit 27: Chart on End-user - Market share 2023-2028 (%)
      • Exhibit 28: Data Table on End-user - Market share 2023-2028 (%)
    • 6.2 Comparison by End-user
      • Exhibit 29: Chart on Comparison by End-user
      • Exhibit 30: Data Table on Comparison by End-user
    • 6.3 Packaging - Market size and forecast 2023-2028
      • Exhibit 31: Chart on Packaging - Market size and forecast 2023-2028 ($ billion)
      • Exhibit 32: Data Table on Packaging - Market size and forecast 2023-2028 ($ billion)
      • Exhibit 33: Chart on Packaging - Year-over-year growth 2023-2028 (%)
      • Exhibit 34: Data Table on Packaging - Year-over-year growth 2023-2028 (%)
    • 6.4 Electronics and electrical appliances - Market size and forecast 2023-2028
      • Exhibit 35: Chart on Electronics and electrical appliances - Market size and forecast 2023-2028 ($ billion)
      • Exhibit 36: Data Table on Electronics and electrical appliances - Market size and forecast 2023-2028 ($ billion)
      • Exhibit 37: Chart on Electronics and electrical appliances - Year-over-year growth 2023-2028 (%)
      • Exhibit 38: Data Table on Electronics and electrical appliances - Year-over-year growth 2023-2028 (%)
    • 6.5 Construction - Market size and forecast 2023-2028
      • Exhibit 39: Chart on Construction - Market size and forecast 2023-2028 ($ billion)
      • Exhibit 40: Data Table on Construction - Market size and forecast 2023-2028 ($ billion)
      • Exhibit 41: Chart on Construction - Year-over-year growth 2023-2028 (%)
      • Exhibit 42: Data Table on Construction - Year-over-year growth 2023-2028 (%)
    • 6.6 Automotive - Market size and forecast 2023-2028
      • Exhibit 43: Chart on Automotive - Market size and forecast 2023-2028 ($ billion)
      • Exhibit 44: Data Table on Automotive - Market size and forecast 2023-2028 ($ billion)
      • Exhibit 45: Chart on Automotive - Year-over-year growth 2023-2028 (%)
      • Exhibit 46: Data Table on Automotive - Year-over-year growth 2023-2028 (%)
    • 6.7 Others - Market size and forecast 2023-2028
      • Exhibit 47: Chart on Others - Market size and forecast 2023-2028 ($ billion)
      • Exhibit 48: Data Table on Others - Market size and forecast 2023-2028 ($ billion)
      • Exhibit 49: Chart on Others - Year-over-year growth 2023-2028 (%)
      • Exhibit 50: Data Table on Others - Year-over-year growth 2023-2028 (%)
    • 6.8 Market opportunity by End-user
      • Exhibit 51: Market opportunity by End-user ($ billion)
      • Exhibit 52: Data Table on Market opportunity by End-user ($ billion)

    7 Market Segmentation by Technique

    • 7.1 Market segments
      • Exhibit 53: Chart on Technique - Market share 2023-2028 (%)
      • Exhibit 54: Data Table on Technique - Market share 2023-2028 (%)
    • 7.2 Comparison by Technique
      • Exhibit 55: Chart on Comparison by Technique
      • Exhibit 56: Data Table on Comparison by Technique
    • 7.3 Injection molding - Market size and forecast 2023-2028
      • Exhibit 57: Chart on Injection molding - Market size and forecast 2023-2028 ($ billion)
      • Exhibit 58: Data Table on Injection molding - Market size and forecast 2023-2028 ($ billion)
      • Exhibit 59: Chart on Injection molding - Year-over-year growth 2023-2028 (%)
      • Exhibit 60: Data Table on Injection molding - Year-over-year growth 2023-2028 (%)
    • 7.4 Blow molding - Market size and forecast 2023-2028
      • Exhibit 61: Chart on Blow molding - Market size and forecast 2023-2028 ($ billion)
      • Exhibit 62: Data Table on Blow molding - Market size and forecast 2023-2028 ($ billion)
      • Exhibit 63: Chart on Blow molding - Year-over-year growth 2023-2028 (%)
      • Exhibit 64: Data Table on Blow molding - Year-over-year growth 2023-2028 (%)
    • 7.5 Roto molding - Market size and forecast 2023-2028
      • Exhibit 65: Chart on Roto molding - Market size and forecast 2023-2028 ($ billion)
      • Exhibit 66: Data Table on Roto molding - Market size and forecast 2023-2028 ($ billion)
      • Exhibit 67: Chart on Roto molding - Year-over-year growth 2023-2028 (%)
      • Exhibit 68: Data Table on Roto molding - Year-over-year growth 2023-2028 (%)
    • 7.6 Casting - Market size and forecast 2023-2028
      • Exhibit 69: Chart on Casting - Market size and forecast 2023-2028 ($ billion)
      • Exhibit 70: Data Table on Casting - Market size and forecast 2023-2028 ($ billion)
      • Exhibit 71: Chart on Casting - Year-over-year growth 2023-2028 (%)
      • Exhibit 72: Data Table on Casting - Year-over-year growth 2023-2028 (%)
    • 7.7 Others - Market size and forecast 2023-2028
      • Exhibit 73: Chart on Others - Market size and forecast 2023-2028 ($ billion)
      • Exhibit 74: Data Table on Others - Market size and forecast 2023-2028 ($ billion)
      • Exhibit 75: Chart on Others - Year-over-year growth 2023-2028 (%)
      • Exhibit 76: Data Table on Others - Year-over-year growth 2023-2028 (%)
    • 7.8 Market opportunity by Technique
      • Exhibit 77: Market opportunity by Technique ($ billion)
      • Exhibit 78: Data Table on Market opportunity by Technique ($ billion)

    8 Market Segmentation by Product

    • 8.1 Market segments
      • Exhibit 79: Chart on Product - Market share 2023-2028 (%)
      • Exhibit 80: Data Table on Product - Market share 2023-2028 (%)
    • 8.2 Comparison by Product
      • Exhibit 81: Chart on Comparison by Product
      • Exhibit 82: Data Table on Comparison by Product
    • 8.3 Polyethylene (PE) - Market size and forecast 2023-2028
      • Exhibit 83: Chart on Polyethylene (PE) - Market size and forecast 2023-2028 ($ billion)
      • Exhibit 84: Data Table on Polyethylene (PE) - Market size and forecast 2023-2028 ($ billion)
      • Exhibit 85: Chart on Polyethylene (PE) - Year-over-year growth 2023-2028 (%)
      • Exhibit 86: Data Table on Polyethylene (PE) - Year-over-year growth 2023-2028 (%)
    • 8.4 Polypropylene (PP) - Market size and forecast 2023-2028
      • Exhibit 87: Chart on Polypropylene (PP) - Market size and forecast 2023-2028 ($ billion)
      • Exhibit 88: Data Table on Polypropylene (PP) - Market size and forecast 2023-2028 ($ billion)
      • Exhibit 89: Chart on Polypropylene (PP) - Year-over-year growth 2023-2028 (%)
      • Exhibit 90: Data Table on Polypropylene (PP) - Year-over-year growth 2023-2028 (%)
    • 8.5 Polyurethane (PU) - Market size and forecast 2023-2028
      • Exhibit 91: Chart on Polyurethane (PU) - Market size and forecast 2023-2028 ($ billion)
      • Exhibit 92: Data Table on Polyurethane (PU) - Market size and forecast 2023-2028 ($ billion)
      • Exhibit 93: Chart on Polyurethane (PU) - Year-over-year growth 2023-2028 (%)
      • Exhibit 94: Data Table on Polyurethane (PU) - Year-over-year growth 2023-2028 (%)
    • 8.6 Polyvinyl Chloride (PVC) - Market size and forecast 2023-2028
      • Exhibit 95: Chart on Polyvinyl Chloride (PVC) - Market size and forecast 2023-2028 ($ billion)
      • Exhibit 96: Data Table on Polyvinyl Chloride (PVC) - Market size and forecast 2023-2028 ($ billion)
      • Exhibit 97: Chart on Polyvinyl Chloride (PVC) - Year-over-year growth 2023-2028 (%)
      • Exhibit 98: Data Table on Polyvinyl Chloride (PVC) - Year-over-year growth 2023-2028 (%)
    • 8.7 Others - Market size and forecast 2023-2028
      • Exhibit 99: Chart on Others - Market size and forecast 2023-2028 ($ billion)
      • Exhibit 100: Data Table on Others - Market size and forecast 2023-2028 ($ billion)
      • Exhibit 101: Chart on Others - Year-over-year growth 2023-2028 (%)
      • Exhibit 102: Data Table on Others - Year-over-year growth 2023-2028 (%)
    • 8.8 Market opportunity by Product
      • Exhibit 103: Market opportunity by Product ($ billion)
      • Exhibit 104: Data Table on Market opportunity by Product ($ billion)

    9 Customer Landscape

    • 9.1 Customer landscape overview
      • Exhibit 105: Analysis of price sensitivity, lifecycle, customer purchase basket, adoption rates, and purchase criteria

    10 Drivers, Challenges, and Trends

    • 10.1 Market drivers
      • 10.2 Market challenges
        • 10.3 Impact of drivers and challenges
          • Exhibit 106: Impact of drivers and challenges in 2023 and 2028
        • 10.4 Market trends

          11 Vendor Landscape

          • 11.1 Overview
            • 11.2 Vendor landscape
              • Exhibit 107: Overview on Criticality of inputs and Factors of differentiation
            • 11.3 Landscape disruption
              • Exhibit 108: Overview on factors of disruption
            • 11.4 Industry risks
              • Exhibit 109: Impact of key risks on business

            12 Vendor Analysis

            • 12.1 Vendors covered
              • Exhibit 110: Vendors covered
            • 12.2 Market positioning of vendors
              • Exhibit 111: Matrix on vendor position and classification
            • 12.3 3M Co.
              • Exhibit 112: 3M Co. - Overview
              • Exhibit 113: 3M Co. - Business segments
              • Exhibit 114: 3M Co. - Key news
              • Exhibit 115: 3M Co. - Key offerings
              • Exhibit 116: 3M Co. - Segment focus
            • 12.4 Arkema Group
              • Exhibit 117: Arkema Group - Overview
              • Exhibit 118: Arkema Group - Business segments
              • Exhibit 119: Arkema Group - Key news
              • Exhibit 120: Arkema Group - Key offerings
              • Exhibit 121: Arkema Group - Segment focus
            • 12.5 BASF SE
              • Exhibit 122: BASF SE - Overview
              • Exhibit 123: BASF SE - Business segments
              • Exhibit 124: BASF SE - Key news
              • Exhibit 125: BASF SE - Key offerings
              • Exhibit 126: BASF SE - Segment focus
            • 12.6 Berry Global Inc.
              • Exhibit 127: Berry Global Inc. - Overview
              • Exhibit 128: Berry Global Inc. - Business segments
              • Exhibit 129: Berry Global Inc. - Key news
              • Exhibit 130: Berry Global Inc. - Key offerings
              • Exhibit 131: Berry Global Inc. - Segment focus
            • 12.7 Celanese Corp.
              • Exhibit 132: Celanese Corp. - Overview
              • Exhibit 133: Celanese Corp. - Business segments
              • Exhibit 134: Celanese Corp. - Key offerings
              • Exhibit 135: Celanese Corp. - Segment focus
            • 12.8 Covestro AG
              • Exhibit 136: Covestro AG - Overview
              • Exhibit 137: Covestro AG - Business segments
              • Exhibit 138: Covestro AG - Key news
              • Exhibit 139: Covestro AG - Key offerings
              • Exhibit 140: Covestro AG - Segment focus
            • 12.9 Dow Chemical Co.
              • Exhibit 141: Dow Chemical Co. - Overview
              • Exhibit 142: Dow Chemical Co. - Business segments
              • Exhibit 143: Dow Chemical Co. - Key news
              • Exhibit 144: Dow Chemical Co. - Key offerings
              • Exhibit 145: Dow Chemical Co. - Segment focus
            • 12.10 Eastman Chemical Co.
              • Exhibit 146: Eastman Chemical Co. - Overview
              • Exhibit 147: Eastman Chemical Co. - Business segments
              • Exhibit 148: Eastman Chemical Co. - Key offerings
              • Exhibit 149: Eastman Chemical Co. - Segment focus
            • 12.11 Formosa Plastics Corp.
              • Exhibit 150: Formosa Plastics Corp. - Overview
              • Exhibit 151: Formosa Plastics Corp. - Product / Service
              • Exhibit 152: Formosa Plastics Corp. - Key offerings
            • 12.12 Huhtamaki Oyj
              • Exhibit 153: Huhtamaki Oyj - Overview
              • Exhibit 154: Huhtamaki Oyj - Business segments
              • Exhibit 155: Huhtamaki Oyj - Key news
              • Exhibit 156: Huhtamaki Oyj - Key offerings
              • Exhibit 157: Huhtamaki Oyj - Segment focus
            • 12.13 Kama Holdings Ltd.
              • Exhibit 158: Kama Holdings Ltd. - Overview
              • Exhibit 159: Kama Holdings Ltd. - Business segments
              • Exhibit 160: Kama Holdings Ltd. - Key offerings
              • Exhibit 161: Kama Holdings Ltd. - Segment focus
            • 12.14 MITSUI and CO. LTD.
              • Exhibit 162: MITSUI and CO. LTD. - Overview
              • Exhibit 163: MITSUI and CO. LTD. - Business segments
              • Exhibit 164: MITSUI and CO. LTD. - Key offerings
              • Exhibit 165: MITSUI and CO. LTD. - Segment focus
            • 12.15 PTT Public Co. Ltd.
              • Exhibit 166: PTT Public Co. Ltd. - Overview
              • Exhibit 167: PTT Public Co. Ltd. - Business segments
              • Exhibit 168: PTT Public Co. Ltd. - Key offerings
              • Exhibit 169: PTT Public Co. Ltd. - Segment focus
            • 12.16 Thai Plastic Industries Co. Ltd.
              • Exhibit 170: Thai Plastic Industries Co. Ltd. - Overview
              • Exhibit 171: Thai Plastic Industries Co. Ltd. - Product / Service
              • Exhibit 172: Thai Plastic Industries Co. Ltd. - Key offerings
            • 12.17 Toray Industries Inc.
              • Exhibit 173: Toray Industries Inc. - Overview
              • Exhibit 174: Toray Industries Inc. - Business segments
              • Exhibit 175: Toray Industries Inc. - Key offerings
              • Exhibit 176: Toray Industries Inc. - Segment focus

            13 Appendix

            • 13.1 Scope of the report
              • 13.2 Inclusions and exclusions checklist
                • Exhibit 177: Inclusions checklist
                • Exhibit 178: Exclusions checklist
              • 13.3 Currency conversion rates for US$
                • Exhibit 179: Currency conversion rates for US$
              • 13.4 Research methodology
                • Exhibit 180: Research methodology
                • Exhibit 181: Validation techniques employed for market sizing
                • Exhibit 182: Information sources
              • 13.5 List of abbreviations
                • Exhibit 183: List of abbreviations

              Research Methodology

              Technavio presents a detailed picture of the market by way of study, synthesis, and summation of data from multiple sources. The analysts have presented the various facets of the market with a particular focus on identifying the key industry influencers. The data thus presented is comprehensive, reliable, and the result of extensive research, both primary and secondary.

              INFORMATION SOURCES

              Primary sources

              • Manufacturers and suppliers
              • Channel partners
              • Industry experts
              • Strategic decision makers

              Secondary sources

              • Industry journals and periodicals
              • Government data
              • Financial reports of key industry players
              • Historical data
              • Press releases

              DATA ANALYSIS

              Data Synthesis

              • Collation of data
              • Estimation of key figures
              • Analysis of derived insights

              Data Validation

              • Triangulation with data models
              • Reference against proprietary databases
              • Corroboration with industry experts

              REPORT WRITING

              Qualitative

              • Market drivers
              • Market challenges
              • Market trends
              • Five forces analysis

              Quantitative

              • Market size and forecast
              • Market segmentation
              • Geographical insights
              • Competitive landscape

              Interested in this report?

              Get your sample now to see our research methodology and insights!

              Download Now

              Frequently Asked Questions

              Plasticin Thailand market growth will increase by $ 10.75 bn during 2024-2028 .

              The Plasticin Thailand market is expected to grow at a CAGR of 5.18% during 2024-2028 .

              Plasticin Thailand market is segmented by End-user( Packaging, Electronics and electrical appliances, Construction, Automotive, Others) Technique( Injection molding, Blow molding, Roto molding, Casting, Others) Product( Polyethylene (PE), Polypropylene (PP), Polyurethane (PU), Polyvinyl Chloride (PVC), Others)

              3M Co., Arkema Group, BASF SE, Berry Global Inc., Celanese Corp., Covestro AG, Dow Chemical Co., Eastman Chemical Co., EcoBlue Ltd., Formosa Plastics Corp., HMC Polymers Co. Ltd., Huhtamaki Oyj, INEOS Group Holdings SA, Kama Holdings Ltd., MITSUI and CO. LTD., Polyplex Corp. Ltd., PTT Public Co. Ltd., Siam Cement PCL, Thai Plastic Industries Co. Ltd., Toray Industries Inc. are a few of the key vendors in the Plasticin Thailand market.

              APAC will register the highest growth rate of 100% among the other regions. Therefore, the Plasticin Thailand market in APAC is expected to garner significant business opportunities for the vendors during the forecast period.

              Thailand, APAC

              • Ongoing advancements in plastic manufacturing technologyThe continuous developments in plastic manufacturing technology is the driving factor this market.
              • particularly the creation of biodegradable plastics and the introduction of innovative recycling processes such as chemical recycling is the driving factor this market.
              • are a crucial driving force behind the growth of the plastic market in Thailand. These technological advances are critical in resolving the environmental challenges surrounding the disposal of plastic waste. Biodegradable polymers is the driving factor this market.
              • which degrade naturally is the driving factor this market.
              • provide a sustainable alternative to traditional non-biodegradable plastics is the driving factor this market.
              • which ultimately reduces the long-term impact of plastic waste on the environment. This is consistent with the global trend toward the use of eco-friendly materials is the driving factor this market.
              • reflecting shifting consumer tastes and rigorous environmental legislation across the world. Furthermore is the driving factor this market.
              • modern recycling technologies are helping create a more circular economy by reusing and repurposing plastic resources effectively. As sustainability becomes a priority globally is the driving factor this market.
              • plastic manufacturers in Thailand are utilizing technological developments to align with international standards and meet the growing need for ecologically responsible operations. The implementation of such advanced technologies strengthens the plastics industry's resilience is the driving factor this market.
              • competitiveness is the driving factor this market.
              • and social responsibility is the driving factor this market.
              • establishing Thailand as a forward-thinking leader in the global plastic market is the driving factor this market.
              • committed to reducing the environmental consequences of plastic production and use. Owing to such factors is the driving factor this market.
              • the plastic market in Thailand is expected to grow during the forecast period. is the driving factor this market.

              The Plasticin Thailand market vendors should focus on grabbing business opportunities from the Packaging segment as it accounted for the largest market share in the base year.