Plasticizer Alcohols Market Analysis, Size, and Forecast 2026-2030: APAC (China, India, and Japan), North America (US, Canada, and Mexico), Europe (Germany, UK, and France), South America (Brazil and Argentina), Middle East and Africa (Saudi Arabia, UAE, and South Africa), and Rest of World (ROW)

Plasticizer Alcohols Market Analysis, Size, and Forecast 2026-2030:
APAC (China, India, and Japan), North America (US, Canada, and Mexico), Europe (Germany, UK, and France), South America (Brazil and Argentina), Middle East and Africa (Saudi Arabia, UAE, and South Africa), and Rest of World (ROW)

Published: Dec 2025 311 Pages SKU: IRTNTR80094

Market Overview at a Glance

$5.65 B
Market Opportunity
9.7%
CAGR 2025 - 2030
38.8%
APAC Growth
$3.83 B
2-Ethylhexanol segment 2024

Plasticizer Alcohols Market Size 2026-2030

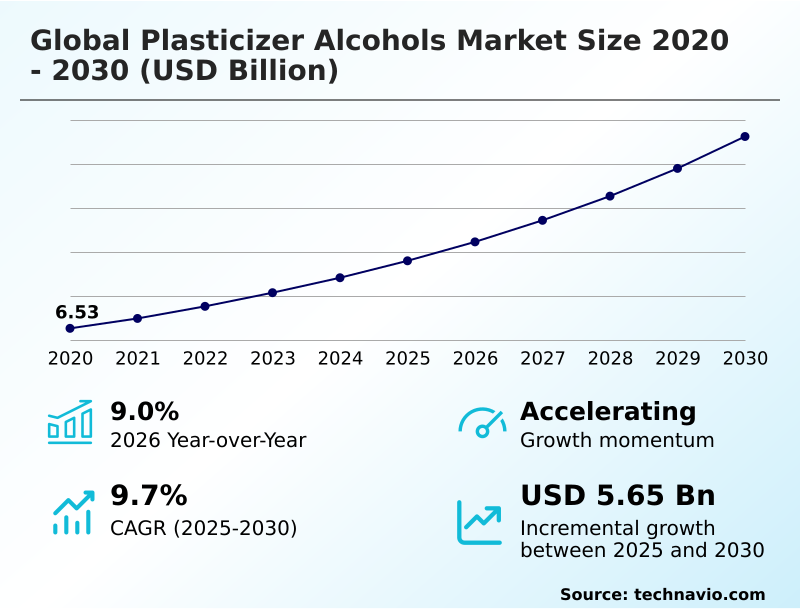
The plasticizer alcohols market size is valued to increase by USD 5.65 billion, at a CAGR of 9.7% from 2025 to 2030. Rapid expansion of infrastructure and construction activities in emerging economies will drive the plasticizer alcohols market.

Major Market Trends & Insights

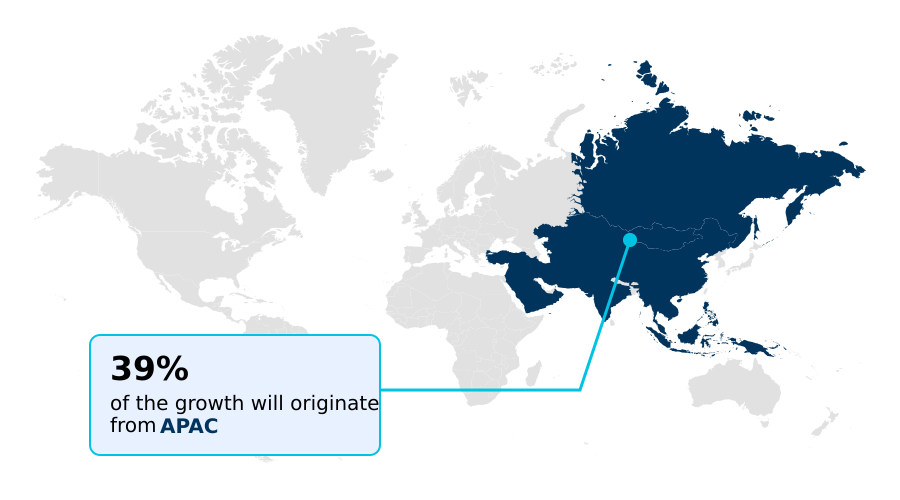
  • APAC dominated the market and accounted for a 38.8% growth during the forecast period.
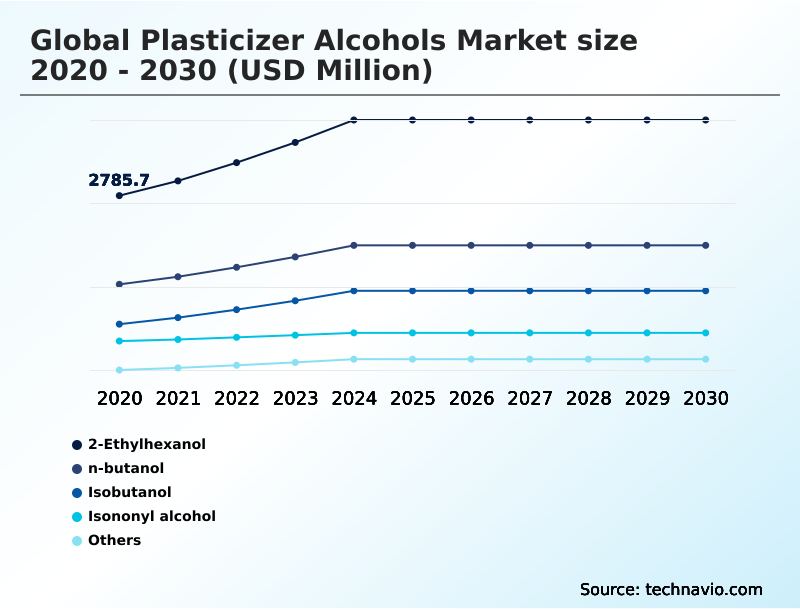
  • By Product - 2-Ethylhexanol segment was valued at USD 3.83 billion in 2024
  • By End-user - Automotive segment accounted for the largest market revenue share in 2024

Market Size & Forecast

  • Market Opportunities: USD 8.72 billion
  • Market Future Opportunities: USD 5.65 billion
  • CAGR from 2025 to 2030 : 9.7%

Market Summary

  • The plasticizer alcohols market is foundational to the performance of modern polymers, primarily serving to impart flexibility and durability. Demand is fundamentally tied to the health of the global construction and automotive sectors, which rely on plasticized materials for applications ranging from electrical insulation and flooring to vehicle interiors.
  • A significant market driver involves the continuous infrastructure development in emerging economies, creating sustained consumption. Concurrently, the industry is navigating a pivotal trend toward sustainability, with a marked shift away from traditional chemicals to non-phthalate and bio-based alternatives. This transition is propelled by stringent international regulations and growing consumer awareness.
  • However, this evolution introduces challenges; for instance, a chemical manufacturer aiming to align with new environmental standards must manage the operational complexities and costs of reformulating its product lines.
  • This often involves significant investment in R&D and plant retrofitting to handle different feedstocks, all while contending with the inherent volatility of raw material pricing, which can impact profitability and supply chain stability.

What will be the Size of the Plasticizer Alcohols Market during the forecast period?

Get Key Insights on Market Forecast (PDF) Request Free Sample

How is the Plasticizer Alcohols Market Segmented?

The plasticizer alcohols industry research report provides comprehensive data (region-wise segment analysis), with forecasts and estimates in "USD million" for the period 2026-2030, as well as historical data from 2020-2024 for the following segments.

  • Product
    • 2-Ethylhexanol
    • n-butanol
    • Isobutanol
    • Isononyl alcohol
    • Others
  • End-user
    • Automotive
    • Construction
    • Others
  • Type
    • PVC products
    • Non-PVC products
  • Geography
    • APAC
      • China
      • India
      • Japan
    • North America
      • US
      • Canada
      • Mexico
    • Europe
      • Germany
      • UK
      • France
    • South America
      • Brazil
      • Argentina
    • Middle East and Africa
      • Saudi Arabia
      • UAE
      • South Africa
    • Rest of World (ROW)

By Product Insights

The 2-ethylhexanol segment is estimated to witness significant growth during the forecast period.

Market segmentation by product reveals a distinct shift toward high-performance solutions. While traditional alcohols remain prevalent, the demand for high-molecular-weight alcohols and specialty alcohols is increasing for applications requiring superior plasticizer performance characteristics.

Products derived from isononyl alcohol (INA) and 2-propylheptanol (2-PH) are instrumental in formulating low volatility plasticizers. These are essential for creating diisononyl phthalate (DINP) and dotyl terephthalate (DOTP). Such ester-based plasticizers offer enhanced polymer chain lubrication, reducing plasticizer migration.

This trend is driven by the need for materials like isodecyl alcohol (IDA) to produce diisodecyl phthalate (DIDP), which provides durability in demanding environments, with some formulations achieving a 25% reduction in material degradation over time.

Request Free Sample

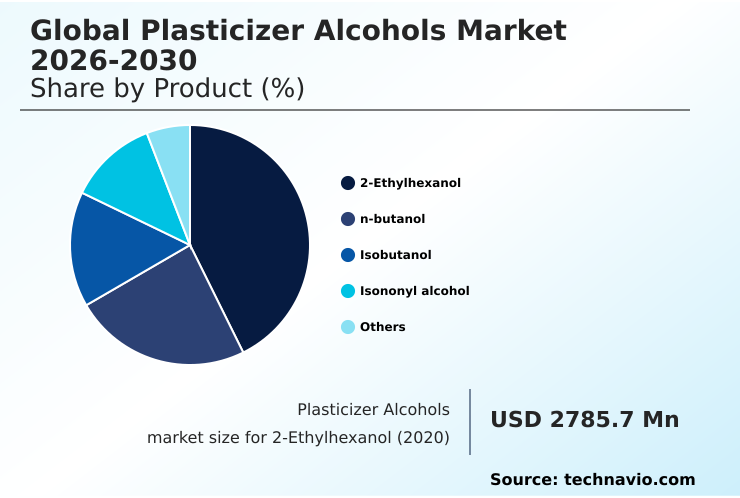
The 2-Ethylhexanol segment was valued at USD 3.83 billion in 2024 and showed a gradual increase during the forecast period.

Request Free Sample

Regional Analysis

APAC is estimated to contribute 38.8% to the growth of the global market during the forecast period.Technavio’s analysts have elaborately explained the regional trends and drivers that shape the market during the forecast period.

See How Plasticizer Alcohols Market Demand is Rising in APAC Request Free Sample

The geographic landscape is defined by a strategic buildup of regional production capacity, especially within integrated refinery complexes in APAC. These facilities leverage advanced oxo-process technology to convert petrochemical derivatives like propylene into essential oxo-alcohols.

The large-scale production of 2-ethylhexanol (2-EH) and n-butanol through hydroformylation and subsequent esterification supports both domestic demand and export activities. In contrast, North American and European markets focus on producing specialty chemical intermediates.

This geographical specialization impacts global trade, with APAC accounting for over 38% of incremental growth.

The establishment of new downstream petrochemical units in high-growth regions ensures a captive supply for industrial solvent applications and reduces reliance on imports, reshaping global supply chains for isobutanol and other key chemical intermediates.

Market Dynamics

Our researchers analyzed the data with 2025 as the base year, along with the key drivers, trends, and challenges. A holistic analysis of drivers will help companies refine their marketing strategies to gain a competitive advantage.

  • Analyzing the global plasticizer alcohols market 2026-2030 competitive landscape reveals a strategic focus on navigating the impact of REACH on plasticizers and mitigating supply chain risk in petrochemicals. The global plasticizer alcohols market 2026-2030 key drivers are linked to plasticizer demand in emerging economies, especially the demand for DOTP in construction.
  • A key discussion point is the 2-ethylhexanol vs isononyl alcohol debate, as companies weigh performance against cost. The global plasticizer alcohols market 2026-2030 emerging trends show a clear move toward sustainable alternatives to phthalate plasticizers and investment in bio-based alcohol production, highlighting the benefits of high molecular weight plasticizers.
  • PVC compounding with specialty alcohols is becoming standard for high-end applications like plasticizer alcohols in automotive interiors. The global plasticizer alcohols market 2026-2030 segmentation analysis and regional outlook indicate that while the price volatility of propylene feedstock remains a challenge, the non-phthalate plasticizers market share is growing.
  • This shift toward a circular economy for PVC plasticizers is a central theme, underscored by advancements in oxo-alcohol production process efficiency, where optimized catalyst use has improved yields by over 5% in certain facilities.

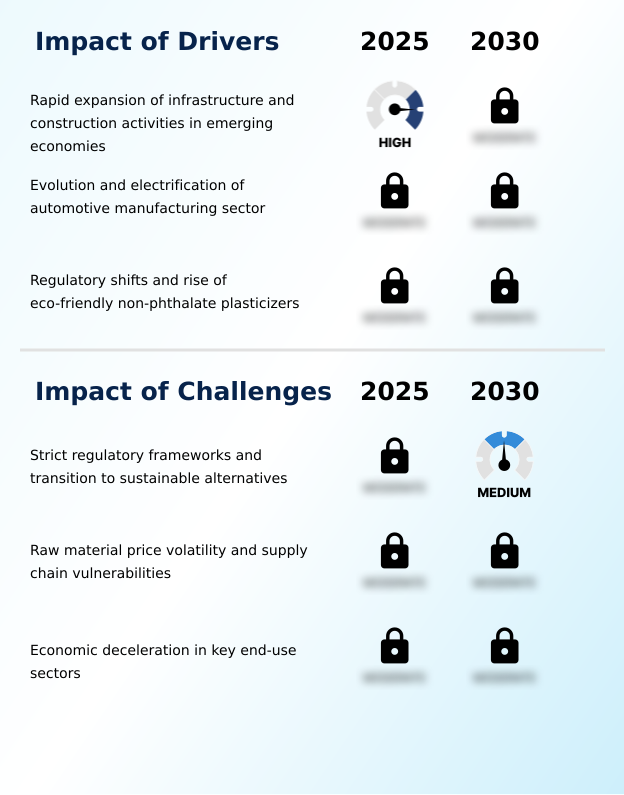
What are the key market drivers leading to the rise in the adoption of Plasticizer Alcohols Industry?

  • The rapid expansion of infrastructure and construction activities in emerging economies is a primary driver for the market, fueling demand for plasticized PVC in building applications.

  • Robust end-user industry demand is the primary market driver, particularly from sectors requiring high-performance polymers. In construction, demand for construction chemicals used in flexible PVC applications is strong, contributing to enhanced construction material durability.
  • The automotive sector's focus on automotive lightweighting materials is fueling the need for advanced plasticizers for automotive interiors that offer low fogging characteristics and superior material property enhancement. This requires high-purity alcohols to ensure PVC flexibility enhancement without compromising safety.
  • For specialized uses like wire and cable insulation, where performance is critical, demand for premium-grade polyvinyl chloride (PVC) is growing at a rate 10% faster than standard grades, underscoring the market's shift toward value-added solutions.

What are the market trends shaping the Plasticizer Alcohols Industry?

  • A key trend is the accelerating transition toward bio-based and circular feedstocks for alcohol production. This shift is driven by sustainability mandates and the increasing demand for products with a lower carbon footprint.

  • The market is undergoing a significant transformation toward sustainable plasticizer production, driven by stringent green chemistry principles. This trend involves the adoption of a mass balance approach to integrate bio-derived alcohol streams and promote circular feedstock integration. As a result, the availability of bio-based plasticizers and other eco-friendly plasticizer alternatives with a reduced product carbon footprint (PCF) is increasing.
  • Producers are securing international sustainability and carbon certification (ISCC) for their non-phthalate plasticizers, including advanced citrate plasticizers and adipate plasticizers. These efforts in environmental impact reduction, which have led to a 20% decrease in emissions for certain product lines, are supported by emerging chemical recycling technologies and a more secure non-fossil feedstock supply chain, fundamentally altering the competitive landscape.

What challenges does the Plasticizer Alcohols Industry face during its growth?

  • Strict regulatory frameworks and the mandated transition toward sustainable alternatives present a significant challenge, compelling producers to innovate and reformulate their product portfolios.

  • The market faces significant headwinds from supply chain vulnerability and feedstock price volatility, particularly for propylene feedstock and synthesis gas (syngas). These challenges are compounded by stringent regulatory compliance frameworks, such as the REACH regulation, which restricts the use of certain phthalate plasticizers like dioctyl phthalate (DOP) due to their volatile organic compound (VOC) content.
  • This has forced a move away from legacy chemicals and disrupted the supply of key inputs like trimellitic anhydride (TMA). The risk of force majeure events at major production hubs can tighten supply, causing price spikes of over 30% in a single quarter.
  • Moreover, the economic deceleration impact on end-use industries adds another layer of uncertainty, making it difficult to balance production with fluctuating demand while adhering to evolving chemical safety standards.

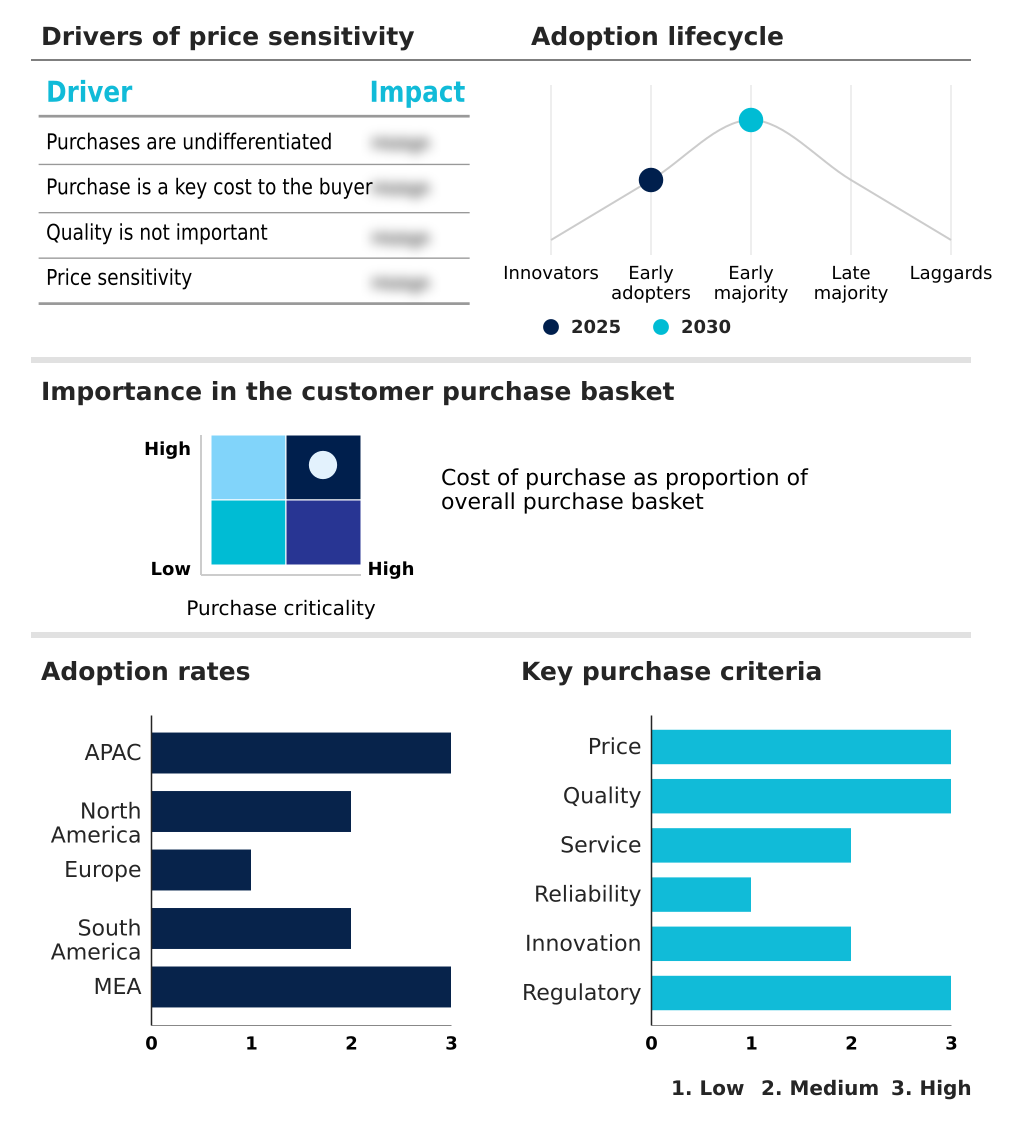
Exclusive Technavio Analysis on Customer Landscape

The plasticizer alcohols market forecasting report includes the adoption lifecycle of the market, covering from the innovator’s stage to the laggard’s stage. It focuses on adoption rates in different regions based on penetration. Furthermore, the plasticizer alcohols market report also includes key purchase criteria and drivers of price sensitivity to help companies evaluate and develop their market growth analysis strategies.

Customer Landscape of Plasticizer Alcohols Industry

Competitive Landscape

Companies are implementing various strategies, such as strategic alliances, plasticizer alcohols market forecast, partnerships, mergers and acquisitions, geographical expansion, and product/service launches, to enhance their presence in the industry.

Amines and Plasticizers ltd. - Offerings center on advanced oxo-alcohol intermediates and plasticizer raw materials, engineered to enhance flexible PVC and polymer performance for global industrial applications.

The industry research and growth report includes detailed analyses of the competitive landscape of the market and information about key companies, including:

  • Amines and Plasticizers ltd.
  • Arkema Group
  • BASF SE
  • Dow Chemical Co.
  • Eastman Chemical Co.
  • Evonik Industries AG
  • Exxon Mobil Corp.
  • INEOS Group Holdings S.A.
  • Innospec Inc.
  • KH Neochem Co. Ltd.
  • Lanxess AG
  • LG Chem Ltd.
  • Polynt SpA
  • Roquette Freres SA
  • Sasol Ltd.
  • Saudi Basic Industries
  • Shell plc
  • Supreme Plasticizers
  • Tecnosintesi S.p.A.
  • VVF Ltd.

Qualitative and quantitative analysis of companies has been conducted to help clients understand the wider business environment as well as the strengths and weaknesses of key industry players. Data is qualitatively analyzed to categorize companies as pure play, category-focused, industry-focused, and diversified; it is quantitatively analyzed to categorize companies as dominant, leading, strong, tentative, and weak.

Recent Development and News in Plasticizer alcohols market

  • In August 2024, BASF SE signed a Memorandum of Understanding with UPC Technology Corp. for the long-term supply of plasticizer alcohols from its Zhanjiang Verbund site, securing feedstock for plasticizer production in South China.
  • In October 2024, Evonik Industries AG announced a significant expansion of its production capacities for isononanol-based plasticizers at its facility in Marl, Germany, to meet growing demand for non-phthalate alternatives.
  • In January 2025, Braskem announced an investment of approximately USD 100 million to expand its domestic Polyvinyl Chloride (PVC) production capabilities in Brazil, directly increasing regional demand for plasticizers and their alcohol precursors.
  • In February 2025, OQ Chemicals GmbH announced global price revisions for its portfolio of oxo intermediates and alcohols, citing fluctuating raw material costs and complex supply chain dynamics.

Dive into Technavio’s robust research methodology, blending expert interviews, extensive data synthesis, and validated models for unparalleled Plasticizer Alcohols Market insights. See full methodology.

Market Scope
Page number 311
Base year 2025
Historic period 2020-2024
Forecast period 2026-2030
Growth momentum & CAGR Accelerate at a CAGR of 9.7%
Market growth 2026-2030 USD 5648.6 million
Market structure Fragmented
YoY growth 2025-2026(%) 9.0%
Key countries China, India, Japan, South Korea, Australia, Indonesia, US, Canada, Mexico, Germany, UK, France, Italy, Spain, The Netherlands, Brazil, Argentina, Chile, Saudi Arabia, UAE, South Africa, Egypt and Turkey
Competitive landscape Leading Companies, Market Positioning of Companies, Competitive Strategies, and Industry Risks

Request Free Sample

Research Analyst Overview

  • The plasticizer alcohols market is evolving beyond commodity chemicals into a sophisticated ecosystem driven by performance and sustainability. Key boardroom decisions now center on managing the production of vital chemical intermediates while aligning with stringent environmental standards like the REACH regulation.
  • The industry is pivoting toward high-molecular-weight alcohols and specialty alcohols to meet demand for products with low fogging characteristics and minimal plasticizer migration, particularly for sensitive applications in automotive interiors and wire and cable insulation.
  • This shift requires significant capital investment in technologies for synthesizing isononyl alcohol (INA) and 2-propylheptanol (2-PH), which are crucial for diisononyl phthalate (DINP) and other advanced esters. Balancing the use of traditional inputs like 2-ethylhexanol (2-EH) against the need for high-purity alcohols for adipate plasticizers and citrate plasticizers is a key strategic challenge.
  • This transition is not without cost, as moving to greener formulations can increase operational expenses by up to 15% due to complex purification processes, a factor that directly impacts corporate budgeting and product pricing strategies.

What are the Key Data Covered in this Plasticizer Alcohols Market Research and Growth Report?

  • What is the expected growth of the Plasticizer Alcohols Market between 2026 and 2030?

    • USD 5.65 billion, at a CAGR of 9.7%

  • What segmentation does the market report cover?

    • The report is segmented by Product (2-Ethylhexanol, n-butanol, Isobutanol, Isononyl alcohol, and Others), End-user (Automotive, Construction, and Others), Type (PVC products, and Non-PVC products) and Geography (APAC, North America, Europe, South America, Middle East and Africa)

  • Which regions are analyzed in the report?

    • APAC, North America, Europe, South America and Middle East and Africa

  • What are the key growth drivers and market challenges?

    • Rapid expansion of infrastructure and construction activities in emerging economies, Strict regulatory frameworks and transition to sustainable alternatives

  • Who are the major players in the Plasticizer Alcohols Market?

    • Amines and Plasticizers ltd., Arkema Group, BASF SE, Dow Chemical Co., Eastman Chemical Co., Evonik Industries AG, Exxon Mobil Corp., INEOS Group Holdings S.A., Innospec Inc., KH Neochem Co. Ltd., Lanxess AG, LG Chem Ltd., Polynt SpA, Roquette Freres SA, Sasol Ltd., Saudi Basic Industries, Shell plc, Supreme Plasticizers, Tecnosintesi S.p.A. and VVF Ltd.

Market Research Insights

  • The plasticizer alcohols market is shaped by dynamic end-user industry demand, where material property enhancement is critical. The push for automotive lightweighting materials has spurred innovation, while PVC flexibility enhancement remains a core requirement in construction, contributing to a 9.0% year-over-year market expansion.
  • This growth is not uniform; high-performance polymers see adoption rates nearly 15% higher in regulated markets compared to price-sensitive regions. The ongoing development of eco-friendly plasticizer alternatives and adherence to strict chemical safety standards are creating new value streams.
  • Strategic investments in specialty chemical synthesis and circular feedstock integration are essential for navigating this landscape, where feedstock price volatility continues to be a primary concern for maintaining stable production costs and profitability.

We can help! Our analysts can customize this plasticizer alcohols market research report to meet your requirements.

Get in touch

1. Executive Summary

1.1 Market overview

Executive Summary - Chart on Market Overview
Executive Summary - Data Table on Market Overview
Executive Summary - Chart on Global Market Characteristics
Executive Summary - Chart on Market by Geography
Executive Summary - Chart on Market Segmentation by Product
Executive Summary - Chart on Market Segmentation by End-user
Executive Summary - Chart on Market Segmentation by Type
Executive Summary - Chart on Incremental Growth
Executive Summary - Data Table on Incremental Growth
Executive Summary - Chart on Company Market Positioning

2. Technavio Analysis

2.1 Analysis of price sensitivity, lifecycle, customer purchase basket, adoption rates, and purchase criteria

2.2 Criticality of inputs and Factors of differentiation

Chart on Overview on criticality of inputs and factors of differentiation

2.3 Factors of disruption

Chart on Overview on factors of disruption

2.4 Impact of drivers and challenges

Chart on Impact of drivers and challenges in 2025 and 2030

3. Market Landscape

3.1 Market ecosystem

Chart on Parent Market
Data Table on - Parent Market

3.2 Market characteristics

Chart on Market characteristics analysis

3.3 Value chain analysis

Chart on Value chain analysis

4. Market Sizing

4.1 Market definition

Data Table on Offerings of companies included in the market definition

4.2 Market segment analysis

Market segments

4.3 Market size 2025

4.4 Market outlook: Forecast for 2025-2030

Chart on Global - Market size and forecast 2025-2030 ($ million)
Data Table on Global - Market size and forecast 2025-2030 ($ million)
Chart on Global Market: Year-over-year growth 2025-2030 (%)
Data Table on Global Market: Year-over-year growth 2025-2030 (%)

5. Historic Market Size

5.1 Global Plasticizer Alcohols Market 2020 - 2024

Historic Market Size - Data Table on Global Plasticizer Alcohols Market 2020 - 2024 ($ million)

5.2 Product segment analysis 2020 - 2024

Historic Market Size - Product Segment 2020 - 2024 ($ million)

5.3 End-user segment analysis 2020 - 2024

Historic Market Size - End-user Segment 2020 - 2024 ($ million)

5.4 Type segment analysis 2020 - 2024

Historic Market Size - Type Segment 2020 - 2024 ($ million)

5.5 Geography segment analysis 2020 - 2024

Historic Market Size - Geography Segment 2020 - 2024 ($ million)

5.6 Country segment analysis 2020 - 2024

Historic Market Size - Country Segment 2020 - 2024 ($ million)

6. Qualitative Analysis

6.1 Impact of AI in the Global Plasticizer Alcohols Market

7. Five Forces Analysis

7.1 Five forces summary

Five forces analysis - Comparison between 2025 and 2030

7.2 Bargaining power of buyers

Bargaining power of buyers - Impact of key factors 2025 and 2030

7.3 Bargaining power of suppliers

Bargaining power of suppliers - Impact of key factors in 2025 and 2030

7.4 Threat of new entrants

Threat of new entrants - Impact of key factors in 2025 and 2030

7.5 Threat of substitutes

Threat of substitutes - Impact of key factors in 2025 and 2030

7.6 Threat of rivalry

Threat of rivalry - Impact of key factors in 2025 and 2030

7.7 Market condition

Chart on Market condition - Five forces 2025 and 2030

8. Market Segmentation by Product

8.1 Market segments

Chart on Product - Market share 2025-2030 (%)
Data Table on Product - Market share 2025-2030 (%)

8.2 Comparison by Product

Chart on Comparison by Product
Data Table on Comparison by Product

8.3 2-Ethylhexanol - Market size and forecast 2025-2030

Chart on 2-Ethylhexanol - Market size and forecast 2025-2030 ($ million)
Data Table on 2-Ethylhexanol - Market size and forecast 2025-2030 ($ million)
Chart on 2-Ethylhexanol - Year-over-year growth 2025-2030 (%)
Data Table on 2-Ethylhexanol - Year-over-year growth 2025-2030 (%)

8.4 n-butanol - Market size and forecast 2025-2030

Chart on n-butanol - Market size and forecast 2025-2030 ($ million)
Data Table on n-butanol - Market size and forecast 2025-2030 ($ million)
Chart on n-butanol - Year-over-year growth 2025-2030 (%)
Data Table on n-butanol - Year-over-year growth 2025-2030 (%)

8.5 Isobutanol - Market size and forecast 2025-2030

Chart on Isobutanol - Market size and forecast 2025-2030 ($ million)
Data Table on Isobutanol - Market size and forecast 2025-2030 ($ million)
Chart on Isobutanol - Year-over-year growth 2025-2030 (%)
Data Table on Isobutanol - Year-over-year growth 2025-2030 (%)

8.6 Isononyl alcohol - Market size and forecast 2025-2030

Chart on Isononyl alcohol - Market size and forecast 2025-2030 ($ million)
Data Table on Isononyl alcohol - Market size and forecast 2025-2030 ($ million)
Chart on Isononyl alcohol - Year-over-year growth 2025-2030 (%)
Data Table on Isononyl alcohol - Year-over-year growth 2025-2030 (%)

8.7 Others - Market size and forecast 2025-2030

Chart on Others - Market size and forecast 2025-2030 ($ million)
Data Table on Others - Market size and forecast 2025-2030 ($ million)
Chart on Others - Year-over-year growth 2025-2030 (%)
Data Table on Others - Year-over-year growth 2025-2030 (%)

8.8 Market opportunity by Product

Market opportunity by Product ($ million)
Data Table on Market opportunity by Product ($ million)

9. Market Segmentation by End-user

9.1 Market segments

Chart on End-user - Market share 2025-2030 (%)
Data Table on End-user - Market share 2025-2030 (%)

9.2 Comparison by End-user

Chart on Comparison by End-user
Data Table on Comparison by End-user

9.3 Automotive - Market size and forecast 2025-2030

Chart on Automotive - Market size and forecast 2025-2030 ($ million)
Data Table on Automotive - Market size and forecast 2025-2030 ($ million)
Chart on Automotive - Year-over-year growth 2025-2030 (%)
Data Table on Automotive - Year-over-year growth 2025-2030 (%)

9.4 Construction - Market size and forecast 2025-2030

Chart on Construction - Market size and forecast 2025-2030 ($ million)
Data Table on Construction - Market size and forecast 2025-2030 ($ million)
Chart on Construction - Year-over-year growth 2025-2030 (%)
Data Table on Construction - Year-over-year growth 2025-2030 (%)

9.5 Others - Market size and forecast 2025-2030

Chart on Others - Market size and forecast 2025-2030 ($ million)
Data Table on Others - Market size and forecast 2025-2030 ($ million)
Chart on Others - Year-over-year growth 2025-2030 (%)
Data Table on Others - Year-over-year growth 2025-2030 (%)

9.6 Market opportunity by End-user

Market opportunity by End-user ($ million)
Data Table on Market opportunity by End-user ($ million)

10. Market Segmentation by Type

10.1 Market segments

Chart on Type - Market share 2025-2030 (%)
Data Table on Type - Market share 2025-2030 (%)

10.2 Comparison by Type

Chart on Comparison by Type
Data Table on Comparison by Type

10.3 PVC products - Market size and forecast 2025-2030

Chart on PVC products - Market size and forecast 2025-2030 ($ million)
Data Table on PVC products - Market size and forecast 2025-2030 ($ million)
Chart on PVC products - Year-over-year growth 2025-2030 (%)
Data Table on PVC products - Year-over-year growth 2025-2030 (%)

10.4 Non-PVC products - Market size and forecast 2025-2030

Chart on Non-PVC products - Market size and forecast 2025-2030 ($ million)
Data Table on Non-PVC products - Market size and forecast 2025-2030 ($ million)
Chart on Non-PVC products - Year-over-year growth 2025-2030 (%)
Data Table on Non-PVC products - Year-over-year growth 2025-2030 (%)

10.5 Market opportunity by Type

Market opportunity by Type ($ million)
Data Table on Market opportunity by Type ($ million)

11. Customer Landscape

11.1 Customer landscape overview

Analysis of price sensitivity, lifecycle, customer purchase basket, adoption rates, and purchase criteria

12. Geographic Landscape

12.1 Geographic segmentation

Chart on Market share by geography 2025-2030 (%)
Data Table on Market share by geography 2025-2030 (%)

12.2 Geographic comparison

Chart on Geographic comparison
Data Table on Geographic comparison

12.3 APAC - Market size and forecast 2025-2030

Chart on APAC - Market size and forecast 2025-2030 ($ million)
Data Table on APAC - Market size and forecast 2025-2030 ($ million)
Chart on APAC - Year-over-year growth 2025-2030 (%)
Data Table on APAC - Year-over-year growth 2025-2030 (%)
Chart on Regional Comparison - APAC
Data Table on Regional Comparison - APAC

12.3.1 China - Market size and forecast 2025-2030

Chart on China - Market size and forecast 2025-2030 ($ million)
Data Table on China - Market size and forecast 2025-2030 ($ million)
Chart on China - Year-over-year growth 2025-2030 (%)
Data Table on China - Year-over-year growth 2025-2030 (%)

12.3.2 India - Market size and forecast 2025-2030

Chart on India - Market size and forecast 2025-2030 ($ million)
Data Table on India - Market size and forecast 2025-2030 ($ million)
Chart on India - Year-over-year growth 2025-2030 (%)
Data Table on India - Year-over-year growth 2025-2030 (%)

12.3.3 Japan - Market size and forecast 2025-2030

Chart on Japan - Market size and forecast 2025-2030 ($ million)
Data Table on Japan - Market size and forecast 2025-2030 ($ million)
Chart on Japan - Year-over-year growth 2025-2030 (%)
Data Table on Japan - Year-over-year growth 2025-2030 (%)

12.3.4 South Korea - Market size and forecast 2025-2030

Chart on South Korea - Market size and forecast 2025-2030 ($ million)
Data Table on South Korea - Market size and forecast 2025-2030 ($ million)
Chart on South Korea - Year-over-year growth 2025-2030 (%)
Data Table on South Korea - Year-over-year growth 2025-2030 (%)

12.3.5 Australia - Market size and forecast 2025-2030

Chart on Australia - Market size and forecast 2025-2030 ($ million)
Data Table on Australia - Market size and forecast 2025-2030 ($ million)
Chart on Australia - Year-over-year growth 2025-2030 (%)
Data Table on Australia - Year-over-year growth 2025-2030 (%)

12.3.6 Indonesia - Market size and forecast 2025-2030

Chart on Indonesia - Market size and forecast 2025-2030 ($ million)
Data Table on Indonesia - Market size and forecast 2025-2030 ($ million)
Chart on Indonesia - Year-over-year growth 2025-2030 (%)
Data Table on Indonesia - Year-over-year growth 2025-2030 (%)

12.4 North America - Market size and forecast 2025-2030

Chart on North America - Market size and forecast 2025-2030 ($ million)
Data Table on North America - Market size and forecast 2025-2030 ($ million)
Chart on North America - Year-over-year growth 2025-2030 (%)
Data Table on North America - Year-over-year growth 2025-2030 (%)
Chart on Regional Comparison - North America
Data Table on Regional Comparison - North America

12.4.1 US - Market size and forecast 2025-2030

Chart on US - Market size and forecast 2025-2030 ($ million)
Data Table on US - Market size and forecast 2025-2030 ($ million)
Chart on US - Year-over-year growth 2025-2030 (%)
Data Table on US - Year-over-year growth 2025-2030 (%)

12.4.2 Canada - Market size and forecast 2025-2030

Chart on Canada - Market size and forecast 2025-2030 ($ million)
Data Table on Canada - Market size and forecast 2025-2030 ($ million)
Chart on Canada - Year-over-year growth 2025-2030 (%)
Data Table on Canada - Year-over-year growth 2025-2030 (%)

12.4.3 Mexico - Market size and forecast 2025-2030

Chart on Mexico - Market size and forecast 2025-2030 ($ million)
Data Table on Mexico - Market size and forecast 2025-2030 ($ million)
Chart on Mexico - Year-over-year growth 2025-2030 (%)
Data Table on Mexico - Year-over-year growth 2025-2030 (%)

12.5 Europe - Market size and forecast 2025-2030

Chart on Europe - Market size and forecast 2025-2030 ($ million)
Data Table on Europe - Market size and forecast 2025-2030 ($ million)
Chart on Europe - Year-over-year growth 2025-2030 (%)
Data Table on Europe - Year-over-year growth 2025-2030 (%)
Chart on Regional Comparison - Europe
Data Table on Regional Comparison - Europe

12.5.1 Germany - Market size and forecast 2025-2030

Chart on Germany - Market size and forecast 2025-2030 ($ million)
Data Table on Germany - Market size and forecast 2025-2030 ($ million)
Chart on Germany - Year-over-year growth 2025-2030 (%)
Data Table on Germany - Year-over-year growth 2025-2030 (%)

12.5.2 UK - Market size and forecast 2025-2030

Chart on UK - Market size and forecast 2025-2030 ($ million)
Data Table on UK - Market size and forecast 2025-2030 ($ million)
Chart on UK - Year-over-year growth 2025-2030 (%)
Data Table on UK - Year-over-year growth 2025-2030 (%)

12.5.3 France - Market size and forecast 2025-2030

Chart on France - Market size and forecast 2025-2030 ($ million)
Data Table on France - Market size and forecast 2025-2030 ($ million)
Chart on France - Year-over-year growth 2025-2030 (%)
Data Table on France - Year-over-year growth 2025-2030 (%)

12.5.4 Italy - Market size and forecast 2025-2030

Chart on Italy - Market size and forecast 2025-2030 ($ million)
Data Table on Italy - Market size and forecast 2025-2030 ($ million)
Chart on Italy - Year-over-year growth 2025-2030 (%)
Data Table on Italy - Year-over-year growth 2025-2030 (%)

12.5.5 Spain - Market size and forecast 2025-2030

Chart on Spain - Market size and forecast 2025-2030 ($ million)
Data Table on Spain - Market size and forecast 2025-2030 ($ million)
Chart on Spain - Year-over-year growth 2025-2030 (%)
Data Table on Spain - Year-over-year growth 2025-2030 (%)

12.5.6 The Netherlands - Market size and forecast 2025-2030

Chart on The Netherlands - Market size and forecast 2025-2030 ($ million)
Data Table on The Netherlands - Market size and forecast 2025-2030 ($ million)
Chart on The Netherlands - Year-over-year growth 2025-2030 (%)
Data Table on The Netherlands - Year-over-year growth 2025-2030 (%)

12.6 South America - Market size and forecast 2025-2030

Chart on South America - Market size and forecast 2025-2030 ($ million)
Data Table on South America - Market size and forecast 2025-2030 ($ million)
Chart on South America - Year-over-year growth 2025-2030 (%)
Data Table on South America - Year-over-year growth 2025-2030 (%)
Chart on Regional Comparison - South America
Data Table on Regional Comparison - South America

12.6.1 Brazil - Market size and forecast 2025-2030

Chart on Brazil - Market size and forecast 2025-2030 ($ million)
Data Table on Brazil - Market size and forecast 2025-2030 ($ million)
Chart on Brazil - Year-over-year growth 2025-2030 (%)
Data Table on Brazil - Year-over-year growth 2025-2030 (%)

12.6.2 Argentina - Market size and forecast 2025-2030

Chart on Argentina - Market size and forecast 2025-2030 ($ million)
Data Table on Argentina - Market size and forecast 2025-2030 ($ million)
Chart on Argentina - Year-over-year growth 2025-2030 (%)
Data Table on Argentina - Year-over-year growth 2025-2030 (%)

12.6.3 Chile - Market size and forecast 2025-2030

Chart on Chile - Market size and forecast 2025-2030 ($ million)
Data Table on Chile - Market size and forecast 2025-2030 ($ million)
Chart on Chile - Year-over-year growth 2025-2030 (%)
Data Table on Chile - Year-over-year growth 2025-2030 (%)

12.7 Middle East and Africa - Market size and forecast 2025-2030

Chart on Middle East and Africa - Market size and forecast 2025-2030 ($ million)
Data Table on Middle East and Africa - Market size and forecast 2025-2030 ($ million)
Chart on Middle East and Africa - Year-over-year growth 2025-2030 (%)
Data Table on Middle East and Africa - Year-over-year growth 2025-2030 (%)
Chart on Regional Comparison - Middle East and Africa
Data Table on Regional Comparison - Middle East and Africa

12.7.1 Saudi Arabia - Market size and forecast 2025-2030

Chart on Saudi Arabia - Market size and forecast 2025-2030 ($ million)
Data Table on Saudi Arabia - Market size and forecast 2025-2030 ($ million)
Chart on Saudi Arabia - Year-over-year growth 2025-2030 (%)
Data Table on Saudi Arabia - Year-over-year growth 2025-2030 (%)

12.7.2 UAE - Market size and forecast 2025-2030

Chart on UAE - Market size and forecast 2025-2030 ($ million)
Data Table on UAE - Market size and forecast 2025-2030 ($ million)
Chart on UAE - Year-over-year growth 2025-2030 (%)
Data Table on UAE - Year-over-year growth 2025-2030 (%)

12.7.3 South Africa - Market size and forecast 2025-2030

Chart on South Africa - Market size and forecast 2025-2030 ($ million)
Data Table on South Africa - Market size and forecast 2025-2030 ($ million)
Chart on South Africa - Year-over-year growth 2025-2030 (%)
Data Table on South Africa - Year-over-year growth 2025-2030 (%)

12.7.4 Egypt - Market size and forecast 2025-2030

Chart on Egypt - Market size and forecast 2025-2030 ($ million)
Data Table on Egypt - Market size and forecast 2025-2030 ($ million)
Chart on Egypt - Year-over-year growth 2025-2030 (%)
Data Table on Egypt - Year-over-year growth 2025-2030 (%)

12.7.5 Turkey - Market size and forecast 2025-2030

Chart on Turkey - Market size and forecast 2025-2030 ($ million)
Data Table on Turkey - Market size and forecast 2025-2030 ($ million)
Chart on Turkey - Year-over-year growth 2025-2030 (%)
Data Table on Turkey - Year-over-year growth 2025-2030 (%)

12.8 Market opportunity by geography

Market opportunity by geography ($ million)
Data Tables on Market opportunity by geography ($ million)

13. Drivers, Challenges, and Opportunity

13.1 Market drivers

Rapid expansion of infrastructure and construction activities in emerging economies
Evolution and electrification of automotive manufacturing sector
Regulatory shifts and rise of eco-friendly non-phthalate plasticizers

13.2 Market challenges

Strict regulatory frameworks and transition to sustainable alternatives
Raw material price volatility and supply chain vulnerabilities
Economic deceleration in key end-use sectors

13.3 Impact of drivers and challenges

Impact of drivers and challenges in 2025 and 2030

13.4 Market opportunities

Accelerating transition toward bio-based and circular feedstocks
Strategic localization of production capacities in emerging asian economies
Evolution toward high-molecular-weight and specialty alcohols

14. Competitive Landscape

14.1 Overview

14.2

Overview on criticality of inputs and factors of differentiation

14.3 Landscape disruption

Overview on factors of disruption

14.4 Industry risks

Impact of key risks on business

15. Competitive Analysis

15.1 Companies profiled

Companies covered

15.2 Company ranking index

15.3 Market positioning of companies

Matrix on companies position and classification

15.4 Arkema Group

Arkema Group - Overview
Arkema Group - Business segments
Arkema Group - Key news
Arkema Group - Key offerings
Arkema Group - Segment focus
SWOT

15.5 BASF SE

BASF SE - Overview
BASF SE - Business segments
BASF SE - Key news
BASF SE - Key offerings
BASF SE - Segment focus
SWOT

15.6 Dow Chemical Co.

Dow Chemical Co. - Overview
Dow Chemical Co. - Business segments
Dow Chemical Co. - Key news
Dow Chemical Co. - Key offerings
Dow Chemical Co. - Segment focus
SWOT

15.7 Eastman Chemical Co.

Eastman Chemical Co. - Overview
Eastman Chemical Co. - Business segments
Eastman Chemical Co. - Key news
Eastman Chemical Co. - Key offerings
Eastman Chemical Co. - Segment focus
SWOT

15.8 Evonik Industries AG

Evonik Industries AG - Overview
Evonik Industries AG - Business segments
Evonik Industries AG - Key news
Evonik Industries AG - Key offerings
Evonik Industries AG - Segment focus
SWOT

15.9 Exxon Mobil Corp.

Exxon Mobil Corp. - Overview
Exxon Mobil Corp. - Business segments
Exxon Mobil Corp. - Key news
Exxon Mobil Corp. - Key offerings
Exxon Mobil Corp. - Segment focus
SWOT

15.10 INEOS Group Holdings S.A.

INEOS Group Holdings S.A. - Overview
INEOS Group Holdings S.A. - Product / Service
INEOS Group Holdings S.A. - Key news
INEOS Group Holdings S.A. - Key offerings
SWOT

15.11 Innospec Inc.

Innospec Inc. - Overview
Innospec Inc. - Business segments
Innospec Inc. - Key offerings
Innospec Inc. - Segment focus
SWOT

15.12 KH Neochem Co. Ltd.

KH Neochem Co. Ltd. - Overview
KH Neochem Co. Ltd. - Product / Service
KH Neochem Co. Ltd. - Key offerings
SWOT

15.13 LG Chem Ltd.

LG Chem Ltd. - Overview
LG Chem Ltd. - Business segments
LG Chem Ltd. - Key news
LG Chem Ltd. - Key offerings
LG Chem Ltd. - Segment focus
SWOT

15.14 Polynt SpA

Polynt SpA - Overview
Polynt SpA - Product / Service
Polynt SpA - Key offerings
SWOT

15.15 Roquette Freres SA

Roquette Freres SA - Overview
Roquette Freres SA - Product / Service
Roquette Freres SA - Key offerings
SWOT

15.16 Saudi Basic Industries

Saudi Basic Industries - Overview
Saudi Basic Industries - Business segments
Saudi Basic Industries - Key offerings
Saudi Basic Industries - Segment focus
SWOT

15.17 Shell plc

Shell plc - Overview
Shell plc - Business segments
Shell plc - Key news
Shell plc - Key offerings
Shell plc - Segment focus
SWOT

15.18 VVF Ltd.

VVF Ltd. - Overview
VVF Ltd. - Product / Service
VVF Ltd. - Key offerings
SWOT

16. Appendix

16.1 Scope of the report

Market definition
Objectives
Notes and caveats

16.2 Inclusions and exclusions checklist

Inclusions checklist
Exclusions checklist

16.3 Currency conversion rates for US$

16.4 Research methodology

16.5 Data procurement

Information sources

16.6 Data validation

16.7 Validation techniques employed for market sizing

16.8 Data synthesis

16.9 360 degree market analysis

16.10 List of abbreviations

Research Methodology

Technavio presents a detailed picture of the market by way of study, synthesis, and summation of data from multiple sources. The analysts have presented the various facets of the market with a particular focus on identifying the key industry influencers. The data thus presented is comprehensive, reliable, and the result of extensive research, both primary and secondary.

INFORMATION SOURCES

Primary sources

  • Manufacturers and suppliers
  • Channel partners
  • Industry experts
  • Strategic decision makers

Secondary sources

  • Industry journals and periodicals
  • Government data
  • Financial reports of key industry players
  • Historical data
  • Press releases

DATA ANALYSIS

Data Synthesis

  • Collation of data
  • Estimation of key figures
  • Analysis of derived insights

Data Validation

  • Triangulation with data models
  • Reference against proprietary databases
  • Corroboration with industry experts

REPORT WRITING

Qualitative

  • Market drivers
  • Market challenges
  • Market trends
  • Five forces analysis

Quantitative

  • Market size and forecast
  • Market segmentation
  • Geographical insights
  • Competitive landscape

Interested in this report?

Get your sample now to see our research methodology and insights!

Download Now

Frequently Asked Questions

Plasticizer Alcohols market growth will increase by USD 5648.6 million during 2026-2030 .

The Plasticizer Alcohols market is expected to grow at a CAGR of 9.7% during 2026-2030 .

Plasticizer Alcohols market is segmented by Product (2-Ethylhexanol, n-butanol, Isobutanol, Isononyl alcohol, Others) End-user (Automotive, Construction, Others) Type (PVC products, Non-PVC products)

Amines and Plasticizers ltd., Arkema Group, BASF SE, Dow Chemical Co., Eastman Chemical Co., Evonik Industries AG, Exxon Mobil Corp., INEOS Group Holdings S.A., Innospec Inc., KH Neochem Co. Ltd., Lanxess AG, LG Chem Ltd., Polynt SpA, Roquette Freres SA, Sasol Ltd., Saudi Basic Industries, Shell plc, Supreme Plasticizers, Tecnosintesi S.p.A., VVF Ltd. are a few of the key vendors in the Plasticizer Alcohols market.

APAC will register the highest growth rate of 38.8% among the other regions. Therefore, the Plasticizer Alcohols market in APAC is expected to garner significant business opportunities for the vendors during the forecast period.

China, India, Japan, South Korea, Australia, Indonesia, US, Canada, Mexico, Germany, UK, France, Italy, Spain, The Netherlands, Brazil, Argentina, Chile, Saudi Arabia, UAE, South Africa, Egypt, Turkey

  • Rapid expansion of infrastructure and construction activities in emerging economies is the driving factor this market.

The Plasticizer Alcohols market vendors should focus on grabbing business opportunities from the Product segment as it accounted for the largest market share in the base year.