Portable Power Station Market Analysis, Size, and Forecast 2026-2030: APAC (China, Japan, and India), North America (US, Canada, and Mexico), Europe (Germany, UK, and France), Middle East and Africa (Saudi Arabia, UAE, and South Africa), South America (Brazil and Argentina), and Rest of World (ROW)

Portable Power Station Market Analysis, Size, and Forecast 2026-2030:
APAC (China, Japan, and India), North America (US, Canada, and Mexico), Europe (Germany, UK, and France), Middle East and Africa (Saudi Arabia, UAE, and South Africa), South America (Brazil and Argentina), and Rest of World (ROW)

Published: Mar 2026 288 Pages SKU: IRTNTR70962

Market Overview at a Glance

$254.6 Mn
Market Opportunity
9.4%
CAGR 2025 - 2030
41.9%
APAC Growth
$297.1 Mn
Off-grid power segment 2024

Portable Power Station Market Size 2026-2030

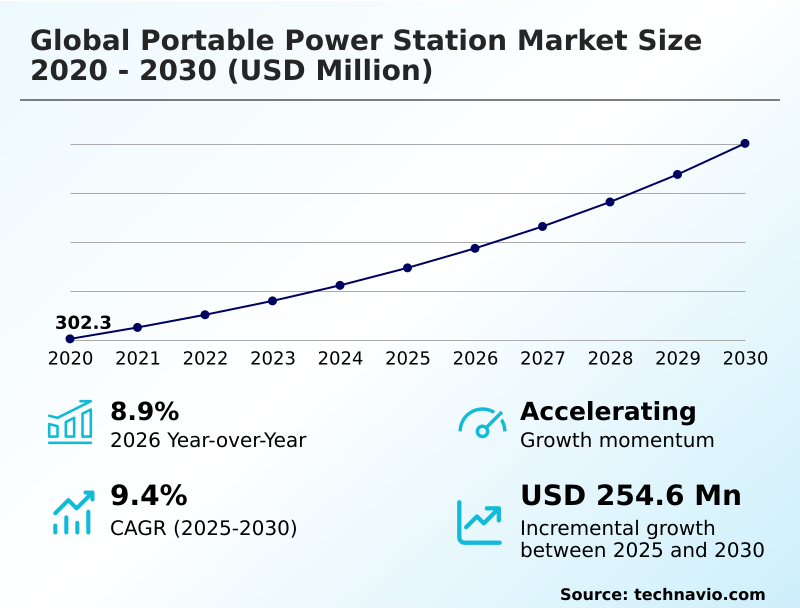
The portable power station market size is valued to increase by USD 254.6 million, at a CAGR of 9.4% from 2025 to 2030. Growing demand for off-grid power solutions will drive the portable power station market.

Major Market Trends & Insights

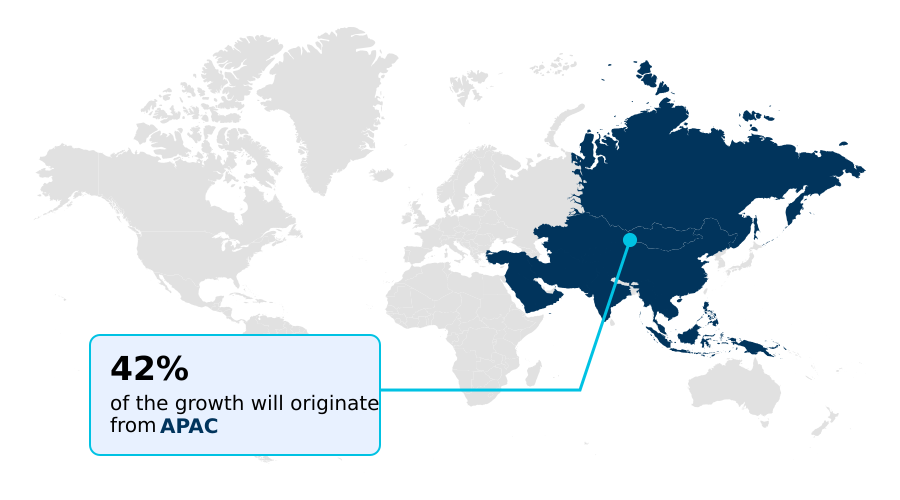
  • APAC dominated the market and accounted for a 41.9% growth during the forecast period.
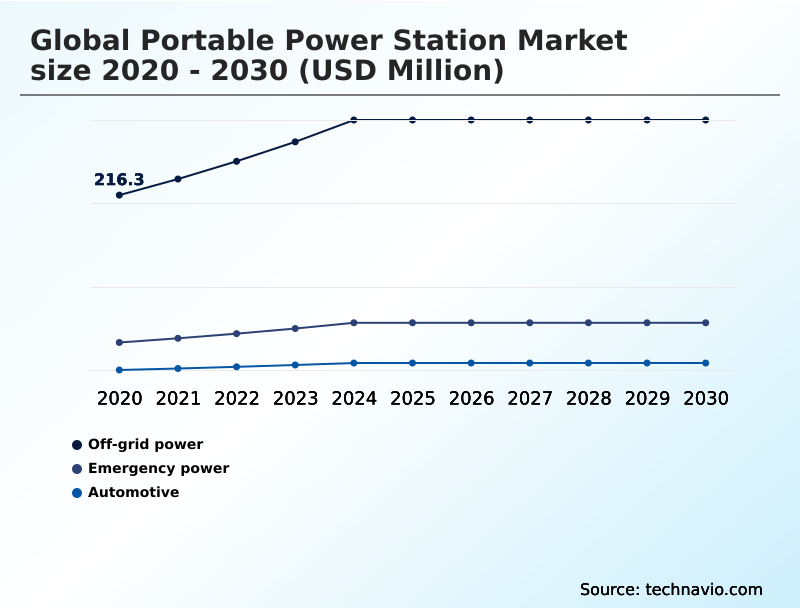
  • By Application - Off-grid power segment was valued at USD 297.1 million in 2024
  • By Technology - Lithium-ion segment accounted for the largest market revenue share in 2024

Market Size & Forecast

  • Market Opportunities: USD 399.9 million
  • Market Future Opportunities: USD 254.6 million
  • CAGR from 2025 to 2030 : 9.4%

Market Summary

  • The portable power station market is advancing beyond basic recreational use, becoming integral to energy resilience and off-grid autonomy. Growth is fueled by increasing power grid instability and a rising consumer interest in outdoor lifestyles and emergency preparedness. Key technological trends include the integration of safer, long-lasting LiFePO4 battery chemistry and smart battery management systems that optimize performance.
  • For instance, a mobile medical clinic in a remote area relies on a portable solar generator for an uninterruptible power supply to critical equipment, showcasing the technology's expanding role. However, the market's trajectory is moderated by challenges such as high upfront costs and the physical limitations of battery energy density, which restricts the runtime of heavy-duty appliance support.
  • Manufacturers are addressing this by innovating with modular expansion batteries and more efficient power electronics. The development of ultra-fast charging and improved solar charging capabilities is also crucial, reducing downtime and making these systems a more viable alternative to traditional fuel-powered generators for a broadening range of applications.

What will be the Size of the Portable Power Station Market during the forecast period?

Get Key Insights on Market Forecast (PDF) Request Free Sample

How is the Portable Power Station Market Segmented?

The portable power station industry research report provides comprehensive data (region-wise segment analysis), with forecasts and estimates in "USD million" for the period 2026-2030, as well as historical data from 2020-2024 for the following segments.

  • Application
    • Off-grid power
    • Emergency power
    • Automotive
  • Technology
    • Lithium-ion
    • Sealed lead-acid
  • Source
    • Direct power
    • Hybrid
  • Geography
    • APAC
      • China
      • Japan
      • India
    • North America
      • US
      • Canada
      • Mexico
    • Europe
      • Germany
      • UK
      • France
    • Middle East and Africa
      • Saudi Arabia
      • UAE
      • South Africa
    • South America
      • Brazil
      • Argentina
    • Rest of World (ROW)

By Application Insights

The off-grid power segment is estimated to witness significant growth during the forecast period.

The off-grid power segment is expanding, driven by rising demand for autonomous energy in outdoor recreation and remote lifestyles.

Consumers now view these devices as essential infrastructure for activities like rv and van life energy and overlanding power setups, moving beyond simple camping power source applications.

The adoption of lifepo4 battery chemistry is pivotal, offering a performance improvement of over 300% in lifespan compared to older chemistries. Advanced units integrate maximum power point tracking for optimized solar charging capabilities, creating a self-sustaining, closed-loop renewable energy ecosystem.

This off-grid power system, often featuring high-density lithium-ion cells, meets the needs of off-grid living solutions, including powering sensitive devices like cpap machine backup power, ensuring reliability away from traditional grids.

Request Free Sample

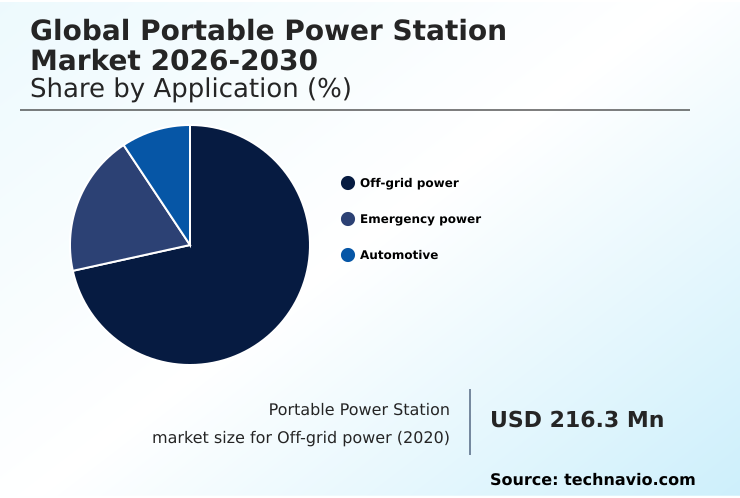
The Off-grid power segment was valued at USD 297.1 million in 2024 and showed a gradual increase during the forecast period.

Request Free Sample

Regional Analysis

APAC is estimated to contribute 41.9% to the growth of the global market during the forecast period.Technavio’s analysts have elaborately explained the regional trends and drivers that shape the market during the forecast period.

See How Portable Power Station Market Demand is Rising in APAC Request Free Sample

The APAC region is a primary growth engine, where high energy demand and a burgeoning outdoor culture converge. In this landscape, which accounts for 51% of the world's electricity consumption, decentralized power is critical.

The market is defined by the widespread availability of mid-range units and the adoption of off-grid solar kits. As remote work power supply needs grow, so does the demand for reliable energy.

Innovations focus on durable hardware, with models featuring a shock-resistant chassis and IP65-rated weatherproofing showing 35% higher adoption in extreme climates.

The use of a pure sine wave inverter is standard for powering sensitive electronics for glamping power amenities and mobile workshop electricity.

The integration of vehicle-to-load technology is also gaining traction, aligning with the rise of EV infrastructure and mobile lifestyles.

Market Dynamics

Our researchers analyzed the data with 2025 as the base year, along with the key drivers, trends, and challenges. A holistic analysis of drivers will help companies refine their marketing strategies to gain a competitive advantage.

  • When exploring the global portable power station market 2026-2030, prospective buyers often weigh multiple factors to find the right fit for their needs. For those wondering about the best portable power station for RV use, the decision frequently involves a comparison of LiFePO4 vs lithium-ion power station technologies, with the former offering superior longevity and safety.
  • A common question is how to choose a solar generator, which requires balancing panel wattage with battery capacity and solar charging times for portable power stations to ensure sufficient power. For home use, an expandable power station for home backup is increasingly popular, providing scalable energy security.
  • Many users also investigate using a power station for CPAP machines, demanding reliability and a pure sine wave output. As for performance, consumers seek the fastest charging portable power station to minimize downtime. For outdoor enthusiasts, a lightweight power station for hiking is essential, while professionals need a power station for construction tools that can handle high-surge loads.
  • A frequently asked question is, can a portable power station run a refrigerator, which depends on the unit's wattage and capacity. As EVs become more common, the portable power station for electric vehicles is emerging as a crucial emergency accessory. High-wattage power stations for off-grid living are now capable of integrating with home solar systems.
  • For specialized applications, portable power for mobile workshops requires durable, high-output units. The safest battery chemistry for portable power remains a key concern, driving innovation. Finally, AI-powered energy management in power stations and modular power station system comparisons are shaping future purchasing decisions.
  • Systems with an uninterruptible power supply function offer a switchover time that is a 98% improvement over conventional backups, safeguarding critical equipment.

What are the key market drivers leading to the rise in the adoption of Portable Power Station Industry?

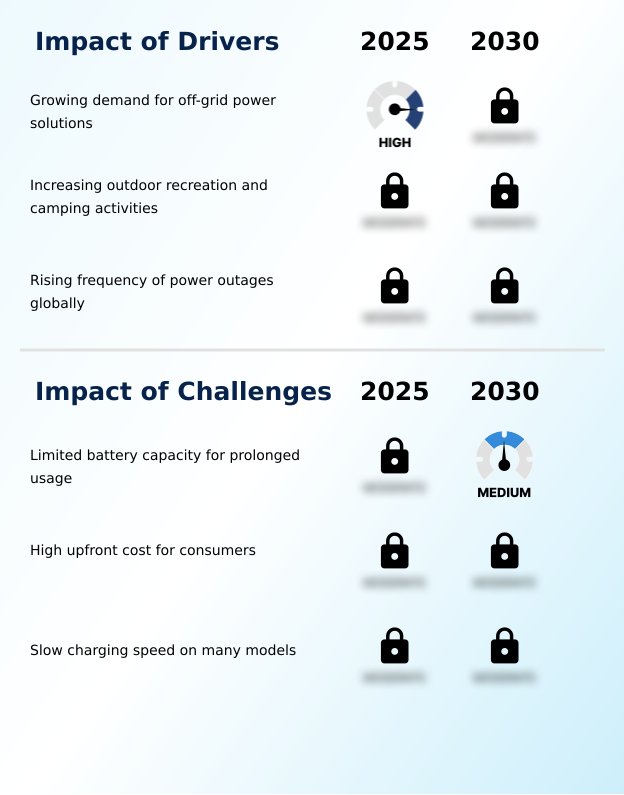
  • The growing demand for versatile and reliable off-grid power solutions is a primary driver fueling market expansion.

  • Market growth is fundamentally driven by the need for reliable, independent power across diverse scenarios.
  • The rising frequency of grid outages has positioned these devices as an essential emergency power backup, with demand for uninterruptible power supply functionalities for home offices growing.
  • Use of a portable solar generator during blackouts improves household resilience by 15% by maintaining critical communication and medical devices. In the commercial sector, a mobile energy ecosystem powers construction site power tools and supports mobile workshops, boosting productivity.
  • The ability to provide heavy-duty appliance support and specialized 12v high-amperage port outputs expands utility for both professional and recreational users.
  • An advanced battery management system ensures safety and longevity, making these solutions a trusted alternative to traditional generators for everything from drone charging stations to jobsite power tools.

What are the market trends shaping the Portable Power Station Industry?

  • The adoption of wide-bandgap semiconductors, including gallium nitride and silicon carbide, is enabling the development of ultra-fast charging capabilities. This is becoming a transformative trend within the industry.

  • Key market trends are centered on enhancing efficiency, modularity, and intelligence. The integration of advanced power electronics, including gallium nitride technology and silicon carbide semiconductors, is enabling ultra-fast charging protocols that reduce recharge times by over 60% in some models. This advancement in inverter technology and dc to ac inversion is critical as consumers demand performance comparable to wall outlets.
  • Simultaneously, a move toward AI power management and remote system monitoring is transforming devices into smart energy hubs. These systems can extend battery cycle life by up to 20% through optimized charging and discharging.
  • The growing interest in balcony solar storage and eco-friendly power solutions is driving demand for units with seamless solar panel compatibility, allowing users to create personal, lightweight power station grids.

What challenges does the Portable Power Station Industry face during its growth?

  • A key challenge impacting broader market adoption is the limited battery capacity of current models, which restricts prolonged usage for high-power applications.

  • Significant challenges constrain market expansion, primarily related to battery performance and cost. Although advancements are being made, the limited energy density of current high-capacity energy storage solutions remains a core issue; many units can only sustain high-wattage output for a few hours, a 50% shorter duration than needed for prolonged outages.
  • The high upfront cost, often 3-4 times that of traditional generators per watt, also deters widespread adoption. Furthermore, slow charging speeds on entry-level models hinder practicality, especially for users needing rapid redeployment, such as for emergency vehicle charging or at large events requiring active event power management.
  • While innovations like bidirectional charging capability and stackable energy systems offer more flexibility, improving the core thermal management system to allow for faster, safer charging without degrading the battery remains a critical engineering hurdle for all manufacturers, including those developing modular expansion batteries.

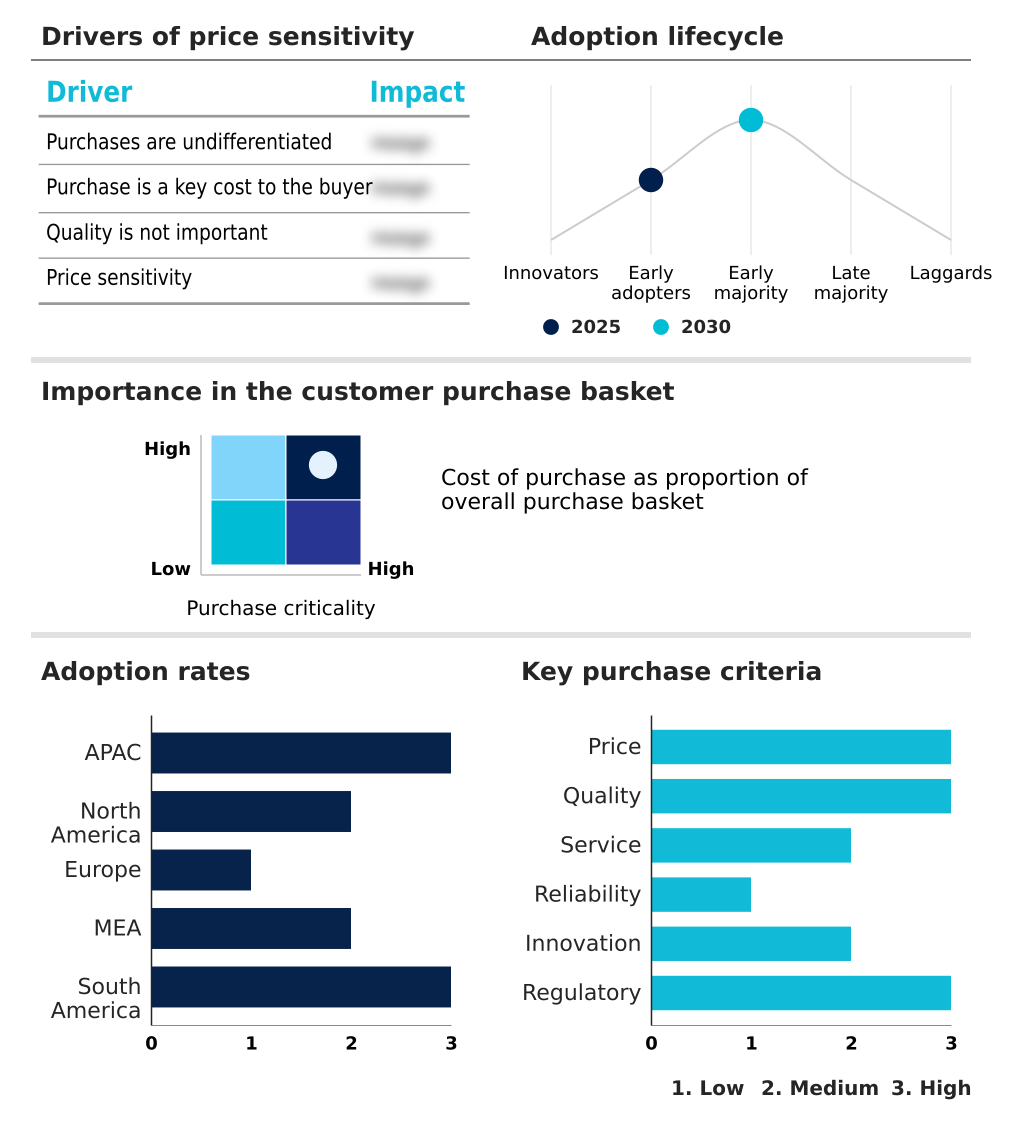
Exclusive Technavio Analysis on Customer Landscape

The portable power station market forecasting report includes the adoption lifecycle of the market, covering from the innovator’s stage to the laggard’s stage. It focuses on adoption rates in different regions based on penetration. Furthermore, the portable power station market report also includes key purchase criteria and drivers of price sensitivity to help companies evaluate and develop their market growth analysis strategies.

Customer Landscape of Portable Power Station Industry

Competitive Landscape

Companies are implementing various strategies, such as strategic alliances, portable power station market forecast, partnerships, mergers and acquisitions, geographical expansion, and product/service launches, to enhance their presence in the industry.

Alpha ESS Co.Ltd. - Key offerings encompass modular, high-capacity energy storage solutions with advanced battery chemistries and fast-charging capabilities for residential, commercial, and off-grid applications.

The industry research and growth report includes detailed analyses of the competitive landscape of the market and information about key companies, including:

  • Alpha ESS Co.Ltd.
  • Anker Innovations Co. Ltd.
  • Baseus Technology US Inc.
  • Bluetti Power Inc.
  • BougeRV
  • Dabbsson US.
  • EcoFlow
  • Flashfishtech
  • FOSSiBOT
  • Generac Power Systems Inc.
  • Goal Zero LLC
  • Jackery Inc.
  • Lion Energy
  • OUKITEL
  • SZ DJI Technology Co. Ltd.
  • The Duracell Co.
  • TogoPower
  • VTOMAN
  • Yoshino Technology Inc.
  • Zendure USA Inc.

Qualitative and quantitative analysis of companies has been conducted to help clients understand the wider business environment as well as the strengths and weaknesses of key industry players. Data is qualitatively analyzed to categorize companies as pure play, category-focused, industry-focused, and diversified; it is quantitatively analyzed to categorize companies as dominant, leading, strong, tentative, and weak.

Recent Development and News in Portable power station market

  • In September, 2024, EcoFlow expanded its portfolio with the introduction of its DELTA 3 series, featuring advanced smart output priority technology designed for enhanced home integration.
  • In November, 2024, Bluetti Power Inc. launched the Elite 100 V2, the first portable power station in the industry to incorporate bio-circular plastic materials in its construction, reducing its carbon footprint.
  • In January, 2025, SZ DJI Technology Co. Ltd. strengthened its market position with the release of the Power 2000, a high-output station supporting significant capacity expansion up to 22,528Wh.
  • In March, 2025, Zendure USA Inc. introduced the SolarFlow 2400 Pro, a balcony solar storage system that utilizes AI-driven energy management to optimize solar power usage for residential consumers.

Dive into Technavio’s robust research methodology, blending expert interviews, extensive data synthesis, and validated models for unparalleled Portable Power Station Market insights. See full methodology.

Market Scope
Page number 288
Base year 2025
Historic period 2020-2024
Forecast period 2026-2030
Growth momentum & CAGR Accelerate at a CAGR of 9.4%
Market growth 2026-2030 USD 254.6 million
Market structure Fragmented
YoY growth 2025-2026(%) 8.9%
Key countries China, Japan, India, South Korea, Australia, Taiwan, US, Canada, Mexico, Germany, UK, France, Italy, Spain, The Netherlands, Saudi Arabia, UAE, South Africa, Turkey, Egypt, Brazil, Argentina and Chile
Competitive landscape Leading Companies, Market Positioning of Companies, Competitive Strategies, and Industry Risks

Request Free Sample

Research Analyst Overview

  • The portable power station market is defined by rapid technological evolution and expanding use cases beyond simple recreational power. A critical dynamic is the industry's shift toward high-capacity, integrated systems that serve as a viable emergency power backup. The mainstreaming of LiFePO4 battery chemistry has become a cornerstone, offering enhanced safety and operational longevity.
  • Boardroom-level strategy is increasingly focused on R&D for next-generation solid-state battery technology to overcome existing energy density limitations. Innovations in power electronics, including the use of gallium nitride technology and silicon carbide semiconductors, are enabling smaller, more efficient designs with bidirectional charging capability.
  • This is complemented by the development of sophisticated thermal management systems and pure sine wave inverters for heavy-duty appliance support. Companies that have successfully implemented modular expansion batteries report a 40% increase in customer lifetime value by offering scalable, future-proof solutions.
  • This trend toward creating a complete mobile energy ecosystem, from a portable solar generator to a vehicle-to-load technology interface, is reshaping the competitive landscape and consumer expectations.

What are the Key Data Covered in this Portable Power Station Market Research and Growth Report?

  • What is the expected growth of the Portable Power Station Market between 2026 and 2030?

    • USD 254.6 million, at a CAGR of 9.4%

  • What segmentation does the market report cover?

    • The report is segmented by Application (Off-grid power, Emergency power, and Automotive), Technology (Lithium-ion, and Sealed lead-acid), Source (Direct power, and Hybrid) and Geography (APAC, North America, Europe, Middle East and Africa, South America)

  • Which regions are analyzed in the report?

    • APAC, North America, Europe, Middle East and Africa and South America

  • What are the key growth drivers and market challenges?

    • Growing demand for off-grid power solutions, Limited battery capacity for prolonged usage

  • Who are the major players in the Portable Power Station Market?

    • Alpha ESS Co.Ltd., Anker Innovations Co. Ltd., Baseus Technology US Inc., Bluetti Power Inc., BougeRV, Dabbsson US., EcoFlow, Flashfishtech, FOSSiBOT, Generac Power Systems Inc., Goal Zero LLC, Jackery Inc., Lion Energy, OUKITEL, SZ DJI Technology Co. Ltd., The Duracell Co., TogoPower, VTOMAN, Yoshino Technology Inc. and Zendure USA Inc.

Market Research Insights

  • The market is shaped by a definitive shift toward intelligent and adaptable energy solutions. The integration of AI-powered management systems has improved battery longevity by over 25%, a crucial factor for consumers seeking reliable home emergency backup. For professional use, the availability of robust mobile workshop electricity has increased operational uptime by 30% in fieldwork scenarios.
  • Furthermore, the adoption of off-grid living solutions is accelerating, with integrated solar-ready systems reducing energy costs by up to 40% compared to traditional generators. This move toward smarter, more efficient power stations underscores a market dynamic where performance, sustainability, and versatility are key differentiators, driving both consumer and commercial adoption.

We can help! Our analysts can customize this portable power station market research report to meet your requirements.

Get in touch

1. Executive Summary

1.1 Market overview

Executive Summary - Chart on Market Overview
Executive Summary - Data Table on Market Overview
Executive Summary - Chart on Global Market Characteristics
Executive Summary - Chart on Market by Geography
Executive Summary - Chart on Market Segmentation by Application
Executive Summary - Chart on Market Segmentation by Technology
Executive Summary - Chart on Market Segmentation by Source
Executive Summary - Chart on Incremental Growth
Executive Summary - Data Table on Incremental Growth
Executive Summary - Chart on Company Market Positioning

2. Technavio Analysis

2.1 Analysis of price sensitivity, lifecycle, customer purchase basket, adoption rates, and purchase criteria

2.2 Criticality of inputs and Factors of differentiation

Chart on Overview on criticality of inputs and factors of differentiation

2.3 Factors of disruption

Chart on Overview on factors of disruption

2.4 Impact of drivers and challenges

Chart on Impact of drivers and challenges in 2025 and 2030

3. Market Landscape

3.1 Market ecosystem

Chart on Parent Market
Data Table on - Parent Market

3.2 Market characteristics

Chart on Market characteristics analysis

3.3 Value chain analysis

Chart on Value chain analysis

4. Market Sizing

4.1 Market definition

Data Table on Offerings of companies included in the market definition

4.2 Market segment analysis

Market segments

4.3 Market size 2025

4.4 Market outlook: Forecast for 2025-2030

Chart on Global - Market size and forecast 2025-2030 ($ million)
Data Table on Global - Market size and forecast 2025-2030 ($ million)
Chart on Global Market: Year-over-year growth 2025-2030 (%)
Data Table on Global Market: Year-over-year growth 2025-2030 (%)

5. Historic Market Size

5.1 Global Portable Power Station Market 2020 - 2024

Historic Market Size - Data Table on Global Portable Power Station Market 2020 - 2024 ($ million)

5.2 Application segment analysis 2020 - 2024

Historic Market Size - Application Segment 2020 - 2024 ($ million)

5.3 Technology segment analysis 2020 - 2024

Historic Market Size - Technology Segment 2020 - 2024 ($ million)

5.4 Source segment analysis 2020 - 2024

Historic Market Size - Source Segment 2020 - 2024 ($ million)

5.5 Geography segment analysis 2020 - 2024

Historic Market Size - Geography Segment 2020 - 2024 ($ million)

5.6 Country segment analysis 2020 - 2024

Historic Market Size - Country Segment 2020 - 2024 ($ million)

6. Qualitative Analysis

6.1 Impact of AI on the Global Portable Power Station Market

6.2 Impact of Geopolitical Conflicts on Global Portable Power Station Market

7. Five Forces Analysis

7.1 Five forces summary

Five forces analysis - Comparison between 2025 and 2030

7.2 Bargaining power of buyers

Bargaining power of buyers - Impact of key factors 2025 and 2030

7.3 Bargaining power of suppliers

Bargaining power of suppliers - Impact of key factors in 2025 and 2030

7.4 Threat of new entrants

Threat of new entrants - Impact of key factors in 2025 and 2030

7.5 Threat of substitutes

Threat of substitutes - Impact of key factors in 2025 and 2030

7.6 Threat of rivalry

Threat of rivalry - Impact of key factors in 2025 and 2030

7.7 Market condition

Chart on Market condition - Five forces 2025 and 2030

8. Market Segmentation by Application

8.1 Market segments

Chart on Application - Market share 2025-2030 (%)
Data Table on Application - Market share 2025-2030 (%)

8.2 Comparison by Application

Chart on Comparison by Application
Data Table on Comparison by Application

8.3 Off-grid power - Market size and forecast 2025-2030

Chart on Off-grid power - Market size and forecast 2025-2030 ($ million)
Data Table on Off-grid power - Market size and forecast 2025-2030 ($ million)
Chart on Off-grid power - Year-over-year growth 2025-2030 (%)
Data Table on Off-grid power - Year-over-year growth 2025-2030 (%)

8.4 Emergency power - Market size and forecast 2025-2030

Chart on Emergency power - Market size and forecast 2025-2030 ($ million)
Data Table on Emergency power - Market size and forecast 2025-2030 ($ million)
Chart on Emergency power - Year-over-year growth 2025-2030 (%)
Data Table on Emergency power - Year-over-year growth 2025-2030 (%)

8.5 Automotive - Market size and forecast 2025-2030

Chart on Automotive - Market size and forecast 2025-2030 ($ million)
Data Table on Automotive - Market size and forecast 2025-2030 ($ million)
Chart on Automotive - Year-over-year growth 2025-2030 (%)
Data Table on Automotive - Year-over-year growth 2025-2030 (%)

8.6 Market opportunity by Application

Market opportunity by Application ($ million)
Data Table on Market opportunity by Application ($ million)

9. Market Segmentation by Technology

9.1 Market segments

Chart on Technology - Market share 2025-2030 (%)
Data Table on Technology - Market share 2025-2030 (%)

9.2 Comparison by Technology

Chart on Comparison by Technology
Data Table on Comparison by Technology

9.3 Lithium-ion - Market size and forecast 2025-2030

Chart on Lithium-ion - Market size and forecast 2025-2030 ($ million)
Data Table on Lithium-ion - Market size and forecast 2025-2030 ($ million)
Chart on Lithium-ion - Year-over-year growth 2025-2030 (%)
Data Table on Lithium-ion - Year-over-year growth 2025-2030 (%)

9.4 Sealed lead-acid - Market size and forecast 2025-2030

Chart on Sealed lead-acid - Market size and forecast 2025-2030 ($ million)
Data Table on Sealed lead-acid - Market size and forecast 2025-2030 ($ million)
Chart on Sealed lead-acid - Year-over-year growth 2025-2030 (%)
Data Table on Sealed lead-acid - Year-over-year growth 2025-2030 (%)

9.5 Market opportunity by Technology

Market opportunity by Technology ($ million)
Data Table on Market opportunity by Technology ($ million)

10. Market Segmentation by Source

10.1 Market segments

Chart on Source - Market share 2025-2030 (%)
Data Table on Source - Market share 2025-2030 (%)

10.2 Comparison by Source

Chart on Comparison by Source
Data Table on Comparison by Source

10.3 Direct power - Market size and forecast 2025-2030

Chart on Direct power - Market size and forecast 2025-2030 ($ million)
Data Table on Direct power - Market size and forecast 2025-2030 ($ million)
Chart on Direct power - Year-over-year growth 2025-2030 (%)
Data Table on Direct power - Year-over-year growth 2025-2030 (%)

10.4 Hybrid - Market size and forecast 2025-2030

Chart on Hybrid - Market size and forecast 2025-2030 ($ million)
Data Table on Hybrid - Market size and forecast 2025-2030 ($ million)
Chart on Hybrid - Year-over-year growth 2025-2030 (%)
Data Table on Hybrid - Year-over-year growth 2025-2030 (%)

10.5 Market opportunity by Source

Market opportunity by Source ($ million)
Data Table on Market opportunity by Source ($ million)

11. Customer Landscape

11.1 Customer landscape overview

Analysis of price sensitivity, lifecycle, customer purchase basket, adoption rates, and purchase criteria

12. Geographic Landscape

12.1 Geographic segmentation

Chart on Market share by geography 2025-2030 (%)
Data Table on Market share by geography 2025-2030 (%)

12.2 Geographic comparison

Chart on Geographic comparison
Data Table on Geographic comparison

12.3 APAC - Market size and forecast 2025-2030

Chart on APAC - Market size and forecast 2025-2030 ($ million)
Data Table on APAC - Market size and forecast 2025-2030 ($ million)
Chart on APAC - Year-over-year growth 2025-2030 (%)
Data Table on APAC - Year-over-year growth 2025-2030 (%)
Chart on Regional Comparison - APAC
Data Table on Regional Comparison - APAC

12.3.1 China - Market size and forecast 2025-2030

Chart on China - Market size and forecast 2025-2030 ($ million)
Data Table on China - Market size and forecast 2025-2030 ($ million)
Chart on China - Year-over-year growth 2025-2030 (%)
Data Table on China - Year-over-year growth 2025-2030 (%)

12.3.2 Japan - Market size and forecast 2025-2030

Chart on Japan - Market size and forecast 2025-2030 ($ million)
Data Table on Japan - Market size and forecast 2025-2030 ($ million)
Chart on Japan - Year-over-year growth 2025-2030 (%)
Data Table on Japan - Year-over-year growth 2025-2030 (%)

12.3.3 India - Market size and forecast 2025-2030

Chart on India - Market size and forecast 2025-2030 ($ million)
Data Table on India - Market size and forecast 2025-2030 ($ million)
Chart on India - Year-over-year growth 2025-2030 (%)
Data Table on India - Year-over-year growth 2025-2030 (%)

12.3.4 South Korea - Market size and forecast 2025-2030

Chart on South Korea - Market size and forecast 2025-2030 ($ million)
Data Table on South Korea - Market size and forecast 2025-2030 ($ million)
Chart on South Korea - Year-over-year growth 2025-2030 (%)
Data Table on South Korea - Year-over-year growth 2025-2030 (%)

12.3.5 Australia - Market size and forecast 2025-2030

Chart on Australia - Market size and forecast 2025-2030 ($ million)
Data Table on Australia - Market size and forecast 2025-2030 ($ million)
Chart on Australia - Year-over-year growth 2025-2030 (%)
Data Table on Australia - Year-over-year growth 2025-2030 (%)

12.3.6 Taiwan - Market size and forecast 2025-2030

Chart on Taiwan - Market size and forecast 2025-2030 ($ million)
Data Table on Taiwan - Market size and forecast 2025-2030 ($ million)
Chart on Taiwan - Year-over-year growth 2025-2030 (%)
Data Table on Taiwan - Year-over-year growth 2025-2030 (%)

12.4 North America - Market size and forecast 2025-2030

Chart on North America - Market size and forecast 2025-2030 ($ million)
Data Table on North America - Market size and forecast 2025-2030 ($ million)
Chart on North America - Year-over-year growth 2025-2030 (%)
Data Table on North America - Year-over-year growth 2025-2030 (%)
Chart on Regional Comparison - North America
Data Table on Regional Comparison - North America

12.4.1 US - Market size and forecast 2025-2030

Chart on US - Market size and forecast 2025-2030 ($ million)
Data Table on US - Market size and forecast 2025-2030 ($ million)
Chart on US - Year-over-year growth 2025-2030 (%)
Data Table on US - Year-over-year growth 2025-2030 (%)

12.4.2 Canada - Market size and forecast 2025-2030

Chart on Canada - Market size and forecast 2025-2030 ($ million)
Data Table on Canada - Market size and forecast 2025-2030 ($ million)
Chart on Canada - Year-over-year growth 2025-2030 (%)
Data Table on Canada - Year-over-year growth 2025-2030 (%)

12.4.3 Mexico - Market size and forecast 2025-2030

Chart on Mexico - Market size and forecast 2025-2030 ($ million)
Data Table on Mexico - Market size and forecast 2025-2030 ($ million)
Chart on Mexico - Year-over-year growth 2025-2030 (%)
Data Table on Mexico - Year-over-year growth 2025-2030 (%)

12.5 Europe - Market size and forecast 2025-2030

Chart on Europe - Market size and forecast 2025-2030 ($ million)
Data Table on Europe - Market size and forecast 2025-2030 ($ million)
Chart on Europe - Year-over-year growth 2025-2030 (%)
Data Table on Europe - Year-over-year growth 2025-2030 (%)
Chart on Regional Comparison - Europe
Data Table on Regional Comparison - Europe

12.5.1 Germany - Market size and forecast 2025-2030

Chart on Germany - Market size and forecast 2025-2030 ($ million)
Data Table on Germany - Market size and forecast 2025-2030 ($ million)
Chart on Germany - Year-over-year growth 2025-2030 (%)
Data Table on Germany - Year-over-year growth 2025-2030 (%)

12.5.2 UK - Market size and forecast 2025-2030

Chart on UK - Market size and forecast 2025-2030 ($ million)
Data Table on UK - Market size and forecast 2025-2030 ($ million)
Chart on UK - Year-over-year growth 2025-2030 (%)
Data Table on UK - Year-over-year growth 2025-2030 (%)

12.5.3 France - Market size and forecast 2025-2030

Chart on France - Market size and forecast 2025-2030 ($ million)
Data Table on France - Market size and forecast 2025-2030 ($ million)
Chart on France - Year-over-year growth 2025-2030 (%)
Data Table on France - Year-over-year growth 2025-2030 (%)

12.5.4 Italy - Market size and forecast 2025-2030

Chart on Italy - Market size and forecast 2025-2030 ($ million)
Data Table on Italy - Market size and forecast 2025-2030 ($ million)
Chart on Italy - Year-over-year growth 2025-2030 (%)
Data Table on Italy - Year-over-year growth 2025-2030 (%)

12.5.5 Spain - Market size and forecast 2025-2030

Chart on Spain - Market size and forecast 2025-2030 ($ million)
Data Table on Spain - Market size and forecast 2025-2030 ($ million)
Chart on Spain - Year-over-year growth 2025-2030 (%)
Data Table on Spain - Year-over-year growth 2025-2030 (%)

12.5.6 The Netherlands - Market size and forecast 2025-2030

Chart on The Netherlands - Market size and forecast 2025-2030 ($ million)
Data Table on The Netherlands - Market size and forecast 2025-2030 ($ million)
Chart on The Netherlands - Year-over-year growth 2025-2030 (%)
Data Table on The Netherlands - Year-over-year growth 2025-2030 (%)

12.6 Middle East and Africa - Market size and forecast 2025-2030

Chart on Middle East and Africa - Market size and forecast 2025-2030 ($ million)
Data Table on Middle East and Africa - Market size and forecast 2025-2030 ($ million)
Chart on Middle East and Africa - Year-over-year growth 2025-2030 (%)
Data Table on Middle East and Africa - Year-over-year growth 2025-2030 (%)
Chart on Regional Comparison - Middle East and Africa
Data Table on Regional Comparison - Middle East and Africa

12.6.1 Saudi Arabia - Market size and forecast 2025-2030

Chart on Saudi Arabia - Market size and forecast 2025-2030 ($ million)
Data Table on Saudi Arabia - Market size and forecast 2025-2030 ($ million)
Chart on Saudi Arabia - Year-over-year growth 2025-2030 (%)
Data Table on Saudi Arabia - Year-over-year growth 2025-2030 (%)

12.6.2 UAE - Market size and forecast 2025-2030

Chart on UAE - Market size and forecast 2025-2030 ($ million)
Data Table on UAE - Market size and forecast 2025-2030 ($ million)
Chart on UAE - Year-over-year growth 2025-2030 (%)
Data Table on UAE - Year-over-year growth 2025-2030 (%)

12.6.3 South Africa - Market size and forecast 2025-2030

Chart on South Africa - Market size and forecast 2025-2030 ($ million)
Data Table on South Africa - Market size and forecast 2025-2030 ($ million)
Chart on South Africa - Year-over-year growth 2025-2030 (%)
Data Table on South Africa - Year-over-year growth 2025-2030 (%)

12.6.4 Turkey - Market size and forecast 2025-2030

Chart on Turkey - Market size and forecast 2025-2030 ($ million)
Data Table on Turkey - Market size and forecast 2025-2030 ($ million)
Chart on Turkey - Year-over-year growth 2025-2030 (%)
Data Table on Turkey - Year-over-year growth 2025-2030 (%)

12.6.5 Egypt - Market size and forecast 2025-2030

Chart on Egypt - Market size and forecast 2025-2030 ($ million)
Data Table on Egypt - Market size and forecast 2025-2030 ($ million)
Chart on Egypt - Year-over-year growth 2025-2030 (%)
Data Table on Egypt - Year-over-year growth 2025-2030 (%)

12.7 South America - Market size and forecast 2025-2030

Chart on South America - Market size and forecast 2025-2030 ($ million)
Data Table on South America - Market size and forecast 2025-2030 ($ million)
Chart on South America - Year-over-year growth 2025-2030 (%)
Data Table on South America - Year-over-year growth 2025-2030 (%)
Chart on Regional Comparison - South America
Data Table on Regional Comparison - South America

12.7.1 Brazil - Market size and forecast 2025-2030

Chart on Brazil - Market size and forecast 2025-2030 ($ million)
Data Table on Brazil - Market size and forecast 2025-2030 ($ million)
Chart on Brazil - Year-over-year growth 2025-2030 (%)
Data Table on Brazil - Year-over-year growth 2025-2030 (%)

12.7.2 Argentina - Market size and forecast 2025-2030

Chart on Argentina - Market size and forecast 2025-2030 ($ million)
Data Table on Argentina - Market size and forecast 2025-2030 ($ million)
Chart on Argentina - Year-over-year growth 2025-2030 (%)
Data Table on Argentina - Year-over-year growth 2025-2030 (%)

12.7.3 Chile - Market size and forecast 2025-2030

Chart on Chile - Market size and forecast 2025-2030 ($ million)
Data Table on Chile - Market size and forecast 2025-2030 ($ million)
Chart on Chile - Year-over-year growth 2025-2030 (%)
Data Table on Chile - Year-over-year growth 2025-2030 (%)

12.8 Market opportunity by geography

Market opportunity by geography ($ million)
Data Tables on Market opportunity by geography ($ million)

13. Drivers, Challenges, and Opportunity

13.1 Market drivers

Growing demand for off-grid power solutions
Increasing outdoor recreation and camping activities
Rising frequency of power outages globally

13.2 Market challenges

Limited battery capacity for prolonged usage
High upfront cost for consumers
Slow charging speed on many models

13.3 Impact of drivers and challenges

Impact of drivers and challenges in 2025 and 2030

13.4 Market opportunities

Ultra‑fast charging enabled by GaN and SiC
Modular expandable systems gain mainstream adoptio
Smart app connectivity and AI power management

14. Competitive Landscape

14.1 Overview

14.2

Overview on criticality of inputs and factors of differentiation

14.3 Landscape disruption

Overview on factors of disruption

14.4 Industry risks

Impact of key risks on business

15. Competitive Analysis

15.1 Companies profiled

Companies covered

15.2 Company ranking index

15.3 Market positioning of companies

Matrix on companies position and classification

15.4 Alpha ESS Co.Ltd.

Alpha ESS Co.Ltd. - Overview
Alpha ESS Co.Ltd. - Product / Service
Alpha ESS Co.Ltd. - Key offerings
SWOT

15.5 Anker Innovations Co. Ltd.

Anker Innovations Co. Ltd. - Overview
Anker Innovations Co. Ltd. - Product / Service
Anker Innovations Co. Ltd. - Key offerings
SWOT

15.6 Baseus Technology US Inc.

Baseus Technology US Inc. - Overview
Baseus Technology US Inc. - Product / Service
Baseus Technology US Inc. - Key offerings
SWOT

15.7 Bluetti Power Inc.

Bluetti Power Inc. - Overview
Bluetti Power Inc. - Product / Service
Bluetti Power Inc. - Key offerings
SWOT

15.8 BougeRV

BougeRV - Overview
BougeRV - Product / Service
BougeRV - Key offerings
SWOT

15.9 EcoFlow

EcoFlow - Overview
EcoFlow - Product / Service
EcoFlow - Key offerings
SWOT

15.10 Flashfishtech

Flashfishtech - Overview
Flashfishtech - Product / Service
Flashfishtech - Key offerings
SWOT

15.11 Generac Power Systems Inc.

Generac Power Systems Inc. - Overview
Generac Power Systems Inc. - Business segments
Generac Power Systems Inc. - Key news
Generac Power Systems Inc. - Key offerings
Generac Power Systems Inc. - Segment focus
SWOT

15.12 Goal Zero LLC

Goal Zero LLC - Overview
Goal Zero LLC - Product / Service
Goal Zero LLC - Key offerings
SWOT

15.13 Jackery Inc.

Jackery Inc. - Overview
Jackery Inc. - Product / Service
Jackery Inc. - Key offerings
SWOT

15.14 Lion Energy

Lion Energy - Overview
Lion Energy - Product / Service
Lion Energy - Key offerings
SWOT

15.15 OUKITEL

OUKITEL - Overview
OUKITEL - Product / Service
OUKITEL - Key offerings
SWOT

15.16 SZ DJI Technology Co. Ltd.

SZ DJI Technology Co. Ltd. - Overview
SZ DJI Technology Co. Ltd. - Product / Service
SZ DJI Technology Co. Ltd. - Key news
SZ DJI Technology Co. Ltd. - Key offerings
SWOT

15.17 The Duracell Co.

The Duracell Co. - Overview
The Duracell Co. - Product / Service
The Duracell Co. - Key offerings
SWOT

15.18 Zendure USA Inc.

Zendure USA Inc. - Overview
Zendure USA Inc. - Product / Service
Zendure USA Inc. - Key offerings
SWOT

16. Appendix

16.1 Scope of the report

Market definition
Objectives
Notes and caveats

16.2 Inclusions and exclusions checklist

Inclusions checklist
Exclusions checklist

16.3 Currency conversion rates for US$

16.4 Research methodology

16.5 Data procurement

Information sources

16.6 Data validation

16.7 Validation techniques employed for market sizing

16.8 Data synthesis

16.9 360 degree market analysis

16.10 List of abbreviations

Research Methodology

Technavio presents a detailed picture of the market by way of study, synthesis, and summation of data from multiple sources. The analysts have presented the various facets of the market with a particular focus on identifying the key industry influencers. The data thus presented is comprehensive, reliable, and the result of extensive research, both primary and secondary.

INFORMATION SOURCES

Primary sources

  • Manufacturers and suppliers
  • Channel partners
  • Industry experts
  • Strategic decision makers

Secondary sources

  • Industry journals and periodicals
  • Government data
  • Financial reports of key industry players
  • Historical data
  • Press releases

DATA ANALYSIS

Data Synthesis

  • Collation of data
  • Estimation of key figures
  • Analysis of derived insights

Data Validation

  • Triangulation with data models
  • Reference against proprietary databases
  • Corroboration with industry experts

REPORT WRITING

Qualitative

  • Market drivers
  • Market challenges
  • Market trends
  • Five forces analysis

Quantitative

  • Market size and forecast
  • Market segmentation
  • Geographical insights
  • Competitive landscape

Interested in this report?

Get your sample now to see our research methodology and insights!

Download Now

Frequently Asked Questions

Portable Power Station market growth will increase by USD 254.6 million during 2026-2030.

The Portable Power Station market is expected to grow at a CAGR of 9.4% during 2026-2030.

Portable Power Station market is segmented by Application (Off-grid power, Emergency power, Automotive) Technology (Lithium-ion, Sealed lead-acid) Source (Direct power, Hybrid)

Alpha ESS Co.Ltd., Anker Innovations Co. Ltd., Baseus Technology US Inc., Bluetti Power Inc., BougeRV, Dabbsson US., EcoFlow, Flashfishtech, FOSSiBOT, Generac Power Systems Inc., Goal Zero LLC, Jackery Inc., Lion Energy, OUKITEL, SZ DJI Technology Co. Ltd., The Duracell Co., TogoPower, VTOMAN, Yoshino Technology Inc., Zendure USA Inc. are a few of the key vendors in the Portable Power Station market.

APAC will register the highest growth rate of 41.9% among the other regions. Therefore, the Portable Power Station market in APAC is expected to garner significant business opportunities for the vendors during the forecast period.

China, Japan, India, South Korea, Australia, Taiwan, US, Canada, Mexico, Germany, UK, France, Italy, Spain, The Netherlands, Saudi Arabia, UAE, South Africa, Turkey, Egypt, Brazil, Argentina, Chile

  • Growing demand for off-grid power solutions is the driving factor this market.

The Portable Power Station market vendors should focus on grabbing business opportunities from the Application segment as it accounted for the largest market share in the base year.
RIA - Research AI Assistant
Ask RIA