
Preclinical Animal Behavior Market 2024-2028
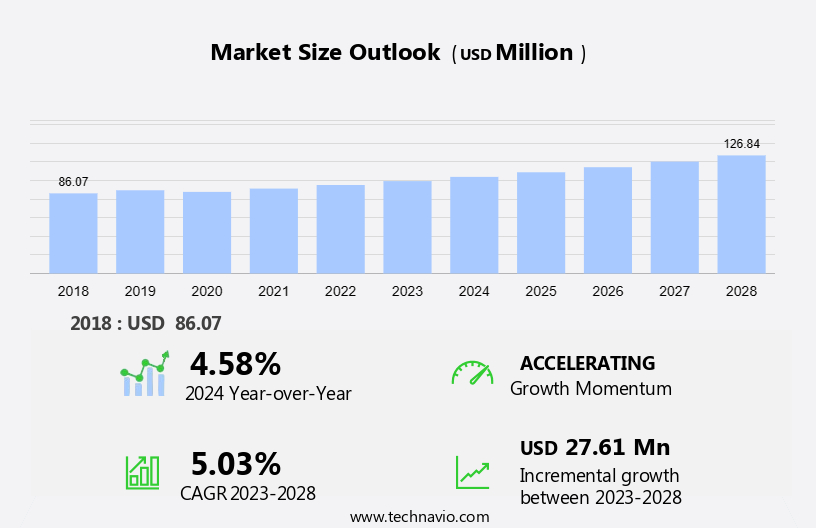
The global preclinical animal behavior market size is estimated to grow by USD 27.61 million, at a CAGR of 5.03% between 2023 and 2028.
The surge in global disease prevalence, including cardiovascular diseases, metabolic disorders, and cancer, is fueling the demand for innovative therapeutics. This has prompted increased preclinical and clinical research activities by pharmaceutical companies and Contract Research Organizations (CROs). Advanced omics-based technologies like genomics, proteomics, and metabolomics have gained attention, attracting investments from public and private funding organizations for drug development projects worldwide. Intense competition in drug development has led to the rapid adoption of advanced and automated workflows by pharmaceutical companies and CROs. Consequently, there is a growing need for sophisticated animal behavior monitoring equipment in preclinical research, offering automated, real-time monitoring for enhanced drug development studies. These trends are expected to propel the global preclinical animal behavior market's growth during the forecast period.
Technavio has segmented the market into application, end-user, and Geography
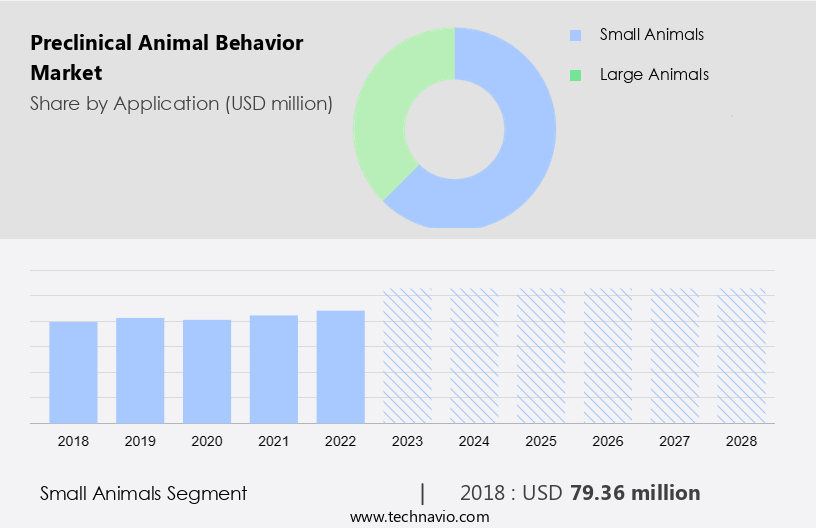
- The application segment is classified into small animals and large animals.
- The end-user segment is classified into industrial laboratories and CROs, Academic and government research laboratories.
- The geography segment includes key regions such as North America, Europe, Asia, and Rest of World (ROW)
It also includes an in-depth analysis of drivers, trends, and challenges. Our report examines historical data from 2018-2022, besides analyzing the current market scenario.
What will be the Size of the Preclinical Animal Behavior Market During the Forecast Period?
To learn more about this report, Download Report Sample
Preclinical Animal Behavior Market Segmentation by Application, End-user and Geography Analysis
Application Analysis
Small animals
The market share growth by the small animals segment will be significant during the forecast period. The small animal segment consists of equipment and apparatus used to monitor the behavioral patterns of small animals, such as mice, rabbits, rats, ferrets, hamsters, and Guinea pigs, during preclinical studies. Small animal behavior monitoring systems are miniaturized apparatuses that are small in size and light in weight and can be custom-configured and modified as per the research and testing requirements.
Get a glance at the market contribution of various segments Download PDF Sample
The small animals segment was the largest and was valued at USD 79.36 million in 2018. Furthermore, the availability of cost-effective, minimally-invasive, flexible systems is further adding to the growing sales of new systems used for monitoring behavior patterns in small animals during preclinical studies. During the forecast period, the market is expected to witness swift market growth and trends further, owing to the increasingly stringent regulatory standards for maintaining pharmacological safety and the growing availability of funding for research related to neuroscience, cardiology, metabolic disorders, and oncology. Therefore, the small animals segment is expected to grow and, in turn, foster the growth of the global preclinical animal behavior market during the forecast period.
End-user
Industrial laboratories and CROs
The industrial laboratories and CROs segment held a significant share of the market in 2023. Industrial laboratories, including pharmaceutical and biotechnology companies and contract research organizations (CROs), are among the key organizations that are involved in drug discovery, research, design, and development. These organizations have developed the infrastructure required to conduct preclinical and clinical studies for testing the drug candidates. The development of novel therapeutic candidates by these organizations, from a simple compound to a successful launch of medicine in the market, can be achieved only with a proper understanding of drug response in animal specimens during preclinical testing. Further, preclinical CROs exclusively test therapeutic candidates or medical devices for healthcare and biopharmaceutical companies before the devices or the therapeutic candidates undergo human or clinical trials. They offer services such as synthesizing drug compounds, running biochemical assays, as well as conducting animal studies. Hence, the industrial laboratories and CROs segment of the market is expected to grow during the forecast period.
Academic and government research laboratories
In 2023, the industrial laboratories and Contract Research Organizations (CROs) segment played a crucial role in the global preclinical animal behavior market. This sector, comprising pharmaceutical, biotechnology companies, and CROs, is instrumental in drug discovery and development. These entities conduct preclinical and clinical studies, relying extensively on preclinical animal behavior monitoring equipment. Such apparatus aids in real-time monitoring of physiological conditions and behavioral patterns during testing phases. Factors like the surge in clinical trials, drug research, and patent expiries drive animal-based preclinical research among industrial laboratories and CROs. Many pharmaceutical firms outsource preclinical research to CROs for cost-efficiency and access to diverse equipment. Biopharmaceutical companies increasingly rely on CROs to enhance Research and Development (R&D) productivity, further fueling the growth of the industrial laboratories and CROs segment in the market during the forecast period.
Regional Analysis
For more insights about the market share of various regions Download PDF Sample now!
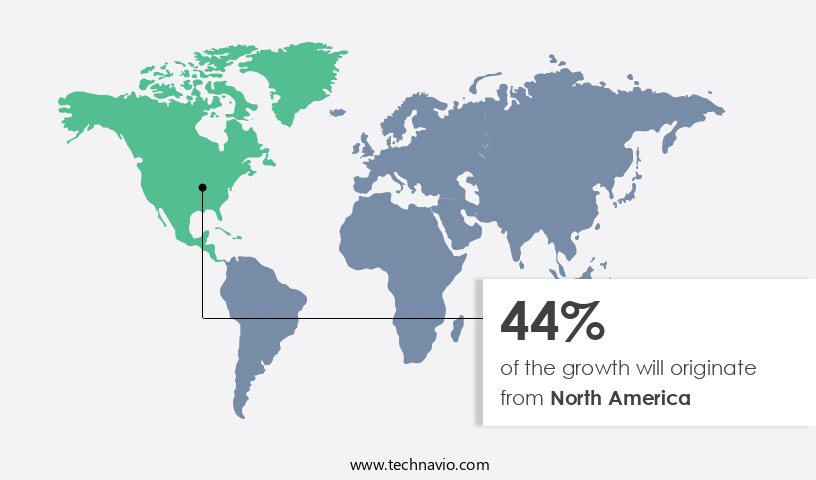
North America is estimated to contribute 44% to the growth of the global market during the forecast period. Technavio’s analysts have elaborately explained the regional trends and drivers that will shape the market during the forecast period. North America was the largest contributor to the market in 2023, with the US being the leading country in terms of revenue. Recent advances in pharmaceutical research, a growing focus on drug and vaccine discovery and development for treating various lifestyle diseases, and the presence of several vendors in the US offering a wide range of products are supporting the growth of the preclinical animal behavior market in the region. The presence of global vendors offering various products in the regional market is attributed to the market growth in the US, which is subsequently driving the market growth in North America. Moreover, the prevalence of various chronic diseases, such as cardiovascular diseases, is also rising in the region.
For instance, as per the Centers for Disease Control and Prevention (CDC), every year, about 735,000 Americans have a heart attack, among which 525,000 are a first heart attack, and 210,000 attacks occur in people who have already had a heart attack, which eventually triggers the demand for advanced therapeutics in North America. Hence, the rising prevalence of various chronic diseases increases the demand for research in various fields of the pharmaceutical sector. This, in turn, results in increasing the potential demand for systems and apparatus used for monitoring and studying preclinical animal behavior and, thus, drives the growth of the market in the region during the market forecast period.
Key Preclinical Animal Behavior Market Players
Companies are implementing various strategies, such as strategic alliances, partnerships, mergers and acquisitions, geographical expansion, and product/service launches, to enhance their presence in the market. The market analysis and report also includes detailed analyses of the competitive landscape of the market and information about 20 market companies, including:
ANY-maze - The company offers preclinical animal behavior solutions such as powerful tracking, class leading flexibility, and comprehensive analysis.
- Biobserve GmbH
- Columbus Instruments LLC
- Conduct Science Inc.
- Harvard Bioscience Inc.
- Imetronic
- Intellibio
- Kinder Scientific
- Mouse Specifics Inc
- Muromachi Kikai Co. Ltd.
- Noldus Information Technology bv
- O HARA and CO., LTD.
- Omnitech Electronics Inc.
- Orchid Scientific and Innovative India Pvt. Ltd.
- PhenoSys GmbH
- Sable Systems International
- San Diego Instruments Inc.
- Signal Solutions LLC
- Med Associates Inc.
- Tecniplast Spa
Qualitative and quantitative analysis of companies has been conducted to help clients understand the wider business environment as well as the strengths and weaknesses of key market players. Data is qualitatively analyzed to categorize companies as pure play, category-focused, industry-focused, and diversified; it is quantitatively analyzed to categorize companies as dominant, leading, strong, tentative, and weak.
Preclinical Animal Behavior Market: Key Drivers, Trends, Challenges, and Customer Landscape
There are multiple factors influencing market growth analysis. Our researchers analyzed the data with 2023 as the base year, along with the key drivers, market trends and analysis, and challenges.
Key Preclinical Animal Behavior Market Drivers
The increasing prevalence of various chronic diseases and disorders is notably driving the market growth. Cardiovascular diseases refer to several types of conditions that affect the heart and blood vessels. Many lifestyle changes, such as poor dietary habits that lead to increased cholesterol and obesity, are leading to risk factors such as high blood pressure and diabetes, which are significantly contributing to the prevalence of cardiovascular diseases as well. Moreover, the prevalence of various diseases, including cardiovascular and respiratory diseases, is high among the geriatric population. Moreover, the risks associated with changing lifestyles include disorders such as diabetes, obesity, and respiratory disorders owing to the increasing habit of smoking are also on the rise. Hence, the rising prevalence of various chronic diseases increases the demand for research in various fields of the pharmaceutical sector, which, in turn, is expected to drive market growth.
Moreover, the increase in the number of people with various chronic diseases and disorders is resulting in growing research, increasing potential demand for systems and apparatus used for monitoring and studying preclinical animal behavior. Therefore, such factors are expected to drive the growth of the global preclinical animal behavior market during the forecast period.
Significant Preclinical Animal Behavior Market Trends
Innovations in animal behavior tracking systems are an emerging trend shaping market growth. Improved animal behavior tracking systems enhance research capabilities, improve data collection, and foster a more accurate and comprehensive analysis. The improved tracking accuracy also leads to more precise and sophisticated tracking systems, which enables scientists to monitor animal behavior better in real time and across various environments. The enhanced precision of these tracking systems makes the collection of animal behavioral data more detailed and accurate and contributes to a deeper understanding of animal responses to stimuli or treatments.
For instance, EthoVision XT, a video tracking software, tracks and analyzes the behavior, movement, and activity of any animal. This software is ideal for studying specific behaviors in rodents, such as freezing, rearing, or grooming. Therefore, the development of such innovative tracking systems will drive the growth of the global preclinical animal behavior market during the forecast period.
Major Preclinical Animal Behavior Market Challenges
Challenges associated with conducting behavioral studies in animals are a significant challenge hindering market growth. The foundation of preclinical assessment, particularly in neuroscience research, relies heavily on rodent behavior evaluation. The advent of digitization in the medical field has enabled scientists to access and quantify a myriad of behavioral variables using computation, vision, and deep learning. However, the field of behavioral neuroethology is still emerging, lacking consolidated methods and facing challenges in algorithm transferability between laboratories. Benchmarking experiments and well-annotated behavior datasets are crucial but insufficient.
Additionally, animal studies, while beneficial, face limitations in replicating human trials, stemming from experimental design issues, methodological imprecision, and challenges in extrapolating results from animal models to humans. These practical challenges are anticipated to impede the market growth and forecasting of the global preclinical animal behavior market in the forecast period.
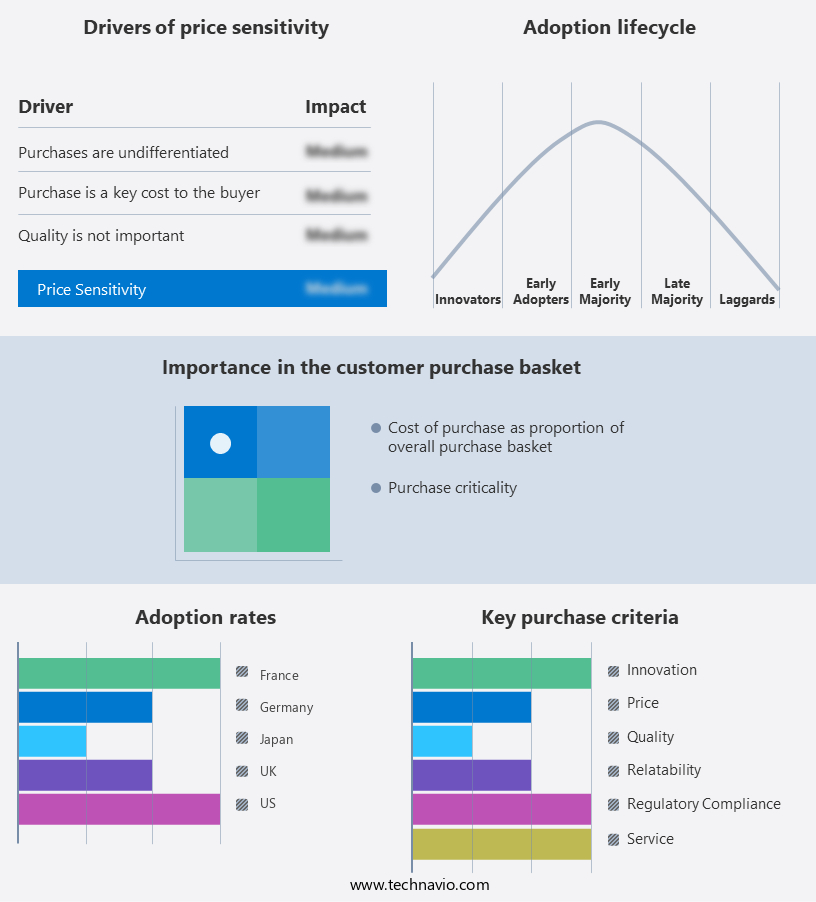
Key Preclinical Animal Behavior Market Customer Landscape
The market report includes the adoption lifecycle of the market, covering from the innovator’s stage to the laggard’s stage. It focuses on adoption rates in different regions based on penetration. Furthermore, the report also includes key purchase criteria and drivers of price sensitivity to help companies evaluate and develop their market research and growth strategies.
Global Preclinical Animal Behavior Market Customer Landscape
Segment Overview
The preclinical animal behavior market report forecasts market growth by revenue at global, regional & country levels and provides an analysis of the latest trends and growth opportunities from 2018 to 2028.
- Application Outlook
- Small animals
- Large animals
- End-user Outlook
- Industrial laboratories and CROs
- Academic and government research laboratories
- Region Outlook
- North America
- The U.S.
- Canada
- Europe
- The U.K.
- Germany
- France
- Rest of Europe
- Asia
- China
- India
- Rest of World (ROW)
- Brazil
- Argentina
- Australia
- North America
|
Preclinical Animal Behavior Market Scope |
|
|
Report Coverage |
Details |
|
Page number |
155 |
|
Base year |
2023 |
|
Historic period |
2018-2022 |
|
Market forecasting period |
2024-2028 |
|
Growth momentum & CAGR |
Accelerate at a CAGR of 5.03% |
|
Market Growth 2024-2028 |
USD 27.61 million |
|
Market structure |
Fragmented |
|
YoY growth 2023-2024(%) |
4.58 |
|
Regional analysis |
North America, Europe, Asia, and Rest of World (ROW) |
|
Performing market contribution |
North America at 44% |
|
Key countries |
US, Germany, France, UK, and Japan |
|
Competitive landscape |
Leading Companies, Market Positioning of Companies, Competitive Strategies, and Industry Risks |
|
Key companies profiled |
ANY-maze, Biobserve GmbH, Columbus Instruments LLC, Conduct Science Inc., Harvard Bioscience Inc., Imetronic, Intellibio, Kinder Scientific, Mouse Specifics Inc., Muromachi Kikai Co. Ltd., Noldus Information Technology bv, O HARA and CO., LTD., Omnitech Electronics Inc., Orchid Scientific and Innovative India Pvt. Ltd., PhenoSys GmbH, Sable Systems International, San Diego Instruments Inc., Signal Solutions LLC, Med Associates Inc., and Tecniplast Spa |
|
Market dynamics |
Parent market analysis, Market growth inducers and obstacles, Fast-growing and slow-growing segment analysis, COVID-19 impact and recovery analysis and future consumer dynamics, Market condition analysis for the forecast period. |
|
Customization purview |
If our report has not included the data that you are looking for, you can reach out to our analysts and get segments customized. |
Download Sample PDF at your Fingertips
What are the Key Data Covered in this Preclinical Animal Behavior Market Research Report?
- CAGR of the market during the forecast period
- Detailed information on factors that will drive the growth of the preclinical animal behavior market between 2024 and 2028
- Precise estimation of the preclinical animal behavior market size and its contribution of the market in focus to the parent market
- Detailed analysis of customer landscape covering Diver of price sensitivity, Adoption of the lifecycle, and key purchase criteria
- Companies landscape comparing criticality of inputs and factors of differentiation
- Exclusive Matrix on companies position and classification
- Accurate predictions about upcoming trends and changes in consumer behavior
- Growth of the market across North America, Europe, Asia, and Rest of World (ROW)
- Thorough analysis of the market’s competitive landscape and detailed information about companies
- Comprehensive analysis of factors that will challenge the growth of preclinical animal behavior market companies
We can help! Our analysts can customize this market research report to meet your requirements. Get in touch
 RIA -
RIA - 
