Probiotic Ingredients Market Analysis APAC, Europe, North America, Middle East and Africa, South America - US, Japan, China, Germany, UK - Size and Forecast 2024-2028

Probiotic Ingredients Market Analysis APAC, Europe, North America, Middle East and Africa, South America - US, Japan, China, Germany, UK - Size and Forecast 2024-2028

Published: Jan 2024 165 Pages SKU: IRTNTR72282

Market Overview at a Glance

$3 B
Market Opportunity
8.51%
CAGR
7.87
YoY growth 2023-2024(%)

Probiotic Ingredients Market Forecast 2024-2028

The probiotic ingredients market size is projected to increase by USD 3.00 billion, at a CAGR of 8.51% between 2023 and 2028.

The APAC probiotic ingredients market is witnessing substantial growth, driven by rising adoption of probiotic components, a plethora of producers, and concentrated production. Both developing and developed economies such as Australia, China, India, Japan, and South Korea are experiencing an upswing in the middle-class population and urbanization, creating diverse opportunities for major industry players. The surge in demand for nutritious food, influenced by busy lifestyles and wellness concerns, is a pivotal factor contributing to the expansion of the probiotic ingredients sector in the region. Increased disposable income, coupled with the availability of probiotic products in various forms through online and offline retail outlets, further fuels heightened consumption. This aligns with global trends, reinforcing positive forecasts and market analysis for the APAC probiotic ingredients market.

Market: Overview

Probiotic Ingredients Market Size

The market shows an Accelerated CAGR during the forecast period.

To get additional information about the market report, Request Free Sample

 Market Growth Analysis Driver 

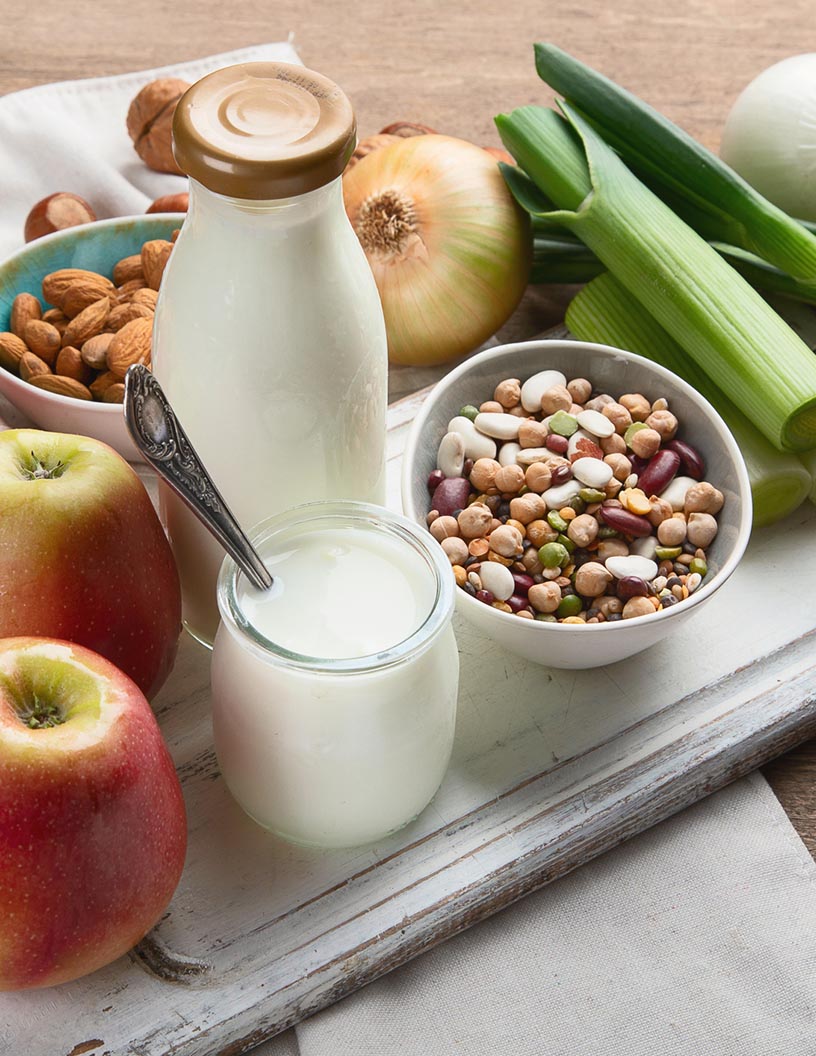
Rising awareness about the benefits of probiotic supplements is the key factor driving market growth. Probiotics are live microorganisms that can be consumed through fermented foods or supplement products. The consumption of probiotic supplements prevents the growth of harmful bacteria inside the digestive tract, leading to an improvement in nutrient absorption and bowel movements. These supplements are widely known for their ability to prevent diarrhea or reduce its severity. The consumption of commercial probiotic products improves the interstitial microbial balance by lowering the pH levels.

Further, studies have shown that the consumption of probiotic yogurt protects the immune system against colon, bladder, and breast cancers. The consumption of probiotics also helps to reduce dental caries, prevents oral candida infections, and manages periodontitis. Due to these health benefits, the demand for probiotic ingredients is expected to increase globally, which in turn will drive the growth of the market during the forecast period.

 Market Growth and Trends 

Growing focus on customized solutions is the primary trend shaping market growth. Consumers are increasingly adopting personalized diets. Personalized nutrition offers growth opportunities to the manufacturers of food and beverage and dietary supplements. The rising awareness among consumers has led to personalization in the use of probiotics based on lifestyle and wellness programs. Several companies offer microbiome sequencing services to consumers, through which they can understand their gut problems, and based on that, they can go for a personalized diet.

Furthermore, aligned with market trends and analysis, many manufacturers are tailoring formulas based on individual needs. For example, Biena, a manufacturer of probiotic ingredients, offers tailor-made formulations for specific applications, which include the use of nutraceuticals in food and dairy processing and dietary supplements for natural health product formulations. Owing to such factors, the global probiotic ingredients market is expected to witness growth during the forecast period.

Market Challenge 

Production difficulties and instability of probiotic strains is a challenge that affects market growth. The production of probiotic cultures is a complicated process that involves fermentation, concentration, and lyophilization. The quality and viability of probiotic strains depend on the colony-forming units (CFU). The viability of strains should be ensured before they are formulated. This is because the count of active probiotic cells in the lyophilized bacteria decreases due to high compression, heat, and mixing. This is a major challenge for probiotic ingredient manufacturers.

Additionally, the instability of probiotic cultures is one of the major challenges in the market in the Americas. Most probiotic cultures available in the market are unstable at room temperature; therefore, proper refrigeration or microencapsulation is needed. Probiotics are unable to survive in the acidic pH of the stomach and cannot colonize in the gut. Thus, such factors hinder the manufacturing of probiotic strains, which is negatively affecting market growth during the forecast period.

Market Segmentation by Source

Bacteria remained the leading source in the global probiotic ingredients market, driving significant growth. The majority of probiotic components such as Lactobacillus, Bifidobacterium, Streptococcus, and others are obtained from bacterial strains, specifically Lactobacillus and Bifidobacterium. These bacteria provide several health benefits, including better gut health, immune system support, and overall well-being. Additionally, as demand for functional foods and supplements rises and consumers become more aware of the importance of gut health, bacterial-derived probiotic ingredients are projected to maintain their global market leadership, which in turn is expected to drive the growth of the market during the forecast period.

Market Segmentation by Application

The market share growth by the food and beverages segment will be significant during the forecast period. The F&B segment is expected to witness steady growth owing to the growing popularity of health and wellness food and beverages. People are looking for several supplements in their diets. Consumers globally are significantly striving to improve their digestive wellness and overall health and are increasing their focus on functional foods and drinks. 

Probiotic Ingredients Market Size

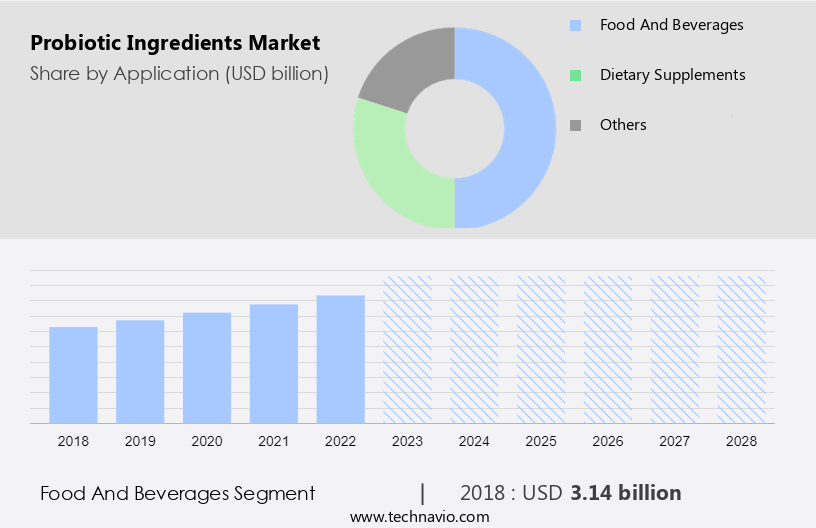
The food and beverages segment was valued at USD 3.14 billion in 2018. 

For a detailed summary of the market segments Request for Sample Report

Additionally, the increasing awareness about the health benefits of probiotics F&B is driving their consumption globally. In countries such as the US, Canada, and Brazil, a variety of probiotic products, ranging from fortified drinks to candies containing strains from the Lactobacillus and Bifidobacterium genera, are available in supermarkets. Such factors are driving the demand for probiotic ingredients in the F&B segment, which in turn is expected to drive the growth of the market during the forecast period.

Key Regions for the Market

Probiotic Ingredients Market Share by Geography

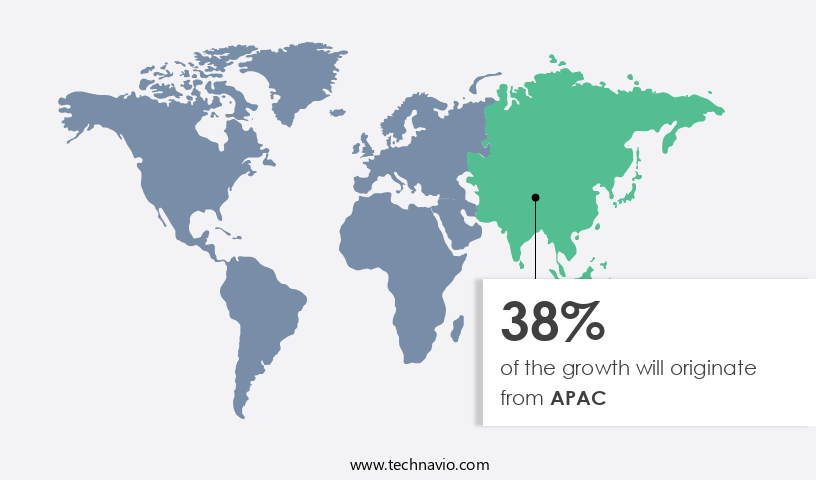
APAC is estimated to contribute 38% to the growth of the global market during the forecast period

Get a glance at the market share of various regions View PDF Sample

Technavio's analysts have provided extensive insight into the market forecasting, detailing the regional trends and drivers influencing the market's trajectory throughout the forecast period. The rising use of probiotic ingredients, the existence of a large number of producers, and concentrated production have driven the growth of the market in APAC. Developing and developed economies such as Australia, China, India, Japan, and South Korea are witnessing an increase in the middle-class population and urbanization, which presents various chances for major industry participants in the probiotic ingredients market. Furthermore, the growth of the probiotic ingredients industry in the region is being driven by an increase in purchasing power and increasing expenditure by millennials on nutrition-rich food. Such factors are expected to drive the growth of the probiotic ingredients market in the region during the forecast period.

Company Overview

Companies are implementing various strategies, such as strategic alliances, partnerships, mergers and acquisitions, geographical expansion, and product/service launches, to enhance their presence in the market forecasting growth and analysis.

  • Key Offering- Biena Inc.: The company offers probiotic ingredients which is considered medicinal, the site has obtained cGMP certification.
  • Key Offering- BIOCODEX SAS: The company offers probiotic ingredients such as Bifidobacterium bifidum, Bifidobacterium breve, Lactobacillus acidophilus, Lactococcus lactis, and more.

The  market growth and forecasting report also includes detailed analyses of the competitive landscape of the market and information about 10 market companies, including:

Archer Daniels Midland Co., BioGaia AB, Chr Hansen Holding AS, CUSTOM PROBIOTICS Inc., Danone SA, DuPont de Nemours Inc., Kerry Group Plc, Novozymes OneHealth, Sabinsa Corp., Thermo Fisher Scientific Inc., Unique Biotech Ltd., Winclove BV, Lallemand Inc., American Biosystems Inc., Nutris, Orffa International Holding B.V., Probi AB, and Probiotical S.p.A.

The market analysis and report of qualitative and quantitative analysis of companies have been conducted to help clients understand the wider business environment as well as the strengths and weaknesses of key market players. Data is qualitatively analyzed to categorize companies as pure play, category-focused, industry-focused, and diversified; it is quantitatively analyzed to categorize companies as dominant, leading, strong, tentative, and weak.

Segment Overview

The research report forecasts market research and growth by revenue at global, regional & country levels and provides an analysis of the latest trends and growth opportunities from 2018 to 2028. 

  • Application Outlook
    • Food and beverages
    • Dietary supplements
    • Others
  • Source Outlook
    • Bacteria
    • Yeast
  • Region Outlook
    • North America
      • The U.S.
      • Canada
    • Europe
      • U.K.
      • Germany
      • France
      • Rest of Europe
    • APAC
      • China
      • India
    • South America
      • Chile
      • Argentina
      • Brazil
    • Middle East & Africa
      • Saudi Arabia
      • South Africa
      • Rest of the Middle East & Africa

Probiotic Ingredients Market Scope

Report Coverage

Details

Page number

165

Base year

2023

Historic period

2018-2022

Forecast period

2024-2028

Growth momentum & CAGR

Accelerate at a CAGR of 8.51%

Market growth 2024-2028

USD 3.00 billion

Market structure

Fragmented

YoY growth 2023-2024(%)

7.87

Regional analysis

APAC, Europe, North America, Middle East and Africa, and South America

Performing market contribution

APAC at 38%

Key countries

US, Japan, China, Germany, and UK

Competitive landscape

Leading Companies, Market Positioning of Companies, Competitive Strategies, and Industry Risks

Key companies profiled

Archer Daniels Midland Co., Biena Inc., BIOCODEX SAS, BioGaia AB, Chr Hansen Holding AS, CUSTOM PROBIOTICS Inc., Danone SA, DuPont de Nemours Inc., Kerry Group Plc, Novozymes OneHealth, Sabinsa Corp., Thermo Fisher Scientific Inc., Unique Biotech Ltd., Winclove BV, Lallemand Inc., American Biosystems Inc., Nutris, Orffa International Holding B.V., Probi AB, and Probiotical S.p.A.

Market dynamics

Parent market analysis, Market growth inducers and obstacles, Fast-growing and slow-growing segment analysis, COVID-19 impact and recovery analysis and future consumer dynamics, Market condition analysis for the forecast period.

Customization purview

If our report has not included the data that you are looking for, you can reach out to our analysts and get segments customized.

BUY NOW Full Report and Discover more

What are the Key Data Covered in this Market Research Report?

  • CAGR of the market during the forecast period
  • Detailed information on factors that will drive the growth of the market between 2024 and 2028
  • Precise estimation of the market size and its contribution of the market in focus to the parent market
  • Accurate predictions about upcoming trends and changes in consumer behavior
  • Growth of the market across APAC, Europe, North America, Middle East and Africa, and South America
  • Thorough analysis of the market’s competitive landscape and detailed information about companies
  • Comprehensive analysis of factors that will challenge the growth of market companies

We can help! Our analysts can customize this market research report to meet your requirements. Get in touch

1 Executive Summary

  • 1.1 Market overview
    • Exhibit 01: Executive Summary – Chart on Market Overview
    • Exhibit 02: Executive Summary – Data Table on Market Overview
    • Exhibit 03: Executive Summary – Chart on Global Market Characteristics
    • Exhibit 04: Executive Summary – Chart on Market by Geography
    • Exhibit 05: Executive Summary – Chart on Market Segmentation by Application
    • Exhibit 06: Executive Summary – Chart on Market Segmentation by Source
    • Exhibit 07: Executive Summary – Chart on Incremental Growth
    • Exhibit 08: Executive Summary – Data Table on Incremental Growth
    • Exhibit 09: Executive Summary – Chart on Vendor Market Positioning

2 Market Landscape

  • 2.1 Market ecosystem
    • Exhibit 10: Parent market
    • Exhibit 11: Market Characteristics

3 Market Sizing

  • 3.1 Market definition
    • Exhibit 12: Offerings of vendors included in the market definition
  • 3.2 Market segment analysis
    • Exhibit 13: Market segments
  • 3.3 Market size 2023
    • 3.4 Market outlook: Forecast for 2023-2028
      • Exhibit 14: Chart on Global - Market size and forecast 2023-2028 ($ billion)
      • Exhibit 15: Data Table on Global - Market size and forecast 2023-2028 ($ billion)
      • Exhibit 16: Chart on Global Market: Year-over-year growth 2023-2028 (%)
      • Exhibit 17: Data Table on Global Market: Year-over-year growth 2023-2028 (%)

    4 Historic Market Size

    • 4.1 Global probiotic ingredients market 2018 - 2022
      • Exhibit 18: Historic Market Size – Data Table on global probiotic ingredients market 2018 - 2022 ($ billion)
    • 4.2 Application Segment Analysis 2018 - 2022
      • Exhibit 19: Historic Market Size – Application Segment 2018 - 2022 ($ billion)
    • 4.3 Source Segment Analysis 2018 - 2022
      • Exhibit 20: Historic Market Size – Source Segment 2018 - 2022 ($ billion)
    • 4.4 Geography Segment Analysis 2018 - 2022
      • Exhibit 21: Historic Market Size – Geography Segment 2018 - 2022 ($ billion)
    • 4.5 Country Segment Analysis 2018 - 2022
      • Exhibit 22: Historic Market Size – Country Segment 2018 - 2022 ($ billion)

    5 Five Forces Analysis

    • 5.1 Five forces summary
      • Exhibit 23: Five forces analysis - Comparison between 2023 and 2028
    • 5.2 Bargaining power of buyers
      • Exhibit 24: Chart on Bargaining power of buyers – Impact of key factors 2023 and 2028
    • 5.3 Bargaining power of suppliers
      • Exhibit 25: Bargaining power of suppliers – Impact of key factors in 2023 and 2028
    • 5.4 Threat of new entrants
      • Exhibit 26: Threat of new entrants – Impact of key factors in 2023 and 2028
    • 5.5 Threat of substitutes
      • Exhibit 27: Threat of substitutes – Impact of key factors in 2023 and 2028
    • 5.6 Threat of rivalry
      • Exhibit 28: Threat of rivalry – Impact of key factors in 2023 and 2028
    • 5.7 Market condition
      • Exhibit 29: Chart on Market condition - Five forces 2023 and 2028

    6 Market Segmentation by Application

    • 6.1 Market segments
      • Exhibit 30: Chart on Application - Market share 2023-2028 (%)
      • Exhibit 31: Data Table on Application - Market share 2023-2028 (%)
    • 6.2 Comparison by Application
      • Exhibit 32: Chart on Comparison by Application
      • Exhibit 33: Data Table on Comparison by Application
    • 6.3 Food and beverages - Market size and forecast 2023-2028
      • Exhibit 34: Chart on Food and beverages - Market size and forecast 2023-2028 ($ billion)
      • Exhibit 35: Data Table on Food and beverages - Market size and forecast 2023-2028 ($ billion)
      • Exhibit 36: Chart on Food and beverages - Year-over-year growth 2023-2028 (%)
      • Exhibit 37: Data Table on Food and beverages - Year-over-year growth 2023-2028 (%)
    • 6.4 Dietary supplements - Market size and forecast 2023-2028
      • Exhibit 38: Chart on Dietary supplements - Market size and forecast 2023-2028 ($ billion)
      • Exhibit 39: Data Table on Dietary supplements - Market size and forecast 2023-2028 ($ billion)
      • Exhibit 40: Chart on Dietary supplements - Year-over-year growth 2023-2028 (%)
      • Exhibit 41: Data Table on Dietary supplements - Year-over-year growth 2023-2028 (%)
    • 6.5 Others - Market size and forecast 2023-2028
      • Exhibit 42: Chart on Others - Market size and forecast 2023-2028 ($ billion)
      • Exhibit 43: Data Table on Others - Market size and forecast 2023-2028 ($ billion)
      • Exhibit 44: Chart on Others - Year-over-year growth 2023-2028 (%)
      • Exhibit 45: Data Table on Others - Year-over-year growth 2023-2028 (%)
    • 6.6 Market opportunity by Application
      • Exhibit 46: Market opportunity by Application ($ billion)
      • Exhibit 47: Data Table on Market opportunity by Application ($ billion)

    7 Market Segmentation by Source

    • 7.1 Market segments
      • Exhibit 48: Chart on Source - Market share 2023-2028 (%)
      • Exhibit 49: Data Table on Source - Market share 2023-2028 (%)
    • 7.2 Comparison by Source
      • Exhibit 50: Chart on Comparison by Source
      • Exhibit 51: Data Table on Comparison by Source
    • 7.3 Bacteria - Market size and forecast 2023-2028
      • Exhibit 52: Chart on Bacteria - Market size and forecast 2023-2028 ($ billion)
      • Exhibit 53: Data Table on Bacteria - Market size and forecast 2023-2028 ($ billion)
      • Exhibit 54: Chart on Bacteria - Year-over-year growth 2023-2028 (%)
      • Exhibit 55: Data Table on Bacteria - Year-over-year growth 2023-2028 (%)
    • 7.4 Yeast - Market size and forecast 2023-2028
      • Exhibit 56: Chart on Yeast - Market size and forecast 2023-2028 ($ billion)
      • Exhibit 57: Data Table on Yeast - Market size and forecast 2023-2028 ($ billion)
      • Exhibit 58: Chart on Yeast - Year-over-year growth 2023-2028 (%)
      • Exhibit 59: Data Table on Yeast - Year-over-year growth 2023-2028 (%)
    • 7.5 Market opportunity by Source
      • Exhibit 60: Market opportunity by Source ($ billion)
      • Exhibit 61: Data Table on Market opportunity by Source ($ billion)

    8 Customer Landscape

    • 8.1 Customer landscape overview
      • Exhibit 62: Analysis of price sensitivity, lifecycle, customer purchase basket, adoption rates, and purchase criteria

    9 Geographic Landscape

    • 9.1 Geographic segmentation
      • Exhibit 63: Chart on Market share by geography 2023-2028 (%)
      • Exhibit 64: Data Table on Market share by geography 2023-2028 (%)
    • 9.2 Geographic comparison
      • Exhibit 65: Chart on Geographic comparison
      • Exhibit 66: Data Table on Geographic comparison
    • 9.3 APAC - Market size and forecast 2023-2028
      • Exhibit 67: Chart on APAC - Market size and forecast 2023-2028 ($ billion)
      • Exhibit 68: Data Table on APAC - Market size and forecast 2023-2028 ($ billion)
      • Exhibit 69: Chart on APAC - Year-over-year growth 2023-2028 (%)
      • Exhibit 70: Data Table on APAC - Year-over-year growth 2023-2028 (%)
    • 9.4 Europe - Market size and forecast 2023-2028
      • Exhibit 71: Chart on Europe - Market size and forecast 2023-2028 ($ billion)
      • Exhibit 72: Data Table on Europe - Market size and forecast 2023-2028 ($ billion)
      • Exhibit 73: Chart on Europe - Year-over-year growth 2023-2028 (%)
      • Exhibit 74: Data Table on Europe - Year-over-year growth 2023-2028 (%)
    • 9.5 North America - Market size and forecast 2023-2028
      • Exhibit 75: Chart on North America - Market size and forecast 2023-2028 ($ billion)
      • Exhibit 76: Data Table on North America - Market size and forecast 2023-2028 ($ billion)
      • Exhibit 77: Chart on North America - Year-over-year growth 2023-2028 (%)
      • Exhibit 78: Data Table on North America - Year-over-year growth 2023-2028 (%)
    • 9.6 Middle East and Africa - Market size and forecast 2023-2028
      • Exhibit 79: Chart on Middle East and Africa - Market size and forecast 2023-2028 ($ billion)
      • Exhibit 80: Data Table on Middle East and Africa - Market size and forecast 2023-2028 ($ billion)
      • Exhibit 81: Chart on Middle East and Africa - Year-over-year growth 2023-2028 (%)
      • Exhibit 82: Data Table on Middle East and Africa - Year-over-year growth 2023-2028 (%)
    • 9.7 South America - Market size and forecast 2023-2028
      • Exhibit 83: Chart on South America - Market size and forecast 2023-2028 ($ billion)
      • Exhibit 84: Data Table on South America - Market size and forecast 2023-2028 ($ billion)
      • Exhibit 85: Chart on South America - Year-over-year growth 2023-2028 (%)
      • Exhibit 86: Data Table on South America - Year-over-year growth 2023-2028 (%)
    • 9.8 US - Market size and forecast 2023-2028
      • Exhibit 87: Chart on US - Market size and forecast 2023-2028 ($ billion)
      • Exhibit 88: Data Table on US - Market size and forecast 2023-2028 ($ billion)
      • Exhibit 89: Chart on US - Year-over-year growth 2023-2028 (%)
      • Exhibit 90: Data Table on US - Year-over-year growth 2023-2028 (%)
    • 9.9 Japan - Market size and forecast 2023-2028
      • Exhibit 91: Chart on Japan - Market size and forecast 2023-2028 ($ billion)
      • Exhibit 92: Data Table on Japan - Market size and forecast 2023-2028 ($ billion)
      • Exhibit 93: Chart on Japan - Year-over-year growth 2023-2028 (%)
      • Exhibit 94: Data Table on Japan - Year-over-year growth 2023-2028 (%)
    • 9.10 China - Market size and forecast 2023-2028
      • Exhibit 95: Chart on China - Market size and forecast 2023-2028 ($ billion)
      • Exhibit 96: Data Table on China - Market size and forecast 2023-2028 ($ billion)
      • Exhibit 97: Chart on China - Year-over-year growth 2023-2028 (%)
      • Exhibit 98: Data Table on China - Year-over-year growth 2023-2028 (%)
    • 9.11 Germany - Market size and forecast 2023-2028
      • Exhibit 99: Chart on Germany - Market size and forecast 2023-2028 ($ billion)
      • Exhibit 100: Data Table on Germany - Market size and forecast 2023-2028 ($ billion)
      • Exhibit 101: Chart on Germany - Year-over-year growth 2023-2028 (%)
      • Exhibit 102: Data Table on Germany - Year-over-year growth 2023-2028 (%)
    • 9.12 UK - Market size and forecast 2023-2028
      • Exhibit 103: Chart on UK - Market size and forecast 2023-2028 ($ billion)
      • Exhibit 104: Data Table on UK - Market size and forecast 2023-2028 ($ billion)
      • Exhibit 105: Chart on UK - Year-over-year growth 2023-2028 (%)
      • Exhibit 106: Data Table on UK - Year-over-year growth 2023-2028 (%)
    • 9.13 Market opportunity by geography
      • Exhibit 107: Market opportunity by geography ($ billion)
      • Exhibit 108: Data Tables on Market opportunity by geography ($ billion)

    10 Drivers, Challenges, and Trends

    • 10.1 Market drivers
      • 10.2 Market challenges
        • 10.3 Impact of drivers and challenges
          • Exhibit 109: Impact of drivers and challenges in 2023 and 2028
        • 10.4 Market trends

          11 Vendor Landscape

          • 11.1 Overview
            • 11.2 Vendor landscape
              • Exhibit 110: Overview on Criticality of inputs and Factors of differentiation
            • 11.3 Landscape disruption
              • Exhibit 111: Overview on factors of disruption
            • 11.4 Industry risks
              • Exhibit 112: Impact of key risks on business

            12 Vendor Analysis

            • 12.1 Vendors covered
              • Exhibit 113: Vendors covered
            • 12.2 Market positioning of vendors
              • Exhibit 114: Matrix on vendor position and classification
            • 12.3 Archer Daniels Midland Co.
              • Exhibit 115: Archer Daniels Midland Co. - Overview
              • Exhibit 116: Archer Daniels Midland Co. - Business segments
              • Exhibit 117: Archer Daniels Midland Co. - Key offerings
              • Exhibit 118: Archer Daniels Midland Co. - Segment focus
            • 12.4 Biena Inc.
              • Exhibit 119: Biena Inc. - Overview
              • Exhibit 120: Biena Inc. - Product / Service
              • Exhibit 121: Biena Inc. - Key offerings
            • 12.5 BIOCODEX SAS
              • Exhibit 122: BIOCODEX SAS - Overview
              • Exhibit 123: BIOCODEX SAS - Product / Service
              • Exhibit 124: BIOCODEX SAS - Key offerings
            • 12.6 BioGaia AB
              • Exhibit 125: BioGaia AB - Overview
              • Exhibit 126: BioGaia AB - Business segments
              • Exhibit 127: BioGaia AB - Key news
              • Exhibit 128: BioGaia AB - Key offerings
              • Exhibit 129: BioGaia AB - Segment focus
            • 12.7 Chr Hansen Holding AS
              • Exhibit 130: Chr Hansen Holding AS - Overview
              • Exhibit 131: Chr Hansen Holding AS - Business segments
              • Exhibit 132: Chr Hansen Holding AS - Key news
              • Exhibit 133: Chr Hansen Holding AS - Key offerings
              • Exhibit 134: Chr Hansen Holding AS - Segment focus
            • 12.8 Danone SA
              • Exhibit 135: Danone SA - Overview
              • Exhibit 136: Danone SA - Business segments
              • Exhibit 137: Danone SA - Key news
              • Exhibit 138: Danone SA - Key offerings
              • Exhibit 139: Danone SA - Segment focus
            • 12.9 DuPont de Nemours Inc.
              • Exhibit 140: DuPont de Nemours Inc. - Overview
              • Exhibit 141: DuPont de Nemours Inc. - Business segments
              • Exhibit 142: DuPont de Nemours Inc. - Key news
              • Exhibit 143: DuPont de Nemours Inc. - Key offerings
              • Exhibit 144: DuPont de Nemours Inc. - Segment focus
            • 12.10 Kerry Group Plc
              • Exhibit 145: Kerry Group Plc - Overview
              • Exhibit 146: Kerry Group Plc - Business segments
              • Exhibit 147: Kerry Group Plc - Key offerings
              • Exhibit 148: Kerry Group Plc - Segment focus
            • 12.11 Lallemand Inc.
              • Exhibit 149: Lallemand Inc. - Overview
              • Exhibit 150: Lallemand Inc. - Product / Service
              • Exhibit 151: Lallemand Inc. - Key offerings
            • 12.12 Novozymes OneHealth
              • Exhibit 152: Novozymes OneHealth - Overview
              • Exhibit 153: Novozymes OneHealth - Product / Service
              • Exhibit 154: Novozymes OneHealth - Key offerings
            • 12.13 Nutris
              • Exhibit 155: Nutris - Overview
              • Exhibit 156: Nutris - Product / Service
              • Exhibit 157: Nutris - Key offerings
            • 12.14 Probi AB
              • Exhibit 158: Probi AB - Overview
              • Exhibit 159: Probi AB - Business segments
              • Exhibit 160: Probi AB - Key offerings
              • Exhibit 161: Probi AB - Segment focus
            • 12.15 Probiotical S.p.A.
              • Exhibit 162: Probiotical S.p.A. - Overview
              • Exhibit 163: Probiotical S.p.A. - Product / Service
              • Exhibit 164: Probiotical S.p.A. - Key offerings
            • 12.16 Sabinsa Corp.
              • Exhibit 165: Sabinsa Corp. - Overview
              • Exhibit 166: Sabinsa Corp. - Product / Service
              • Exhibit 167: Sabinsa Corp. - Key offerings
            • 12.17 Winclove BV
              • Exhibit 168: Winclove BV - Overview
              • Exhibit 169: Winclove BV - Product / Service
              • Exhibit 170: Winclove BV - Key offerings

            13 Appendix

            • 13.1 Scope of the report
              • 13.2 Inclusions and exclusions checklist
                • Exhibit 171: Inclusions checklist
                • Exhibit 172: Exclusions checklist
              • 13.3 Currency conversion rates for US$
                • Exhibit 173: Currency conversion rates for US$
              • 13.4 Research methodology
                • Exhibit 174: Research methodology
                • Exhibit 175: Validation techniques employed for market sizing
                • Exhibit 176: Information sources
              • 13.5 List of abbreviations
                • Exhibit 177: List of abbreviations

              Research Methodology

              Technavio presents a detailed picture of the market by way of study, synthesis, and summation of data from multiple sources. The analysts have presented the various facets of the market with a particular focus on identifying the key industry influencers. The data thus presented is comprehensive, reliable, and the result of extensive research, both primary and secondary.

              INFORMATION SOURCES

              Primary sources

              • Manufacturers and suppliers
              • Channel partners
              • Industry experts
              • Strategic decision makers

              Secondary sources

              • Industry journals and periodicals
              • Government data
              • Financial reports of key industry players
              • Historical data
              • Press releases

              DATA ANALYSIS

              Data Synthesis

              • Collation of data
              • Estimation of key figures
              • Analysis of derived insights

              Data Validation

              • Triangulation with data models
              • Reference against proprietary databases
              • Corroboration with industry experts

              REPORT WRITING

              Qualitative

              • Market drivers
              • Market challenges
              • Market trends
              • Five forces analysis

              Quantitative

              • Market size and forecast
              • Market segmentation
              • Geographical insights
              • Competitive landscape

              Interested in this report?

              Get your sample now to see our research methodology and insights!

              Download Now

              Frequently Asked Questions

              Probiotic Ingredients market growth will increase by $ 3.00 bn during 2024-2028 .

              The Probiotic Ingredients market is expected to grow at a CAGR of 8.51% during 2024-2028 .

              Probiotic Ingredients market is segmented by Application( Food and beverages, Dietary supplements, Others) Source( Bacteria, Yeast, North America, MEA, South America)

              Archer Daniels Midland Co., Biena Inc., BIOCODEX SAS, BioGaia AB, Chr Hansen Holding AS, CUSTOM PROBIOTICS Inc., Danone SA, DuPont de Nemours Inc., Kerry Group Plc, Novozymes OneHealth, Sabinsa Corp., Thermo Fisher Scientific Inc., Unique Biotech Ltd., Winclove BV, Lallemand Inc., American Biosystems Inc., Nutris, Orffa International Holding B.V., Probi AB, Probiotical S.p.A. are a few of the key vendors in the Probiotic Ingredients market.

              APAC will register the highest growth rate of 38% among the other regions. Therefore, the Probiotic Ingredients market in APAC is expected to garner significant business opportunities for the vendors during the forecast period.

              US, Japan, China, Germany, UK

              • Rising awareness about benefits of probiotic supplementsProbiotics are live microorganisms that can be consumed through fermented foods or supplement products. Probiotic supplements promote a healthy balance of gut bacteria and have also been linked to a wide range of health benefits. The consumption of probiotic supplements prevents the growth of harmful bacteria inside the digestive tract is the driving factor this market.
              • leading to an improvement in nutrient absorption and bowel movements. These supplements are widely known for their ability to prevent diarrhea or reduce its severity. Probiotic supplements increase Lactobacilli count in people and prevent diseases such as bacterial vaginosis is the driving factor this market.
              • yeast infection is the driving factor this market.
              • and urinary tract infection. The consumption of commercial probiotic products improves the interstitial microbial balance by lowering the pH levels. Clinical studies have also shown that the intake of probiotics prevents the overgrowth of harmful microbes is the driving factor this market.
              • such as candida is the driving factor this market.
              • helicobacter pylori is the driving factor this market.
              • escherichia coli is the driving factor this market.
              • and salmonella. Studies have also shown that the consumption of probiotic yogurt protects the immune system against colon is the driving factor this market.
              • bladder is the driving factor this market.
              • and breast cancers. The consumption of probiotics also helps to reduce dental caries is the driving factor this market.
              • prevents oral candida infections is the driving factor this market.
              • and manages periodontitis. Owing to these health benefits is the driving factor this market.
              • the demand for probiotic ingredients is expected to increase globally is the driving factor this market.
              • which in turn will drive the growth of the global probiotic ingredients market during the forecast period. is the driving factor this market.

              The Probiotic Ingredients market vendors should focus on grabbing business opportunities from the Food and beverages segment as it accounted for the largest market share in the base year.