Programmable Infusion Pumps Market Forecast 2024-2028
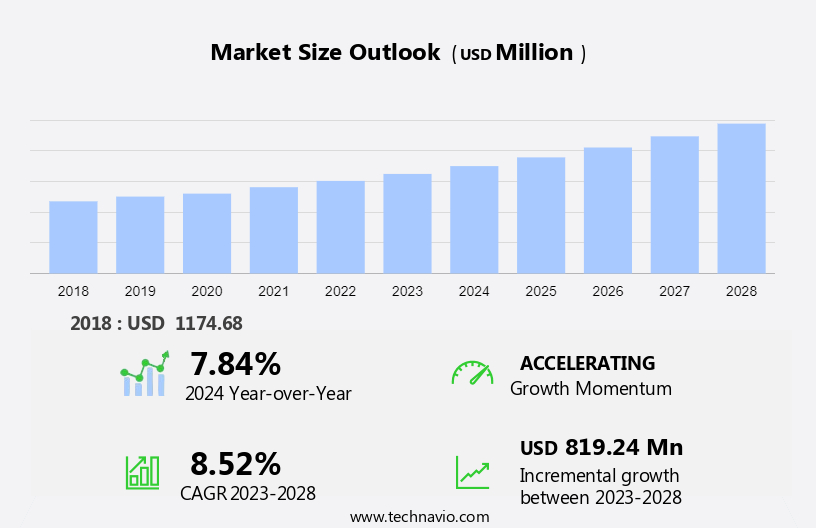
The global programmable infusion pumps market size is estimated to grow by USD 819.24 million at a CAGR of 8.52% between 2023 and 2028.
A slew of new products has been launched in the market, thus providing better options to buyers, which, in turn, helps to stimulate the overall demand for medical equipment in the market. Encouraged by this growth in demand, healthcare equipment manufacturers are seeking opportunities to convert this demand into a continuous cycle of innovation and improvisation by enhancing their products. Thus, all these factors have the potential to accelerate the growth of the global healthcare equipment market, including the market during the forecast period.
What will be the Size of the Market During the Forecast Period?
To learn more about this report, Download Report Sample
Segmentation by Type, End-user and Geography Analysis
Type
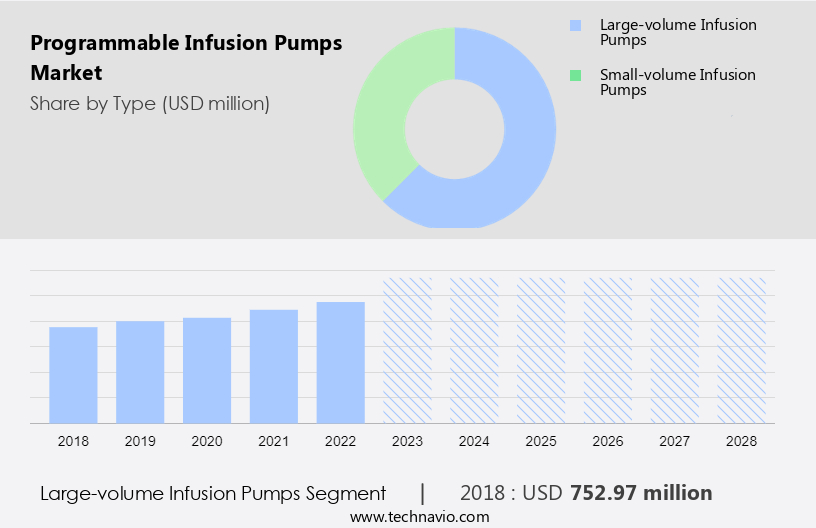
The market share growth by the large-volume infusion pumps segment will be significant during the forecast period. Large-volume infusion pumps are the market leading in the market, driving significant growth in recent years. These pumps play a key role in healthcare settings, ensuring the correct and regulated delivery of large amounts of fluid, making them indispensable in critical care and intravenous therapy. Key market players such as Baxter International Inc. are driving expansion by developing large-volume infusion pumps with advanced features, enhanced safety standards, and user-friendly interfaces.
Get a glance at the market contribution of various segments Download PDF Sample
The large-volume infusion pumps were the largest and were valued at USD 752.97 million in 2018. The rising frequency of chronic diseases, increased demand for home-based healthcare solutions, and technological breakthroughs that improve the efficiency of large-volume infusion pumps all drive the market scenario. The prevalence of these pumps emphasizes their critical role in providing precise and dependable infusion therapies across a wide range of medical applications. Such factors will continue to drive the demand for large-volume infusion pumps, which, in turn, will drive the growth of the market during the forecast period.
End-user
Hospitals are a key end-user in the market, driving significant growth in the market. The rising prevalence of chronic diseases, an ageing population, and increased demand for effective drug delivery methods all contribute to hospitals' crucial role as end-users in the market. Leading players such as Becton Dickinson and Co., Baxter International Inc., and Fresenius SE and Co. KGaA provide innovative infusion pump technologies to the hospital sector. These devices are prioritized by hospitals for accurate and regulated medicine administration, delivering optimal patient care. Furthermore, the incorporation of smart infusion systems improves workflow efficiency. The shift towards outpatient services and the requirement for infusion therapy in various medical conditions consolidate hospitals as key end-user, fueling the worldwide market continuing growth during the forecast period.
The market is undergoing an unprecedented transition, with a major growth scenario in the home care settings segment as a main end-user. The rising prevalence of chronic diseases, as well as the ageing population's demand for home-based healthcare, are driving this trend. Medtronic and Baxter are developing programmable infusion pumps for home care settings, giving patients more autonomy and comfort. Leading businesses such as Medtronic Plc and B. Braun SE are catering to these end-user sectors by producing innovative programmable infusion pumps that ensure precise drug delivery in a variety of healthcare settings. Collaboration between pump makers and academic institutions drives innovation even further, developing a market situation in which programmable infusion pumps play a critical role in improving patient care across varied healthcare settings. Owing to such factors, the demand for programmable infusion pumps is expected to increase from the other segments, which, in turn, will drive the growth of the market during the forecast period.
Regional Analysis
For more insights about the market share of various regions Download PDF Sample now!
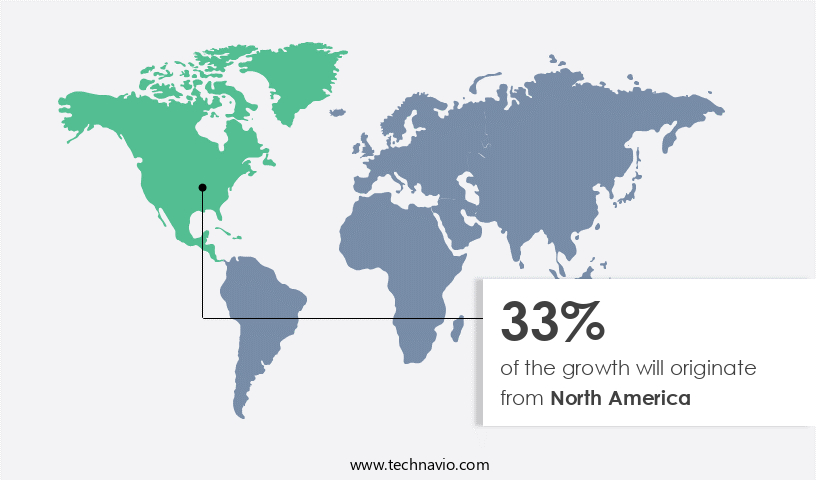
North America is estimated to contribute 33% to the growth of the global market during the forecast period. Technavio’s analysts have elaborately explained the regional market trends and analysis, and drivers will shape the market during the forecast period. North America accounted for the largest share of the global programmable infusion pumps market, mainly due to the growing prevalence of chronic diseases, such as diabetes, cancer, and arthritis, among others; the increasing geriatric population; growing technological advances that enable the development of innovative devices; and rising healthcare expenditure. Moreover, the growing awareness among patients regarding the availability of self-administration drug delivery technologies, the increasing number of product approvals, and the growing presence of global and local manufacturers of programmable infusion pumps are fueling the growth of the market in North America.
In addition, the growing demand for premium-priced infusion pump systems to increase patient care quality is likely to drive the market in North America to new heights during the forecast period. The market for programmable infusion pumps in this region is projected to be driven by government measures to cut healthcare expenses in the region by increasing the use of home care equipment. This will increase the need for mobile and disposable infusion pumps in home care settings during the forecast period.
Buy Full Report Now
Key Market Players
Companies are implementing various strategies, such as strategic alliances, partnerships, mergers and acquisitions, geographical expansion, and product/service launches, to enhance their presence in the market. The report also includes detailed analyses of the competitive landscape of the market and information about 20 market companies, including:
Ace medical - The company offers programmable infusion pumps such as Auto Fuser S, Auto Fuser K, and Auto Med Ambulatory Infusion system.
- Avanos Medical Inc.
- B.Braun SE
- Baxter International Inc.
- Becton Dickinson and Co.
- BPL MEDICAL TECHNOLOGIES Pvt. Ltd.
- Canafusion Technologies Inc.
- Chemyx Inc.
- Contec Medical Systems Co. Ltd.
- ERENLER MEDIKAL SAN. TIC. LTD. STI.
- Flowonix Medical Inc.
- Fresenius SE and Co. KGaA
- Guangzhou Beaconn Medical Science Technology Co. Ltd.
- ICU Medical Inc.
- IRadimed Corp.
Qualitative and quantitative analysis of companies has been conducted to help clients understand the wider business environment as well as the strengths and weaknesses of key market players. Data is qualitatively analyzed to categorize companies as pure play, category-focused, industry-focused, and diversified; it is quantitatively analyzed to categorize companies as dominant, leading, strong, tentative, and weak.
Key Drivers, Trends, Challenges, and Customer Landscape
There are multiple factors influencing market growth. Our researchers analyzed the data with 2023 as the base year, along with the key drivers, trends, and challenges.
Key Drivers
Growing demand for self-administered drug delivery in home-care settings is notably driving market growth. In certain cases, patients need to receive therapeutic treatment on a regular basis. Certain therapeutic medications can be self-administered as per the recommendation of healthcare professionals. The rise in the number of people with various medical conditions, such as arthritis, diabetes, and cancer, where the timing of the medication is a crucial factor, has increased the demand for self-administered drug delivery systems for use in home-care settings. Self-administration of various therapeutic medications in home-care settings has increased exponentially, owing to the enhanced improvements in the patients health outcomes and the reduced need for them to be admitted to hospitals and clinics to undergo regular treatments.
Moreover, patient-controlled analgesia pumps are also used in home-care settings. In PCA, a programmable and computerized pump contains a syringe of pain medication as recommended by the healthcare professional. PCA is majorly used by patients who have undergone a surgical procedure. For instance, the TPCA ambulatory patient-controlled syringe pump is one of the PCAs most commonly used by patients who are in need of pain management therapy. This device incorporates a library of dose error reduction software systems, which can be set as per the patient's need for pain management in a home-care setting. Such factors are expected to drive the market growth and trends during the forecast period.
Significant Trends
The growing number of acquisitions in the market is an emerging trend shaping market development. The manufacturers and developers of programmable infusion pumps are focusing on developing an extensive range of programmable infusion pumps to improve the effectiveness and efficiency of drug and nutrient administration to patients. Programmable infusion pumps are integrated with safety software that helps healthcare providers to minimize the risk of overdose or underdose of medications.
Moreover, many companies operating in the market are focusing on acquisitions to enhance their technological landscape and broaden their product offerings for programmable infusion pumps and thereby strengthening the customer base by fulfilling the unmet needs of patients. Through this inorganic growth strategy, the major vendors present are also establishing themselves in the market during the forecast period.
Major Challenges
Frequent product recalls of programmable infusion pumps are a significant challenge hindering market growth. The global healthcare equipment industry witnesses frequent product recalls on account of safety or functionality issues. There are instances where healthcare equipment such as medical equipment must be checked, adjusted, or fixed to ensure that it does not fail unexpectedly or violate regulatory guidelines. Medical equipment manufacturers may also recall their devices to inspect and repair them so that they do not cause serious health issues in patients.
In addition, the Food and Drug Administration (FDA) is responsible for updating the Medical Device Recall Database after a company has initiated a correction or removal of its equipment. Thus, such instances cause a major setback to the underlying players financial books and hamper the growth of the global healthcare equipment market, including the market during the forecast period.
Key Market Customer Landscape
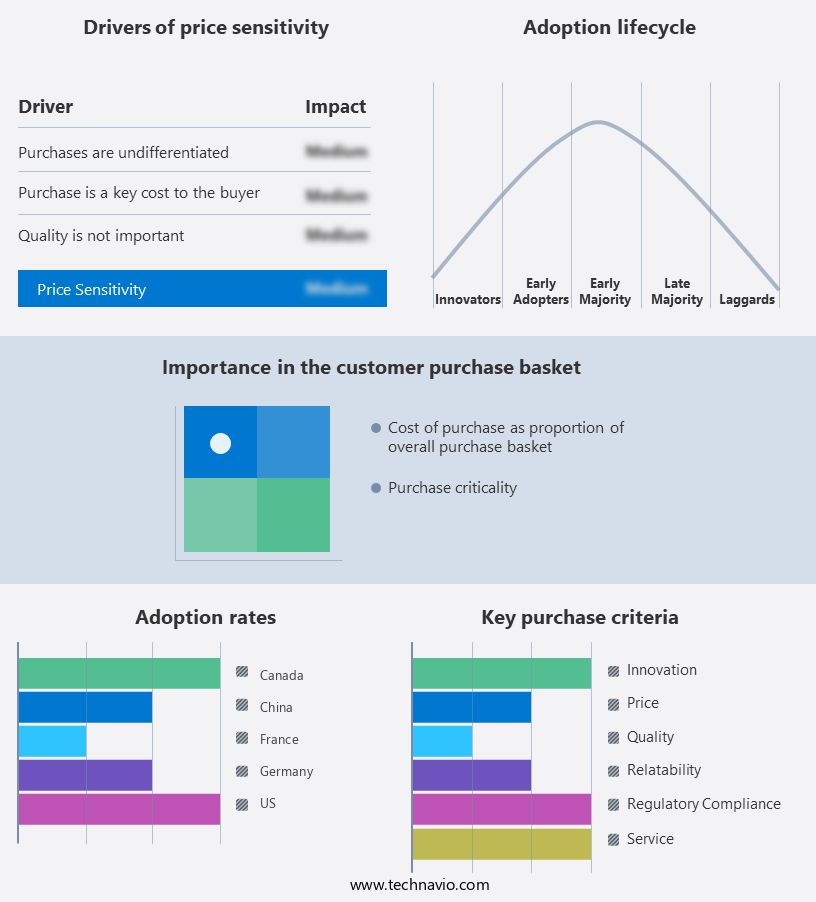
The market forecasting report includes the adoption lifecycle of the market research and growth, covering from the innovator’s stage to the laggard’s stage. It focuses on adoption rates in different regions based on penetration. Furthermore, the market analysis and report also includes key purchase criteria and drivers of price sensitivity to help companies evaluate and develop their market growth and forecasting strategies.
Customer Landscape
Market Analyst Overview
The market is intricately linked with various healthcare aspects, playing a pivotal role in surgeries and facilitating treatments in diverse settings such as ambulatory care settings. Recognizing the significance of patient safety, especially highlighted in the Institute of Medicine report, the market addresses crucial device design considerations to mitigate medication errors. With a focus on enhancing healthcare systems, the integration of wireless connectivity and features like auto-preprogramming and auto-documentation in smart pumps aims to reduce adverse events and medical injuries associated with intravenous (IV) infusions and adverse drug events (ADEs).
Moreover, the infusion pump market ecosystem involves various stakeholders, including distributors, research & product developers, and end users spanning the specialty infusion pump segment, traditional infusion pump segment, diabetes management segment, analgesia/pain management segment, and specific segments like ambulatory care setting and hospitals. The market adapts to the evolving landscape with a focus on interoperability and addressing patient needs in ASCs (Ambulatory Surgical Centers), influenced by factors such as per capita income and evolving treatment options in healthcare.
Segment Overview
The market report forecasts market growth by revenue at global, regional & country levels and provides an analysis of the latest trends and growth opportunities from 2018 to 2028.
- Type Outlook
- Large-volume infusion pumps
- Small-volume infusion pumps
- End-user Outlook
- Hospitals
- Home care settings
- Region Outlook
- North America
- The U.S.
- Canada
- Europe
- The U.K.
- Germany
- France
- Rest of Europe
- Asia
- China
- India
- Rest of World (ROW)
- Brazil
- Argentina
- Australia
- North America
|
Programmable Infusion Pumps Market Scope |
|
|
Report Coverage |
Details |
|
Page number |
161 |
|
Base year |
2023 |
|
Historic period |
2018-2022 |
|
Forecast period |
2024-2028 |
|
Growth momentum & CAGR |
Accelerate at a CAGR of 8.52% |
|
Market Growth 2024-2028 |
USD 819.24 million |
|
Market structure |
Fragmented |
|
YoY growth 2023-2024(%) |
7.84 |
|
Regional analysis |
North America, Europe, Asia, and Rest of World (ROW) |
|
Performing market contribution |
North America at 33% |
|
Key countries |
US, Canada, China, Germany, and France |
|
Competitive landscape |
Leading Companies, Market Positioning of Companies, Competitive Strategies, and Industry Risks |
|
Key companies profiled |
Ace medical, Avanos Medical Inc., B.Braun SE, Baxter International Inc., Becton Dickinson and Co., BPL MEDICAL TECHNOLOGIES Pvt. Ltd., Canafusion Technologies Inc., Chemyx Inc., Contec Medical Systems Co. Ltd., ERENLER MEDIKAL SAN. TIC. LTD. STI., Flowonix Medical Inc., Fresenius SE and Co. KGaA, Guangzhou Beaconn Medical Science Technology Co. Ltd., ICU Medical Inc., IRadimed Corp., Johnson and Johnson, Medtronic Plc, Moog Inc., Terumo Corp., and Ypsomed Holding AG |
|
Market dynamics |
Parent market growth analysis, Market growth inducers and obstacles, Fast-growing and slow-growing segment analysis, COVID-19 impact and recovery analysis and future consumer dynamics, Market condition analysis for the forecast period. |
|
Customization purview |
If our report has not included the data that you are looking for, you can reach out to our analysts and get segments customized. |
Download Sample PDF at your Fingertips
What are the Key Data Covered in this Programmable Infusion Pumps Market Research Report?
- CAGR of the market during the forecast period
- Detailed information on factors that will drive the growth of the between 2024 and 2028
- Precise estimation of the size and its contribution n of the market in focus to the parent market
- Detailed analysis of customer landscape covering Diver of price sensitivity, Adoption of the lifecycle, and key purchase criteria
- Companies landscape comparing criticality of inputs and factors of differentiation
- Exclusive Matrix on companies position and classification
- Accurate predictions about upcoming trends and changes in consumer behavior
- Growth of the market across North America, Europe, Asia, and Rest of World (ROW)
- Thorough analysis of the market’s competitive landscape and detailed information about companies
- Comprehensive analysis of factors that will challenge the growth of companies
We can help! Our analysts can customize this market research report to meet your requirements. Get in touch
 RIA -
RIA - 
