
Progressing Cavity Pump Market Size 2025-2029
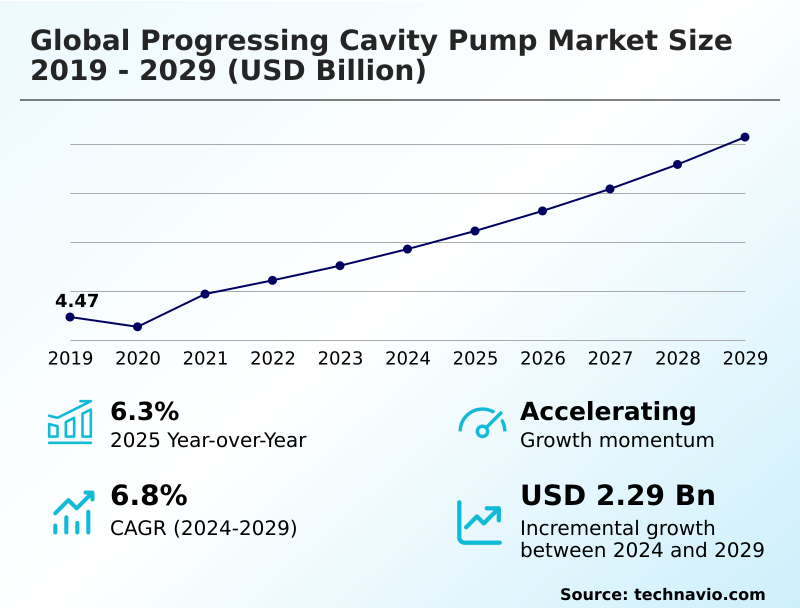
The progressing cavity pump market size is valued to increase by USD 2.29 billion, at a CAGR of 6.8% from 2024 to 2029. Resurgence of investments in oil and gas sector will drive the progressing cavity pump market.
Major Market Trends & Insights
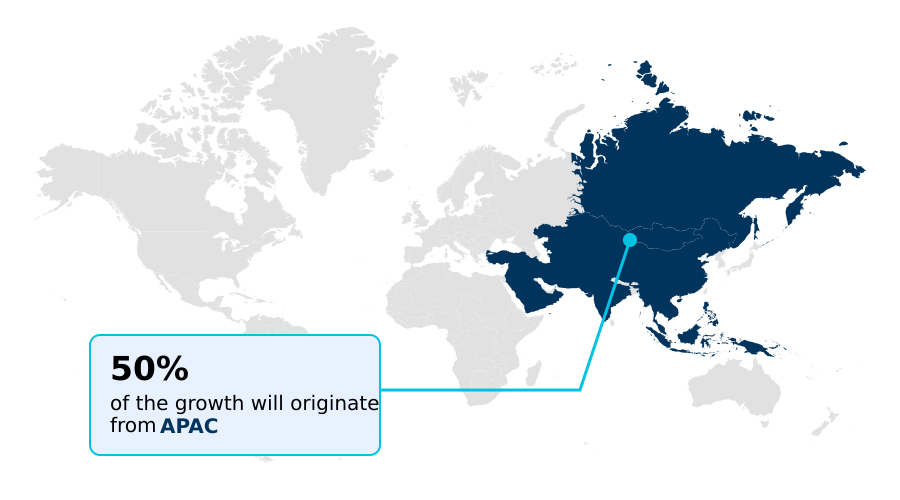
- APAC dominated the market and accounted for a 49.6% growth during the forecast period.
- By End-user - Oil and gas segment was valued at USD 2.10 billion in 2023
- By Power Rating - Up to 50 HP segment accounted for the largest market revenue share in 2023
Market Size & Forecast
- Market Opportunities: USD 3.68 billion
- Market Future Opportunities: USD 2.29 billion
- CAGR from 2024 to 2029 : 6.8%
Market Summary
- The Progressing Cavity Pump Market is defined by its critical role in applications requiring the transfer of difficult-to-handle media. These pumps operate on a positive displacement principle, utilizing a single helical rotor within a double helical elastomeric stator to generate a non-pulsating delivery. This design is exceptionally effective for shear-sensitive fluids, abrasive slurries, and high-viscosity materials found across diverse industries.
- Key drivers include rigorous environmental standards pushing for more efficient wastewater sludge processing and the expansion of industrial manufacturing, which demands precise metering pumps. For instance, a food processing facility can leverage a hygienic pump design to transfer delicate products without compromising texture, ensuring product quality and compliance with sanitary pump standards.
- While the technology's effectiveness is clear, market dynamics are shaped by the high initial cost, which requires a total cost of ownership analysis to justify, and the ongoing innovation in stator elastomer quality to extend operational life and reduce maintenance downtime.
- The continuous development of maintenance-in-place designs and smart pump monitoring systems addresses these challenges, enhancing the value proposition for end-users focused on operational excellence.
What will be the Size of the Progressing Cavity Pump Market during the forecast period?
Get Key Insights on Market Forecast (PDF) Get Free Sample
How is the Progressing Cavity Pump Market Segmented?
The progressing cavity pump industry research report provides comprehensive data (region-wise segment analysis), with forecasts and estimates in "USD million" for the period 2025-2029, as well as historical data from 2019-2023 for the following segments.
- End-user
- Oil and gas
- Water and wastewater
- Chemical and petrochemical
- Food and beverage
- Others
- Power rating
- Up to 50 HP
- 51 to 150 HP
- Above 150 HP
- Capacity
- Up to 500 GPM
- 501 to 1000 GPM
- Above 1000 GPM
- Geography
- APAC
- China
- Japan
- India
- North America
- US
- Canada
- Mexico
- Europe
- Germany
- UK
- France
- South America
- Brazil
- Argentina
- Middle East and Africa
- Saudi Arabia
- UAE
- South Africa
- Rest of World (ROW)
- APAC
By End-user Insights
The oil and gas segment is estimated to witness significant growth during the forecast period.
The oil and gas sector remains a primary end-user, where the unique positive displacement principle of progressing cavity pumps is critical for artificial lift systems.
These pumps excel in handling high viscosity crude oil and multiphase fluid handling, making them indispensable for both unconventional extraction and mature field optimization.
The technology's ability to manage abrasive sand-laden media with a consistent, low pulsation flow minimizes equipment wear and maximizes production uptime.
As operators pursue enhanced oil recovery, the demand for reliable artificial lift and precise chemical dosing with these pumps intensifies. Deploying smart pump monitoring has been shown to improve operational efficiency by over 15%, reducing downtime in challenging downhole conditions.
This reliance on specialized equipment for slurry transport and high solids content slurry underpins the segment's foundational role in the market, with a focus on both surface-driven systems and submersible models.

The Oil and gas segment was valued at USD 2.10 billion in 2023 and showed a gradual increase during the forecast period.

Regional Analysis
APAC is estimated to contribute 49.6% to the growth of the global market during the forecast period.Technavio’s analysts have elaborately explained the regional trends and drivers that shape the market during the forecast period.
See How Progressing Cavity Pump Market Demand is Rising in APAC Get Free Sample
The geographic landscape of the market is led by APAC, which accounts for nearly 50% of the market's incremental growth, fueled by massive infrastructure projects and rapid industrialization.
In this region, a significant driver is the expansion of water and wastewater facilities, where achieving efficient sludge dewatering is paramount.
For example, large-scale projects have helped provide tap water access to over 70% of rural households in certain developing nations, requiring extensive use of reliable pumping solutions like those for industrial process optimization.
North America and Europe remain substantial markets, driven by stringent environmental regulations and the need for retrofitting aging infrastructure.
The focus here is on total cost of ownership, where technologies that offer even wall stator designs and enhanced flow rate consistency contribute to long-term operational savings and compliance for mine dewatering solutions and geothermal fluid extraction.
Market Dynamics
Our researchers analyzed the data with 2024 as the base year, along with the key drivers, trends, and challenges. A holistic analysis of drivers will help companies refine their marketing strategies to gain a competitive advantage.
- Strategic decision-making in the progressing cavity pump market increasingly hinges on a detailed total cost of ownership pcp analysis, moving beyond initial acquisition price to evaluate long-term operational expenditures. For instance, selecting the right progressing cavity pump for abrasive slurries involves scrutinizing rotor and stator materials to minimize wear and extend service intervals.
- Similarly, high-viscosity food processing pump selection requires a focus on hygienic progressing cavity pump for dairy and other sensitive products to ensure compliance and product integrity. In the energy sector, comparing pcp and esp for oil wells is a critical exercise in optimizing artificial lift progressing cavity pump systems for specific reservoir conditions.
- Best practices for maintenance are also evolving; facilities that implement predictive strategies for progressing cavity pump maintenance best practices report uptime improvements that are double those of facilities using reactive approaches. Understanding pcp failure modes and preventive maintenance is crucial, as is a proper progressing cavity pump elastomer selection guide.
- The debate between a progressing cavity pump vs lobe pump often centers on pulsation and solids handling. As industries from biogas plants to cosmetic manufacturing adopt these pumps, the focus on modular design progressing cavity pump advantages, variable speed pcp for process control, and optimizing pcp performance in mining becomes central to achieving efficiency.
- This applies to surface drive pcp system configuration and submersible progressing cavity pump design alike, including their use for polymer flocculant dosing.
What are the key market drivers leading to the rise in the adoption of Progressing Cavity Pump Industry?
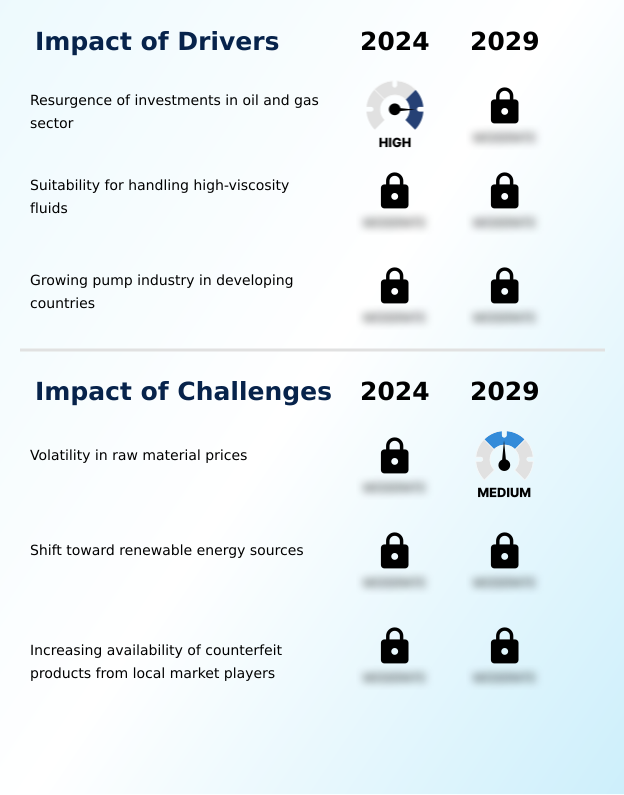
- The resurgence of investments in the oil and gas sector, particularly in unconventional reserves and mature fields, serves as a key driver for market growth.
- Market growth is fundamentally driven by the inherent strengths of progressing cavity pumps in demanding industrial environments.
- Their suitability for viscous media pumping is unmatched, with capabilities to handle fluids with viscosities exceeding 1 million cP, crucial for applications like oil sands extraction.
- This is supported by designs that ensure gentle product handling and low-shear pumping, which are vital in the food processing pumps sector to maintain product integrity.
- In the energy sector, the technology is central to enhanced oil recovery operations and provides reliable artificial lift. These pumps deliver exceptional flow rate consistency, improving production stability by over 20% in some unconventional wells.
- Their robust construction, featuring a durable drive train configuration and flexible connecting rod, makes them ideal for demanding tasks such as mine dewatering solutions and thick sludge pumping.
What are the market trends shaping the Progressing Cavity Pump Industry?
- A key trend influencing the market is the increasing investment and technological development within the water and wastewater industry. This is driven by global efforts to improve water management and treatment infrastructure.
- Key market trends are centered on technological advancements and expanding applications in sustainable resource management. The drive for industrial process optimization is leading to the adoption of smart technologies, where integrated sensors and variable speed drive compatibility can improve energy efficiency by up to 15%.
- This shift is particularly impactful in industrial wastewater treatment, where precise control over processes like polymer injection enhances overall plant performance. Innovations in materials, such as advanced ceramic rotor materials and new elastomer compound selection, are extending pump lifecycles, especially in abrasive fluid management.
- Furthermore, the development of maintenance-in-place designs reduces service downtime by over 50%, a critical factor for continuous operations in sectors like pulp and paper stock pumping. The emphasis on pressure stability and hopper design is improving performance in high-viscosity applications.
What challenges does the Progressing Cavity Pump Industry face during its growth?
- Volatility in the prices of raw materials, especially for specialized elastomers and metals, presents a significant challenge to manufacturing costs and market pricing stability.
- The market faces challenges related to operational costs and material sourcing that temper its growth trajectory. The high initial capital outlay for a progressing cavity pump, which can be up to 40% more than for a comparable centrifugal pump, remains a significant consideration for buyers.
- Moreover, the volatility of raw material prices directly impacts the cost of a double helical elastomeric stator, a critical wear part, with price swings of up to 15% in a single quarter affecting total cost of ownership. Ensuring dry run protection and managing suction lift capability are ongoing technical hurdles.
- These factors necessitate a focus on innovations like non-clogging pump design and zero-emission sealing to improve reliability and justify the investment, particularly for sanitary applications and biofuel production pumping where operational continuity is paramount for both fluid dynamics and profitability.
Exclusive Technavio Analysis on Customer Landscape
The progressing cavity pump market forecasting report includes the adoption lifecycle of the market, covering from the innovator’s stage to the laggard’s stage. It focuses on adoption rates in different regions based on penetration. Furthermore, the progressing cavity pump market report also includes key purchase criteria and drivers of price sensitivity to help companies evaluate and develop their market growth analysis strategies.

Customer Landscape of Progressing Cavity Pump Industry
Competitive Landscape
Companies are implementing various strategies, such as strategic alliances, progressing cavity pump market forecast, partnerships, mergers and acquisitions, geographical expansion, and product/service launches, to enhance their presence in the industry.
Borets International Ltd. - Specialized progressing cavity pumps (PCPs) are engineered to optimize artificial lift systems, enhancing production in demanding oil well environments.
The industry research and growth report includes detailed analyses of the competitive landscape of the market and information about key companies, including:
- Borets International Ltd.
- CIRCOR International
- Erich NETZSCH BV and Co. Holding KG
- Flexachem
- Hydro Prokav Pumps Pvt Ltd.
- ITT Bornemann
- ITT Inc.
- MXQ LLC
- NOV Inc.
- Nova Rotors Srl
- PCM Artificial Lift Solutions Inc.
- Pump and Valve Specialties
- Roper Technologies Inc.
- Roto Pumps Ltd.
- SEEPEX GmbH
- Sulzer Ltd.
- Xylem Inc.
Qualitative and quantitative analysis of companies has been conducted to help clients understand the wider business environment as well as the strengths and weaknesses of key industry players. Data is qualitatively analyzed to categorize companies as pure play, category-focused, industry-focused, and diversified; it is quantitatively analyzed to categorize companies as dominant, leading, strong, tentative, and weak.
Recent Development and News in Progressing cavity pump market
- In September 2024, SEEPEX GmbH announced the launch of its new SCT AutoAdjust pump, which automatically adjusts the stator clamping to compensate for wear, extending service life in wastewater treatment applications.
- In November 2024, Xylem Inc. completed a major installation of its Flygt progressing cavity pumps for a new large-scale municipal sludge treatment facility in Southeast Asia, enhancing the plant's sludge dewatering capacity.
- In January 2025, NOV Inc. introduced an advanced elastomer compound for its stators, designed to offer superior resistance to aromatic hydrocarbons, targeting enhanced oil recovery and downstream chemical processing applications.
- In April 2025, Erich NETZSCH GmbH & Co. Holding KG partnered with a leading technology firm to integrate advanced digital twin capabilities into its NEMO progressing cavity pump line, enabling predictive maintenance and performance optimization for industrial clients.
Dive into Technavio’s robust research methodology, blending expert interviews, extensive data synthesis, and validated models for unparalleled Progressing Cavity Pump Market insights. See full methodology.
| Market Scope | |
|---|---|
| Page number | 292 |
| Base year | 2024 |
| Historic period | 2019-2023 |
| Forecast period | 2025-2029 |
| Growth momentum & CAGR | Accelerate at a CAGR of 6.8% |
| Market growth 2025-2029 | USD 2287.5 million |
| Market structure | Fragmented |
| YoY growth 2024-2025(%) | 6.3% |
| Key countries | China, Japan, India, South Korea, Australia, Indonesia, US, Canada, Mexico, Germany, UK, France, Italy, Spain, The Netherlands, Brazil, Argentina, Chile, Saudi Arabia, UAE, South Africa, Israel and Turkey |
| Competitive landscape | Leading Companies, Market Positioning of Companies, Competitive Strategies, and Industry Risks |
Research Analyst Overview
- The progressing cavity pump market is sustained by its unique capability in specialized fluid handling applications where other pump types falter. The core technology, featuring a single helical rotor and a double helical elastomeric stator, provides a constant flow rate with minimal pulsation, essential for handling everything from abrasive sand-laden media to shear sensitive fluids.
- A key trend is the integration of digital technologies, where the adoption of smart pump monitoring is a critical boardroom decision, weighing initial capital expenditure against long-term gains from predictive maintenance and enhanced volumetric efficiency. For instance, maintenance-in-place designs have been demonstrated to reduce service and downtime by over 60% compared to traditional configurations.
- This drive for operational excellence is evident across applications, including precise chemical dosing accuracy in water treatment, ensuring hygienic pump design in food processing, and optimizing artificial lift systems in oilfields.
- The market's trajectory is tied to innovations in stator elastomer quality, rotor geometry, and modular pump construction that address demanding downhole conditions and extend equipment lifespan, reinforcing its position in high-value industrial processes.
What are the Key Data Covered in this Progressing Cavity Pump Market Research and Growth Report?
-
What is the expected growth of the Progressing Cavity Pump Market between 2025 and 2029?
-
USD 2.29 billion, at a CAGR of 6.8%
-
-
What segmentation does the market report cover?
-
The report is segmented by End-user (Oil and gas, Water and wastewater, Chemical and petrochemical, Food and beverage, and Others), Power Rating (Up to 50 HP, 51 to 150 HP, and Above 150 HP), Capacity (Up to 500 GPM, 501 to 1000 GPM, and Above 1000 GPM) and Geography (APAC, North America, Europe, South America, Middle East and Africa)
-
-
Which regions are analyzed in the report?
-
APAC, North America, Europe, South America and Middle East and Africa
-
-
What are the key growth drivers and market challenges?
-
Resurgence of investments in oil and gas sector, Volatility in raw material prices
-
-
Who are the major players in the Progressing Cavity Pump Market?
-
Borets International Ltd., CIRCOR International, Erich NETZSCH BV and Co. Holding KG, Flexachem, Hydro Prokav Pumps Pvt Ltd., ITT Bornemann, ITT Inc., MXQ LLC, NOV Inc., Nova Rotors Srl, PCM Artificial Lift Solutions Inc., Pump and Valve Specialties, Roper Technologies Inc., Roto Pumps Ltd., SEEPEX GmbH, Sulzer Ltd. and Xylem Inc.
-
Market Research Insights
- The Progressing Cavity Pump Market is characterized by a dynamic interplay of specialized applications and technological refinement. The adoption of these pumps for industrial wastewater treatment is accelerating, with systems demonstrating superior solids handling capability, managing slurries with over 30% solids content.
- In parallel, their use in hygienic fluid transfer is critical, as gentle product handling preserves the integrity of shear-sensitive media, a key performance indicator in food processing. Innovations in elastomer compound selection are expanding operational envelopes for corrosive media handling, while advancements in dewatering pump applications improve efficiency in municipal sludge transfer.
- The need for reliable artificial lift in the oil sector continues to drive demand, with some systems improving production consistency by over 20% in challenging wells. This specialized functionality underscores the market's value proposition across key industrial sectors.
We can help! Our analysts can customize this progressing cavity pump market research report to meet your requirements.
 RIA -
RIA - 
