RDX And HMX Market Analysis, Size, and Forecast 2026-2030: North America (US, Canada, and Mexico), APAC (China, India, and Japan), Europe (Germany, France, and UK), Middle East and Africa (Saudi Arabia, UAE, and South Africa), South America (Brazil, Argentina, and Colombia), and Rest of World (ROW)

RDX And HMX Market Analysis, Size, and Forecast 2026-2030:
North America (US, Canada, and Mexico), APAC (China, India, and Japan), Europe (Germany, France, and UK), Middle East and Africa (Saudi Arabia, UAE, and South Africa), South America (Brazil, Argentina, and Colombia), and Rest of World (ROW)

Published: Dec 2025 302 Pages SKU: IRTNTR81179

Market Overview at a Glance

$4.02 B
Market Opportunity
4.5%
CAGR 2025 - 2030
33.1%
North America Growth
$9.77 B
RDX segment 2024

RDX And HMX Market Size 2026-2030

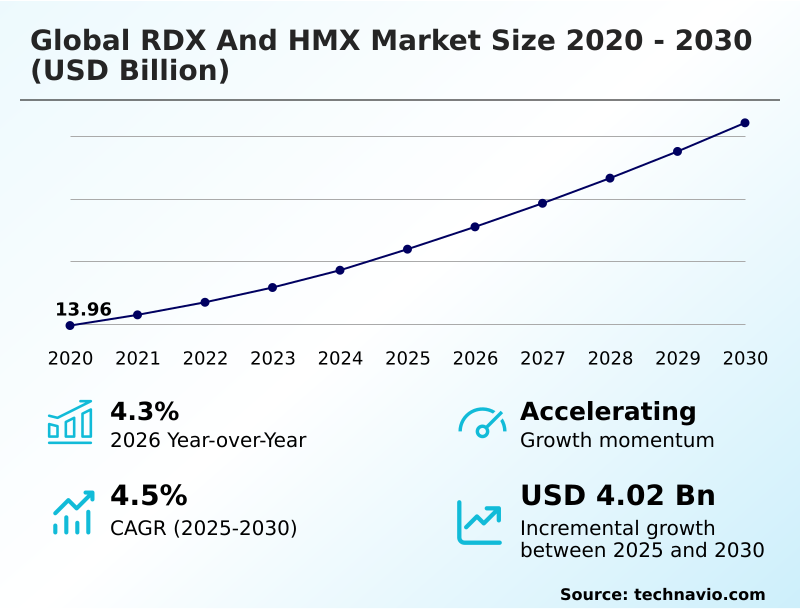
The rdx and hmx market size is valued to increase by USD 4.02 billion, at a CAGR of 4.5% from 2025 to 2030. Escalating replenishment of national munitions stockpiles will drive the rdx and hmx market.

Major Market Trends & Insights

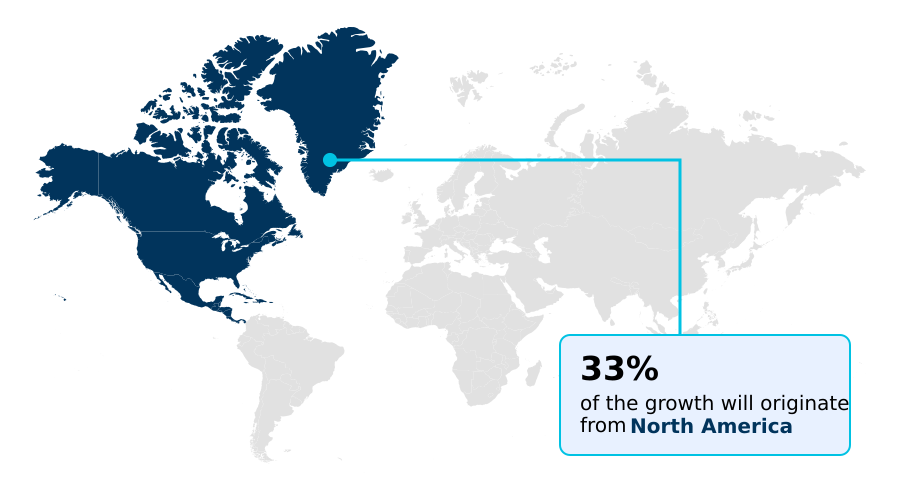
  • North America dominated the market and accounted for a 33.1% growth during the forecast period.
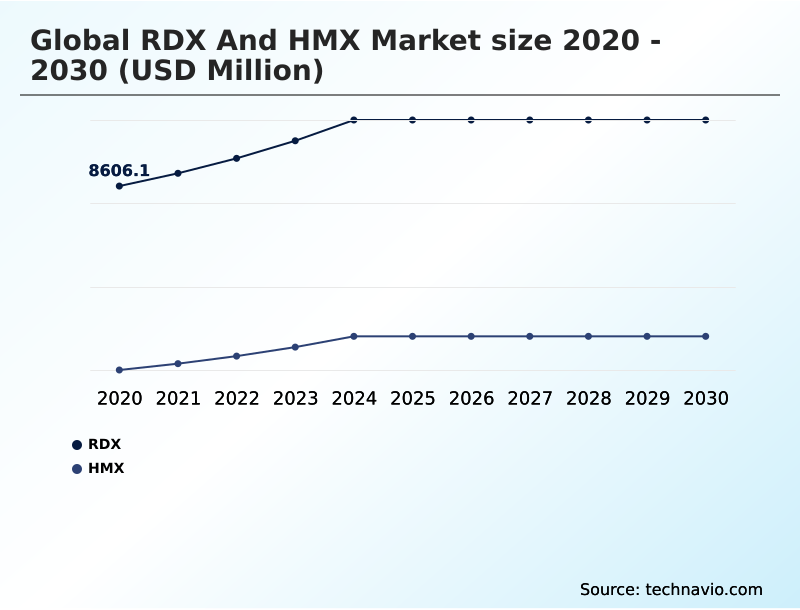
  • By Product - RDX segment was valued at USD 9.77 billion in 2024
  • By Application - Propellants segment accounted for the largest market revenue share in 2024

Market Size & Forecast

  • Market Opportunities: USD 6.45 billion
  • Market Future Opportunities: USD 4.02 billion
  • CAGR from 2025 to 2030 : 4.5%

Market Summary

  • The RDX and HMX market is undergoing a period of unprecedented expansion, driven by the dual imperatives of military modernization and the urgent replenishment of national munitions stockpiles. These powerful nitroamine high explosives are fundamental to a vast range of defense applications.
  • RDX serves as the workhorse for conventional ordnance like artillery shells, while HMX is critical for high-performance systems such as precision-guided missiles and anti-armor warheads. Key trends include a strategic shift toward insensitive munitions to enhance warfighter safety, leading to greater use of advanced polymer-bonded explosive formulations.
  • However, the industry faces significant challenges, including severe production bottlenecks from aging infrastructure and a fragile supply chain for critical precursor chemicals like nitric acid and hexamine.
  • A business scenario illustrating this is a prime defense contractor facing production delays for a missile system, not due to its own manufacturing, but because of a supply disruption of high-purity HMX from a single-source, state-controlled supplier, highlighting the critical need for supply chain diversification and resilience in the energetic materials ecosystem.

What will be the Size of the RDX And HMX Market during the forecast period?

Get Key Insights on Market Forecast (PDF) Request Free Sample

How is the RDX And HMX Market Segmented?

The rdx and hmx industry research report provides comprehensive data (region-wise segment analysis), with forecasts and estimates in "USD million" for the period 2026-2030, as well as historical data from 2020-2024 for the following segments.

  • Product
    • RDX
    • HMX
  • Application
    • Propellants
    • Explosives
    • Pyrotechnics
    • Others
  • End-user
    • Military and defense
    • Mining
    • Oil and gas
    • Aerospace
    • Others
  • Geography
    • North America
      • US
      • Canada
      • Mexico
    • APAC
      • China
      • India
      • Japan
    • Europe
      • Germany
      • France
      • UK
    • Middle East and Africa
      • Saudi Arabia
      • UAE
      • South Africa
    • South America
      • Brazil
      • Argentina
      • Colombia
    • Rest of World (ROW)

By Product Insights

The rdx segment is estimated to witness significant growth during the forecast period.

The global RDX and HMX market 2026-2030 is defined by its core product, application, and end-user segments.

Product segmentation focuses on nitroamine high explosives, with RDX serving high-volume needs in conventional ordnance and HMX utilized in high-performance systems requiring superior detonation velocity.

Application-based segmentation includes propellants for solid rocket motor systems, melt-cast explosives for munitions, and specialized pyrotechnics.

Key end-users are military and defense, which constitute the primary demand driver, alongside industrial sectors like mining and oil and gas, which use these energetic materials for specialized blasting and perforation charges.

Formulations such as composition b and other cast-cured explosives are central to these segments. The market's structure reflects a dependency on defense-grade precursor chemicals and advanced polymer-bonded explosive formulations, with RDX-based products accounting for over 60% of conventional munitions fills.

Request Free Sample

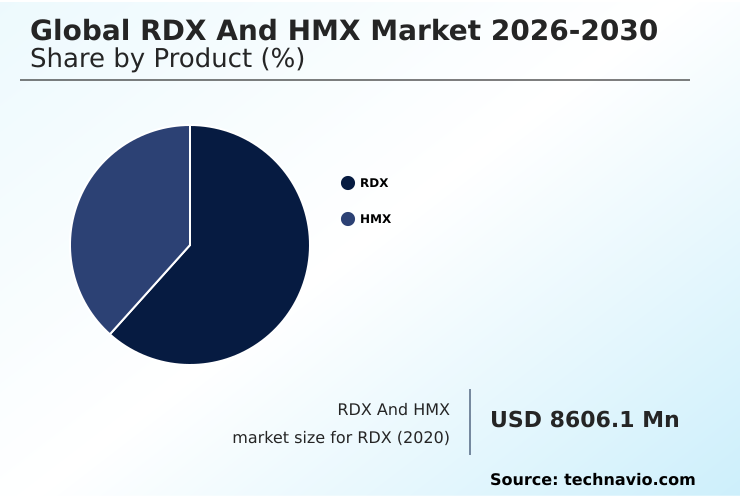
The RDX segment was valued at USD 9.77 billion in 2024 and showed a gradual increase during the forecast period.

Request Free Sample

Regional Analysis

North America is estimated to contribute 33.1% to the growth of the global market during the forecast period.Technavio’s analysts have elaborately explained the regional trends and drivers that shape the market during the forecast period.

See How RDX And HMX Market Demand is Rising in North America Request Free Sample

The geographic landscape of the global RDX and HMX market 2026-2030 is dominated by North America and Europe, driven by massive government-led initiatives to replenish munitions stockpiles and modernize armed forces.

North America, led by the US, is the largest region, accounting for 33.1% of the market's incremental growth, fueled by substantial contracts for artillery shells and investments in solid rocket motor production capacity.

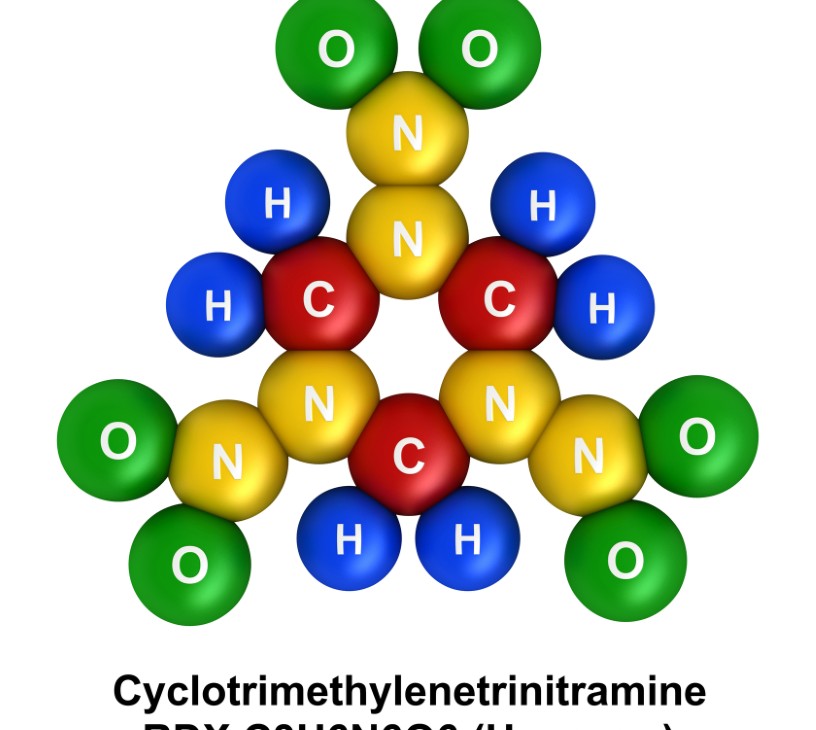
This has a direct impact on the demand for cyclotrimethylenetrinitramine. Europe is experiencing a historic revitalization, with nations launching multinational programs to increase ammunition output, focusing on both RDX for conventional munitions and HMX for next-generation missile systems.

The APAC region is the fastest-growing market, characterized by countries like India and South Korea focusing on indigenous defense industrialization to reduce import dependency for materials used in shaped-charge warheads and achieve self-reliance in military-grade explosives.

Market Dynamics

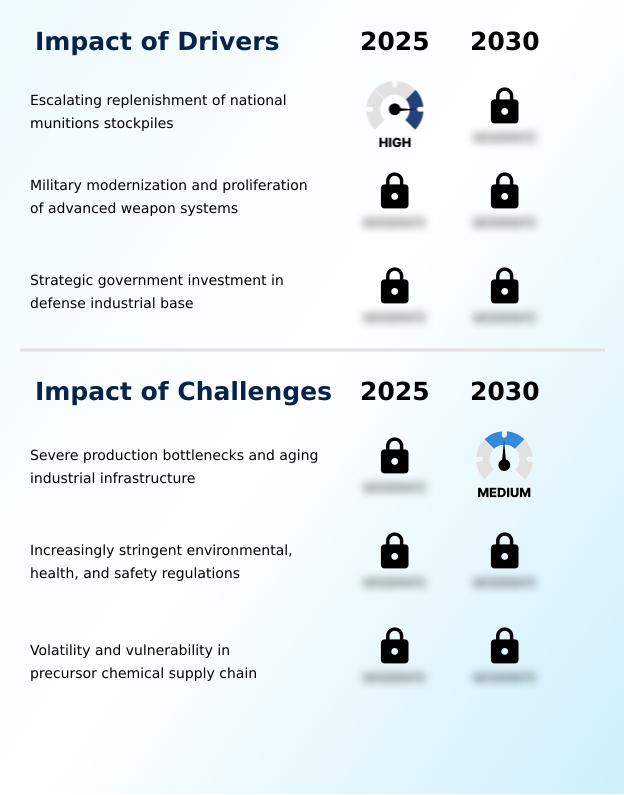
Our researchers analyzed the data with 2025 as the base year, along with the key drivers, trends, and challenges. A holistic analysis of drivers will help companies refine their marketing strategies to gain a competitive advantage.

  • Strategic decision-making in the global RDX and HMX market 2026-2030 is increasingly shaped by nuanced technical and operational factors beyond simple procurement. A critical consideration is the RDX vs. HMX performance characteristics trade-off; while RDX offers a cost-effective solution for high-volume conventional munitions, HMX is indispensable for advanced systems where higher detonation velocity is non-negotiable.
  • The manufacturing of polymer-bonded explosives is becoming a key differentiator, as it directly supports the push toward meeting stringent insensitive munitions safety standards, a critical factor in military modernization programs. This trend significantly impacts the design of advanced solid rocket motor propellants, where HMX-based formulations are essential for achieving superior thrust and range.
  • From a supply chain perspective, understanding the industrial synthesis of RDX and HMX is vital. The industry is grappling with vulnerabilities in the supply of precursor chemicals for high explosives. As a result, there is a strong push toward the modernization of energetic material plants to improve efficiency and safety.
  • For instance, facilities adopting continuous manufacturing processes can achieve qualification for new formulations up to 25% faster than those using traditional batch methods, providing a significant competitive advantage. This evolution underscores the shift from commodity production to highly engineered energetic material solutions.

What are the key market drivers leading to the rise in the adoption of RDX And HMX Industry?

  • The escalating replenishment of national munitions stockpiles, driven by geopolitical instability and heightened operational tempos, is a primary driver for the market.

  • The market is propelled by an unprecedented, coordinated effort to replenish national munitions stockpiles, particularly for conventional ordnance like 155mm artillery shells.
  • This has triggered urgent industrial mobilization, with governments issuing long-term contracts that are increasing production quotas by as much as 40% at key facilities.
  • This directly fuels demand for RDX, the primary energetic material in melt-cast explosives used for these shells. A parallel driver is unceasing military modernization, which fuels the high-value demand for HMX.
  • Its superior performance is essential for precision-guided munitions and advanced missile systems.
  • Strategic government investment in the defense industrial base, aimed at enhancing production capacity for materials like cyclotetramethylene-tetranitramine, de-risks capital expenditures and ensures a stable, long-term demand signal for the industry.

What are the market trends shaping the RDX And HMX Industry?

  • The market is witnessing an accelerated shift toward insensitive munitions and advanced polymer-bonded formulations, driven by stringent military safety requirements.

  • A dominant trend shaping the global RDX and HMX market 2026-2030 is the accelerated adoption of insensitive munitions (IM) and advanced polymer-bonded explosives (PBX). This shift is driven by a military doctrine that prioritizes the safety of personnel and high-value assets, compelling a move away from traditional melt-cast explosives.
  • PBX formulations, which suspend crystals of RDX or HMX in a polymer binder, can reduce accidental detonation risk by over 50%. This creates new opportunities for technological differentiation among defense contractors. Furthermore, the strategic reshoring of the entire energetic materials supply chain, including precursor chemicals like acetic anhydride, is reshaping the competitive landscape.
  • This trend favors large, integrated producers and is creating regional industrial champions backed by long-term government contracts, ensuring a resilient and self-sufficient industrial base.

What challenges does the RDX And HMX Industry face during its growth?

  • Severe production bottlenecks, stemming from aging industrial infrastructure and decades of underinvestment, pose a key challenge to meeting the current surge in demand.

  • A paramount challenge confronting the global RDX and HMX market 2026-2030 is the severe bottleneck in production capacity, a result of aging industrial infrastructure. The complex synthesis of military-grade explosives requires specialized facilities, and lead times for new plants can span several years.
  • This is compounded by increasingly stringent environmental regulations, which can add 15-20% to operational compliance costs and delay new construction. The industry is also highly vulnerable to volatility in the supply chain for essential precursor chemicals.
  • Disruptions in the supply of feedstocks like nitric acid can force manufacturers to reduce output by up to 20% in a single quarter, directly impacting their ability to fulfill urgent orders. Addressing the fragility of the supply of energetic material feedstocks is a critical priority for ensuring stable production.

Exclusive Technavio Analysis on Customer Landscape

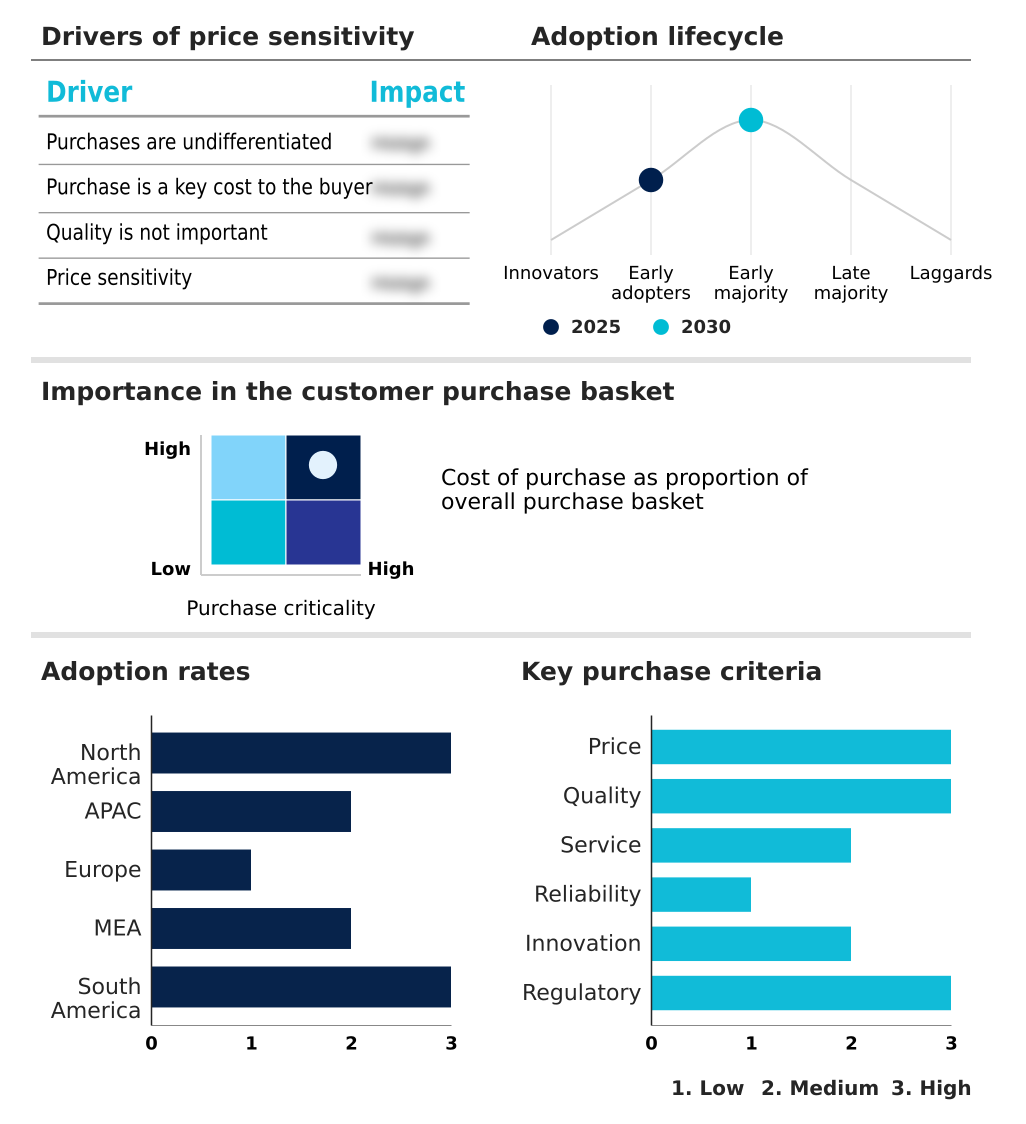
The rdx and hmx market forecasting report includes the adoption lifecycle of the market, covering from the innovator’s stage to the laggard’s stage. It focuses on adoption rates in different regions based on penetration. Furthermore, the rdx and hmx market report also includes key purchase criteria and drivers of price sensitivity to help companies evaluate and develop their market growth analysis strategies.

Customer Landscape of RDX And HMX Industry

Competitive Landscape

Companies are implementing various strategies, such as strategic alliances, rdx and hmx market forecast, partnerships, mergers and acquisitions, geographical expansion, and product/service launches, to enhance their presence in the industry.

Accurate Energetic LLC - Offerings include recrystallized RDX and crystallized HMX in multiple granulations, suitable for charges, detonating cords, and detonators, supported by dedicated plant manufacturing capabilities.

The industry research and growth report includes detailed analyses of the competitive landscape of the market and information about key companies, including:

  • Accurate Energetic LLC
  • AECI Ltd.
  • Austin Powder
  • BAE Systems Plc
  • Bohlen Gruppe
  • Chemring Group Plc
  • Eurenco
  • Explosia as
  • JOSEF MEISSNER GMBH
  • Natrochem Inc.
  • Nuberg
  • Orbitala Ltd
  • Premier Explosives Ltd
  • Pretoria Metal Pressings
  • PRVA ISKRA NAMENSKA
  • PT DAHANA
  • Rheinmetall AG
  • Solar Industries India Ltd.
  • STV GROUP

Qualitative and quantitative analysis of companies has been conducted to help clients understand the wider business environment as well as the strengths and weaknesses of key industry players. Data is qualitatively analyzed to categorize companies as pure play, category-focused, industry-focused, and diversified; it is quantitatively analyzed to categorize companies as dominant, leading, strong, tentative, and weak.

Recent Development and News in Rdx and hmx market

  • In September, 2025, Global Military Products was awarded a contract valued at nearly $640 million by the U.S. Army for the procurement of 155mm High Explosive projectiles, directly increasing demand for RDX-based explosive fills.
  • In August, 2025, MSM North America, a subsidiary of the Czechoslovak Group, received a contract worth over $630 million to construct and equip a new Future Artillery Complex designed to load, assemble, and pack 36,000 155mm rounds per month.
  • In July, 2025, L3Harris announced an initiative to build an extensive large solid rocket motor production campus in Camden, Arkansas, a strategic investment to secure the industrial base for future missile defense and hypersonic programs.
  • In April, 2025, Lockheed Martin and General Dynamics reported that their joint initiative to bolster solid rocket motor production remains on schedule, with their new Arkansas facility poised to begin qualification builds in 2026.

Dive into Technavio’s robust research methodology, blending expert interviews, extensive data synthesis, and validated models for unparalleled RDX And HMX Market insights. See full methodology.

Market Scope
Page number 302
Base year 2025
Historic period 2020-2024
Forecast period 2026-2030
Growth momentum & CAGR Accelerate at a CAGR of 4.5%
Market growth 2026-2030 USD 4019.5 million
Market structure Fragmented
YoY growth 2025-2026(%) 4.3%
Key countries US, Canada, Mexico, China, India, Japan, South Korea, Australia, Indonesia, Germany, France, UK, Italy, The Netherlands, Spain, Saudi Arabia, UAE, South Africa, Israel, Turkey, Brazil, Argentina and Colombia
Competitive landscape Leading Companies, Market Positioning of Companies, Competitive Strategies, and Industry Risks

Request Free Sample

Research Analyst Overview

  • The global RDX and HMX market 2026-2030 is in a state of strategic realignment, moving beyond routine procurement to urgent industrial mobilization. The core dynamic is the massive demand for conventional ordnance, which elevates the importance of RDX, or cyclotrimethylenetrinitramine, the primary component in melt-cast explosives like Composition B.
  • Concurrently, military modernization programs focused on technological overmatch sustain high-value demand for HMX, or cyclotetramethylene-tetranitramine, which is critical for the shaped-charge warheads in precision-guided munitions and as a key solid rocket propellant ingredient. A key boardroom-level consideration is the strategic risk associated with the fragile precursor chemical supply chain.
  • This vulnerability is compelling governments to co-invest in reshoring the production of feedstocks like hexamine and nitric acid. This shift favors large, vertically integrated defense contractors capable of managing the entire energetic materials ecosystem, from chemical synthesis to munition filling.
  • The modernization of production, such as the adoption of continuous nitration facility technology, is a critical trend, with new plants projected to increase RDX output by 30% while enhancing safety and reducing environmental impact.

What are the Key Data Covered in this RDX And HMX Market Research and Growth Report?

  • What is the expected growth of the RDX And HMX Market between 2026 and 2030?

    • USD 4.02 billion, at a CAGR of 4.5%

  • What segmentation does the market report cover?

    • The report is segmented by Product (RDX, and HMX), Application (Propellants, Explosives, Pyrotechnics, and Others), End-user (Military and defense, Mining, Oil and gas, Aerospace, and Others) and Geography (North America, APAC, Europe, Middle East and Africa, South America)

  • Which regions are analyzed in the report?

    • North America, APAC, Europe, Middle East and Africa and South America

  • What are the key growth drivers and market challenges?

    • Escalating replenishment of national munitions stockpiles, Severe production bottlenecks and aging industrial infrastructure

  • Who are the major players in the RDX And HMX Market?

    • Accurate Energetic LLC, AECI Ltd., Austin Powder, BAE Systems Plc, Bohlen Gruppe, Chemring Group Plc, Eurenco, Explosia as, JOSEF MEISSNER GMBH, Natrochem Inc., Nuberg, Orbitala Ltd, Premier Explosives Ltd, Pretoria Metal Pressings, PRVA ISKRA NAMENSKA, PT DAHANA, Rheinmetall AG, Solar Industries India Ltd. and STV GROUP

Market Research Insights

  • The market's dynamics are shaped by a strategic pivot toward supply chain resilience and manufacturing modernization. Investments in continuous nitration facility technology are enhancing production efficiency, with some modernized plants reducing hazardous waste by over 60%. This focus on advanced production processes for energetic materials directly addresses the vulnerabilities in the global precursor chemical supply chain.
  • The adoption of insensitive munitions (IM) is another key dynamic, with new IM-compliant formulations reducing accidental detonation risk by over 50% compared to legacy explosives. This shift not only improves safety but also creates demand for higher-value polymer-bonded explosives and specialized HMX formulations.
  • The emphasis on technological overmatch ensures sustained funding for research into next-generation explosives with superior detonation velocity and thermal stability. These factors collectively create a market where security of supply, safety, and performance are becoming as critical as cost.

We can help! Our analysts can customize this rdx and hmx market research report to meet your requirements.

Get in touch

1. Executive Summary

1.1 Market overview

Executive Summary - Chart on Market Overview
Executive Summary - Data Table on Market Overview
Executive Summary - Chart on Global Market Characteristics
Executive Summary - Chart on Market by Geography
Executive Summary - Chart on Market Segmentation by Product
Executive Summary - Chart on Market Segmentation by Application
Executive Summary - Chart on Market Segmentation by End-user
Executive Summary - Chart on Incremental Growth
Executive Summary - Data Table on Incremental Growth
Executive Summary - Chart on Company Market Positioning

2. Technavio Analysis

2.1 Analysis of price sensitivity, lifecycle, customer purchase basket, adoption rates, and purchase criteria

2.2 Criticality of inputs and Factors of differentiation

Chart on Overview on criticality of inputs and factors of differentiation

2.3 Factors of disruption

Chart on Overview on factors of disruption

2.4 Impact of drivers and challenges

Chart on Impact of drivers and challenges in 2025 and 2030

3. Market Landscape

3.1 Market ecosystem

Chart on Parent Market
Data Table on - Parent Market

3.2 Market characteristics

Chart on Market characteristics analysis

3.3 Value chain analysis

Chart on Value chain analysis

4. Market Sizing

4.1 Market definition

Data Table on Offerings of companies included in the market definition

4.2 Market segment analysis

Market segments

4.3 Market size 2025

4.4 Market outlook: Forecast for 2025-2030

Chart on Global - Market size and forecast 2025-2030 ($ million)
Data Table on Global - Market size and forecast 2025-2030 ($ million)
Chart on Global Market: Year-over-year growth 2025-2030 (%)
Data Table on Global Market: Year-over-year growth 2025-2030 (%)

5. Historic Market Size

5.1 Global RDX And HMX Market 2020 - 2024

Historic Market Size - Data Table on Global RDX And HMX Market 2020 - 2024 ($ million)

5.2 Product segment analysis 2020 - 2024

Historic Market Size - Product Segment 2020 - 2024 ($ million)

5.3 Application segment analysis 2020 - 2024

Historic Market Size - Application Segment 2020 - 2024 ($ million)

5.4 End-user segment analysis 2020 - 2024

Historic Market Size - End-user Segment 2020 - 2024 ($ million)

5.5 Geography segment analysis 2020 - 2024

Historic Market Size - Geography Segment 2020 - 2024 ($ million)

5.6 Country segment analysis 2020 - 2024

Historic Market Size - Country Segment 2020 - 2024 ($ million)

6. Qualitative Analysis

6.1 The AI impact on global RDX and HMX market

7. Five Forces Analysis

7.1 Five forces summary

Five forces analysis - Comparison between 2025 and 2030

7.2 Bargaining power of buyers

Bargaining power of buyers - Impact of key factors 2025 and 2030

7.3 Bargaining power of suppliers

Bargaining power of suppliers - Impact of key factors in 2025 and 2030

7.4 Threat of new entrants

Threat of new entrants - Impact of key factors in 2025 and 2030

7.5 Threat of substitutes

Threat of substitutes - Impact of key factors in 2025 and 2030

7.6 Threat of rivalry

Threat of rivalry - Impact of key factors in 2025 and 2030

7.7 Market condition

Chart on Market condition - Five forces 2025 and 2030

8. Market Segmentation by Product

8.1 Market segments

Chart on Product - Market share 2025-2030 (%)
Data Table on Product - Market share 2025-2030 (%)

8.2 Comparison by Product

Chart on Comparison by Product
Data Table on Comparison by Product

8.3 RDX - Market size and forecast 2025-2030

Chart on RDX - Market size and forecast 2025-2030 ($ million)
Data Table on RDX - Market size and forecast 2025-2030 ($ million)
Chart on RDX - Year-over-year growth 2025-2030 (%)
Data Table on RDX - Year-over-year growth 2025-2030 (%)

8.4 HMX - Market size and forecast 2025-2030

Chart on HMX - Market size and forecast 2025-2030 ($ million)
Data Table on HMX - Market size and forecast 2025-2030 ($ million)
Chart on HMX - Year-over-year growth 2025-2030 (%)
Data Table on HMX - Year-over-year growth 2025-2030 (%)

8.5 Market opportunity by Product

Market opportunity by Product ($ million)
Data Table on Market opportunity by Product ($ million)

9. Market Segmentation by Application

9.1 Market segments

Chart on Application - Market share 2025-2030 (%)
Data Table on Application - Market share 2025-2030 (%)

9.2 Comparison by Application

Chart on Comparison by Application
Data Table on Comparison by Application

9.3 Propellants - Market size and forecast 2025-2030

Chart on Propellants - Market size and forecast 2025-2030 ($ million)
Data Table on Propellants - Market size and forecast 2025-2030 ($ million)
Chart on Propellants - Year-over-year growth 2025-2030 (%)
Data Table on Propellants - Year-over-year growth 2025-2030 (%)

9.4 Explosives - Market size and forecast 2025-2030

Chart on Explosives - Market size and forecast 2025-2030 ($ million)
Data Table on Explosives - Market size and forecast 2025-2030 ($ million)
Chart on Explosives - Year-over-year growth 2025-2030 (%)
Data Table on Explosives - Year-over-year growth 2025-2030 (%)

9.5 Pyrotechnics - Market size and forecast 2025-2030

Chart on Pyrotechnics - Market size and forecast 2025-2030 ($ million)
Data Table on Pyrotechnics - Market size and forecast 2025-2030 ($ million)
Chart on Pyrotechnics - Year-over-year growth 2025-2030 (%)
Data Table on Pyrotechnics - Year-over-year growth 2025-2030 (%)

9.6 Others - Market size and forecast 2025-2030

Chart on Others - Market size and forecast 2025-2030 ($ million)
Data Table on Others - Market size and forecast 2025-2030 ($ million)
Chart on Others - Year-over-year growth 2025-2030 (%)
Data Table on Others - Year-over-year growth 2025-2030 (%)

9.7 Market opportunity by Application

Market opportunity by Application ($ million)
Data Table on Market opportunity by Application ($ million)

10. Market Segmentation by End-user

10.1 Market segments

Chart on End-user - Market share 2025-2030 (%)
Data Table on End-user - Market share 2025-2030 (%)

10.2 Comparison by End-user

Chart on Comparison by End-user
Data Table on Comparison by End-user

10.3 Military and defense - Market size and forecast 2025-2030

Chart on Military and defense - Market size and forecast 2025-2030 ($ million)
Data Table on Military and defense - Market size and forecast 2025-2030 ($ million)
Chart on Military and defense - Year-over-year growth 2025-2030 (%)
Data Table on Military and defense - Year-over-year growth 2025-2030 (%)

10.4 Mining - Market size and forecast 2025-2030

Chart on Mining - Market size and forecast 2025-2030 ($ million)
Data Table on Mining - Market size and forecast 2025-2030 ($ million)
Chart on Mining - Year-over-year growth 2025-2030 (%)
Data Table on Mining - Year-over-year growth 2025-2030 (%)

10.5 Oil and gas - Market size and forecast 2025-2030

Chart on Oil and gas - Market size and forecast 2025-2030 ($ million)
Data Table on Oil and gas - Market size and forecast 2025-2030 ($ million)
Chart on Oil and gas - Year-over-year growth 2025-2030 (%)
Data Table on Oil and gas - Year-over-year growth 2025-2030 (%)

10.6 Aerospace - Market size and forecast 2025-2030

Chart on Aerospace - Market size and forecast 2025-2030 ($ million)
Data Table on Aerospace - Market size and forecast 2025-2030 ($ million)
Chart on Aerospace - Year-over-year growth 2025-2030 (%)
Data Table on Aerospace - Year-over-year growth 2025-2030 (%)

10.7 Others - Market size and forecast 2025-2030

Chart on Others - Market size and forecast 2025-2030 ($ million)
Data Table on Others - Market size and forecast 2025-2030 ($ million)
Chart on Others - Year-over-year growth 2025-2030 (%)
Data Table on Others - Year-over-year growth 2025-2030 (%)

10.8 Market opportunity by End-user

Market opportunity by End-user ($ million)
Data Table on Market opportunity by End-user ($ million)

11. Customer Landscape

11.1 Customer landscape overview

Analysis of price sensitivity, lifecycle, customer purchase basket, adoption rates, and purchase criteria

12. Geographic Landscape

12.1 Geographic segmentation

Chart on Market share by geography 2025-2030 (%)
Data Table on Market share by geography 2025-2030 (%)

12.2 Geographic comparison

Chart on Geographic comparison
Data Table on Geographic comparison

12.3 North America - Market size and forecast 2025-2030

Chart on North America - Market size and forecast 2025-2030 ($ million)
Data Table on North America - Market size and forecast 2025-2030 ($ million)
Chart on North America - Year-over-year growth 2025-2030 (%)
Data Table on North America - Year-over-year growth 2025-2030 (%)
Chart on Regional Comparison - North America
Data Table on Regional Comparison - North America

12.3.1 US - Market size and forecast 2025-2030

Chart on US - Market size and forecast 2025-2030 ($ million)
Data Table on US - Market size and forecast 2025-2030 ($ million)
Chart on US - Year-over-year growth 2025-2030 (%)
Data Table on US - Year-over-year growth 2025-2030 (%)

12.3.2 Canada - Market size and forecast 2025-2030

Chart on Canada - Market size and forecast 2025-2030 ($ million)
Data Table on Canada - Market size and forecast 2025-2030 ($ million)
Chart on Canada - Year-over-year growth 2025-2030 (%)
Data Table on Canada - Year-over-year growth 2025-2030 (%)

12.3.3 Mexico - Market size and forecast 2025-2030

Chart on Mexico - Market size and forecast 2025-2030 ($ million)
Data Table on Mexico - Market size and forecast 2025-2030 ($ million)
Chart on Mexico - Year-over-year growth 2025-2030 (%)
Data Table on Mexico - Year-over-year growth 2025-2030 (%)

12.4 APAC - Market size and forecast 2025-2030

Chart on APAC - Market size and forecast 2025-2030 ($ million)
Data Table on APAC - Market size and forecast 2025-2030 ($ million)
Chart on APAC - Year-over-year growth 2025-2030 (%)
Data Table on APAC - Year-over-year growth 2025-2030 (%)
Chart on Regional Comparison - APAC
Data Table on Regional Comparison - APAC

12.4.1 China - Market size and forecast 2025-2030

Chart on China - Market size and forecast 2025-2030 ($ million)
Data Table on China - Market size and forecast 2025-2030 ($ million)
Chart on China - Year-over-year growth 2025-2030 (%)
Data Table on China - Year-over-year growth 2025-2030 (%)

12.4.2 India - Market size and forecast 2025-2030

Chart on India - Market size and forecast 2025-2030 ($ million)
Data Table on India - Market size and forecast 2025-2030 ($ million)
Chart on India - Year-over-year growth 2025-2030 (%)
Data Table on India - Year-over-year growth 2025-2030 (%)

12.4.3 Japan - Market size and forecast 2025-2030

Chart on Japan - Market size and forecast 2025-2030 ($ million)
Data Table on Japan - Market size and forecast 2025-2030 ($ million)
Chart on Japan - Year-over-year growth 2025-2030 (%)
Data Table on Japan - Year-over-year growth 2025-2030 (%)

12.4.4 South Korea - Market size and forecast 2025-2030

Chart on South Korea - Market size and forecast 2025-2030 ($ million)
Data Table on South Korea - Market size and forecast 2025-2030 ($ million)
Chart on South Korea - Year-over-year growth 2025-2030 (%)
Data Table on South Korea - Year-over-year growth 2025-2030 (%)

12.4.5 Australia - Market size and forecast 2025-2030

Chart on Australia - Market size and forecast 2025-2030 ($ million)
Data Table on Australia - Market size and forecast 2025-2030 ($ million)
Chart on Australia - Year-over-year growth 2025-2030 (%)
Data Table on Australia - Year-over-year growth 2025-2030 (%)

12.4.6 Indonesia - Market size and forecast 2025-2030

Chart on Indonesia - Market size and forecast 2025-2030 ($ million)
Data Table on Indonesia - Market size and forecast 2025-2030 ($ million)
Chart on Indonesia - Year-over-year growth 2025-2030 (%)
Data Table on Indonesia - Year-over-year growth 2025-2030 (%)

12.5 Europe - Market size and forecast 2025-2030

Chart on Europe - Market size and forecast 2025-2030 ($ million)
Data Table on Europe - Market size and forecast 2025-2030 ($ million)
Chart on Europe - Year-over-year growth 2025-2030 (%)
Data Table on Europe - Year-over-year growth 2025-2030 (%)
Chart on Regional Comparison - Europe
Data Table on Regional Comparison - Europe

12.5.1 Germany - Market size and forecast 2025-2030

Chart on Germany - Market size and forecast 2025-2030 ($ million)
Data Table on Germany - Market size and forecast 2025-2030 ($ million)
Chart on Germany - Year-over-year growth 2025-2030 (%)
Data Table on Germany - Year-over-year growth 2025-2030 (%)

12.5.2 France - Market size and forecast 2025-2030

Chart on France - Market size and forecast 2025-2030 ($ million)
Data Table on France - Market size and forecast 2025-2030 ($ million)
Chart on France - Year-over-year growth 2025-2030 (%)
Data Table on France - Year-over-year growth 2025-2030 (%)

12.5.3 UK - Market size and forecast 2025-2030

Chart on UK - Market size and forecast 2025-2030 ($ million)
Data Table on UK - Market size and forecast 2025-2030 ($ million)
Chart on UK - Year-over-year growth 2025-2030 (%)
Data Table on UK - Year-over-year growth 2025-2030 (%)

12.5.4 Italy - Market size and forecast 2025-2030

Chart on Italy - Market size and forecast 2025-2030 ($ million)
Data Table on Italy - Market size and forecast 2025-2030 ($ million)
Chart on Italy - Year-over-year growth 2025-2030 (%)
Data Table on Italy - Year-over-year growth 2025-2030 (%)

12.5.5 The Netherlands - Market size and forecast 2025-2030

Chart on The Netherlands - Market size and forecast 2025-2030 ($ million)
Data Table on The Netherlands - Market size and forecast 2025-2030 ($ million)
Chart on The Netherlands - Year-over-year growth 2025-2030 (%)
Data Table on The Netherlands - Year-over-year growth 2025-2030 (%)

12.5.6 Spain - Market size and forecast 2025-2030

Chart on Spain - Market size and forecast 2025-2030 ($ million)
Data Table on Spain - Market size and forecast 2025-2030 ($ million)
Chart on Spain - Year-over-year growth 2025-2030 (%)
Data Table on Spain - Year-over-year growth 2025-2030 (%)

12.6 Middle East and Africa - Market size and forecast 2025-2030

Chart on Middle East and Africa - Market size and forecast 2025-2030 ($ million)
Data Table on Middle East and Africa - Market size and forecast 2025-2030 ($ million)
Chart on Middle East and Africa - Year-over-year growth 2025-2030 (%)
Data Table on Middle East and Africa - Year-over-year growth 2025-2030 (%)
Chart on Regional Comparison - Middle East and Africa
Data Table on Regional Comparison - Middle East and Africa

12.6.1 Saudi Arabia - Market size and forecast 2025-2030

Chart on Saudi Arabia - Market size and forecast 2025-2030 ($ million)
Data Table on Saudi Arabia - Market size and forecast 2025-2030 ($ million)
Chart on Saudi Arabia - Year-over-year growth 2025-2030 (%)
Data Table on Saudi Arabia - Year-over-year growth 2025-2030 (%)

12.6.2 UAE - Market size and forecast 2025-2030

Chart on UAE - Market size and forecast 2025-2030 ($ million)
Data Table on UAE - Market size and forecast 2025-2030 ($ million)
Chart on UAE - Year-over-year growth 2025-2030 (%)
Data Table on UAE - Year-over-year growth 2025-2030 (%)

12.6.3 South Africa - Market size and forecast 2025-2030

Chart on South Africa - Market size and forecast 2025-2030 ($ million)
Data Table on South Africa - Market size and forecast 2025-2030 ($ million)
Chart on South Africa - Year-over-year growth 2025-2030 (%)
Data Table on South Africa - Year-over-year growth 2025-2030 (%)

12.6.4 Israel - Market size and forecast 2025-2030

Chart on Israel - Market size and forecast 2025-2030 ($ million)
Data Table on Israel - Market size and forecast 2025-2030 ($ million)
Chart on Israel - Year-over-year growth 2025-2030 (%)
Data Table on Israel - Year-over-year growth 2025-2030 (%)

12.6.5 Turkey - Market size and forecast 2025-2030

Chart on Turkey - Market size and forecast 2025-2030 ($ million)
Data Table on Turkey - Market size and forecast 2025-2030 ($ million)
Chart on Turkey - Year-over-year growth 2025-2030 (%)
Data Table on Turkey - Year-over-year growth 2025-2030 (%)

12.7 South America - Market size and forecast 2025-2030

Chart on South America - Market size and forecast 2025-2030 ($ million)
Data Table on South America - Market size and forecast 2025-2030 ($ million)
Chart on South America - Year-over-year growth 2025-2030 (%)
Data Table on South America - Year-over-year growth 2025-2030 (%)
Chart on Regional Comparison - South America
Data Table on Regional Comparison - South America

12.7.1 Brazil - Market size and forecast 2025-2030

Chart on Brazil - Market size and forecast 2025-2030 ($ million)
Data Table on Brazil - Market size and forecast 2025-2030 ($ million)
Chart on Brazil - Year-over-year growth 2025-2030 (%)
Data Table on Brazil - Year-over-year growth 2025-2030 (%)

12.7.2 Argentina - Market size and forecast 2025-2030

Chart on Argentina - Market size and forecast 2025-2030 ($ million)
Data Table on Argentina - Market size and forecast 2025-2030 ($ million)
Chart on Argentina - Year-over-year growth 2025-2030 (%)
Data Table on Argentina - Year-over-year growth 2025-2030 (%)

12.7.3 Colombia - Market size and forecast 2025-2030

Chart on Colombia - Market size and forecast 2025-2030 ($ million)
Data Table on Colombia - Market size and forecast 2025-2030 ($ million)
Chart on Colombia - Year-over-year growth 2025-2030 (%)
Data Table on Colombia - Year-over-year growth 2025-2030 (%)

12.8 Market opportunity by geography

Market opportunity by geography ($ million)
Data Tables on Market opportunity by geography ($ million)

13. Drivers, Challenges, and Opportunity

13.1 Market drivers

Escalating replenishment of national munitions stockpiles
Military modernization and proliferation of advanced weapon systems
Strategic government investment in defense industrial base

13.2 Market challenges

Severe production bottlenecks and aging industrial infrastructure
Increasingly stringent environmental, health, and safety regulations
Volatility and vulnerability in precursor chemical supply chain

13.3 Impact of drivers and challenges

Impact of drivers and challenges in 2025 and 2030

13.4 Market opportunities

Accelerated shift towards insensitive munitions and polymer-bonded formulations
Strategic reshoring and vertical integration of energetics supply chain
Modernization of production through continuous manufacturing and automation

14. Competitive Landscape

14.1 Overview

14.2

Overview on criticality of inputs and factors of differentiation

14.3 Landscape disruption

Overview on factors of disruption

14.4 Industry risks

Impact of key risks on business

15. Competitive Analysis

15.1 Companies profiled

Companies covered

15.2 Company ranking index

15.3 Market positioning of companies

Matrix on companies position and classification

15.4 AECI Ltd.

AECI Ltd. - Overview
AECI Ltd. - Product / Service
AECI Ltd. - Key offerings
SWOT

15.5 Austin Powder

Austin Powder - Overview
Austin Powder - Product / Service
Austin Powder - Key offerings
SWOT

15.6 BAE Systems Plc

BAE Systems Plc - Overview
BAE Systems Plc - Business segments
BAE Systems Plc - Key news
BAE Systems Plc - Key offerings
BAE Systems Plc - Segment focus
SWOT

15.7 Bohlen Gruppe

Bohlen Gruppe - Overview
Bohlen Gruppe - Product / Service
Bohlen Gruppe - Key offerings
SWOT

15.8 Chemring Group Plc

Chemring Group Plc - Overview
Chemring Group Plc - Business segments
Chemring Group Plc - Key offerings
Chemring Group Plc - Segment focus
SWOT

15.9 Eurenco

Eurenco - Overview
Eurenco - Product / Service
Eurenco - Key offerings
SWOT

15.10 Natrochem Inc.

Natrochem Inc. - Overview
Natrochem Inc. - Product / Service
Natrochem Inc. - Key offerings
SWOT

15.11 Nuberg

Nuberg - Overview
Nuberg - Product / Service
Nuberg - Key offerings
SWOT

15.12 Premier Explosives Ltd

Premier Explosives Ltd - Overview
Premier Explosives Ltd - Product / Service
Premier Explosives Ltd - Key offerings
SWOT

15.13 Pretoria Metal Pressings

Pretoria Metal Pressings - Overview
Pretoria Metal Pressings - Product / Service
Pretoria Metal Pressings - Key offerings
SWOT

15.14 PRVA ISKRA NAMENSKA

PRVA ISKRA NAMENSKA - Overview
PRVA ISKRA NAMENSKA - Product / Service
PRVA ISKRA NAMENSKA - Key offerings
SWOT

15.15 PT DAHANA

PT DAHANA - Overview
PT DAHANA - Product / Service
PT DAHANA - Key offerings
SWOT

15.16 Rheinmetall AG

Rheinmetall AG - Overview
Rheinmetall AG - Business segments
Rheinmetall AG - Key offerings
Rheinmetall AG - Segment focus
SWOT

15.17 Solar Industries India Ltd.

Solar Industries India Ltd. - Overview
Solar Industries India Ltd. - Product / Service
Solar Industries India Ltd. - Key offerings
SWOT

15.18 STV GROUP

STV GROUP - Overview
STV GROUP - Product / Service
STV GROUP - Key offerings
SWOT

16. Appendix

16.1 Scope of the report

Market definition
Objectives
Notes and caveats

16.2 Inclusions and exclusions checklist

Inclusions checklist
Exclusions checklist

16.3 Currency conversion rates for US$

16.4 Research methodology

16.5 Data procurement

Information sources

16.6 Data validation

16.7 Validation techniques employed for market sizing

16.8 Data synthesis

16.9 360 degree market analysis

16.10 List of abbreviations

Research Methodology

Technavio presents a detailed picture of the market by way of study, synthesis, and summation of data from multiple sources. The analysts have presented the various facets of the market with a particular focus on identifying the key industry influencers. The data thus presented is comprehensive, reliable, and the result of extensive research, both primary and secondary.

INFORMATION SOURCES

Primary sources

  • Manufacturers and suppliers
  • Channel partners
  • Industry experts
  • Strategic decision makers

Secondary sources

  • Industry journals and periodicals
  • Government data
  • Financial reports of key industry players
  • Historical data
  • Press releases

DATA ANALYSIS

Data Synthesis

  • Collation of data
  • Estimation of key figures
  • Analysis of derived insights

Data Validation

  • Triangulation with data models
  • Reference against proprietary databases
  • Corroboration with industry experts

REPORT WRITING

Qualitative

  • Market drivers
  • Market challenges
  • Market trends
  • Five forces analysis

Quantitative

  • Market size and forecast
  • Market segmentation
  • Geographical insights
  • Competitive landscape

Interested in this report?

Get your sample now to see our research methodology and insights!

Download Now

Frequently Asked Questions

RDX And HMX market growth will increase by USD 4019.5 million during 2026-2030 .

The RDX And HMX market is expected to grow at a CAGR of 4.5% during 2026-2030 .

RDX And HMX market is segmented by Product (RDX, HMX) Application (Propellants, Explosives, Pyrotechnics, Others) End-user (Military and defense, Mining, Oil and gas, Aerospace, Others)

Accurate Energetic LLC, AECI Ltd., Austin Powder, BAE Systems Plc, Bohlen Gruppe, Chemring Group Plc, Eurenco, Explosia as, JOSEF MEISSNER GMBH, Natrochem Inc., Nuberg, Orbitala Ltd, Premier Explosives Ltd, Pretoria Metal Pressings, PRVA ISKRA NAMENSKA, PT DAHANA, Rheinmetall AG, Solar Industries India Ltd., STV GROUP are a few of the key vendors in the RDX And HMX market.

North America will register the highest growth rate of 33.1% among the other regions. Therefore, the RDX And HMX market in North America is expected to garner significant business opportunities for the vendors during the forecast period.

US, Canada, Mexico, China, India, Japan, South Korea, Australia, Indonesia, Germany, France, UK, Italy, The Netherlands, Spain, Saudi Arabia, UAE, South Africa, Israel, Turkey, Brazil, Argentina, Colombia

  • Escalating replenishment of national munitions stockpiles is the driving factor this market.

The RDX And HMX market vendors should focus on grabbing business opportunities from the Product segment as it accounted for the largest market share in the base year.