Reciprocating Plunger Pump Market Analysis, Size, and Forecast 2026-2030: APAC (China, Japan, and India), North America (US, Canada, and Mexico), Europe (Germany, UK, and France), Middle East and Africa (Saudi Arabia, UAE, and South Africa), South America (Brazil, Argentina, and Colombia), and Rest of World (ROW)

Reciprocating Plunger Pump Market Analysis, Size, and Forecast 2026-2030:
APAC (China, Japan, and India), North America (US, Canada, and Mexico), Europe (Germany, UK, and France), Middle East and Africa (Saudi Arabia, UAE, and South Africa), South America (Brazil, Argentina, and Colombia), and Rest of World (ROW)

Published: May 2026 309 Pages SKU: IRTNTR81482

Market Overview at a Glance

$1.44 B
Market Opportunity
6.1%
CAGR 2025 - 2030
37.5%
APAC Growth
$1.76 B
High pressure segment 2024

Reciprocating Plunger Pump Market Size 2026-2030

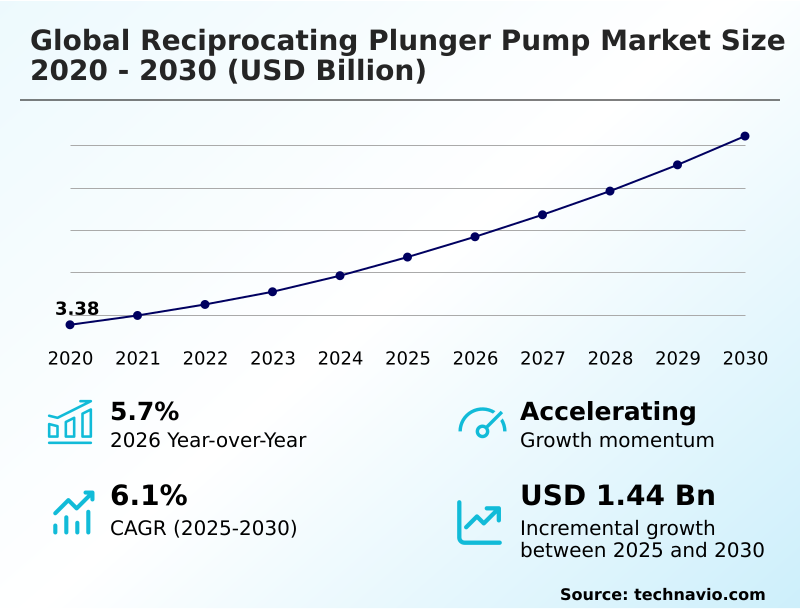
The reciprocating plunger pump market size is valued to increase by USD 1.44 billion, at a CAGR of 6.1% from 2025 to 2030. Expansion of global wastewater treatment infrastructure will drive the reciprocating plunger pump market.

Major Market Trends & Insights

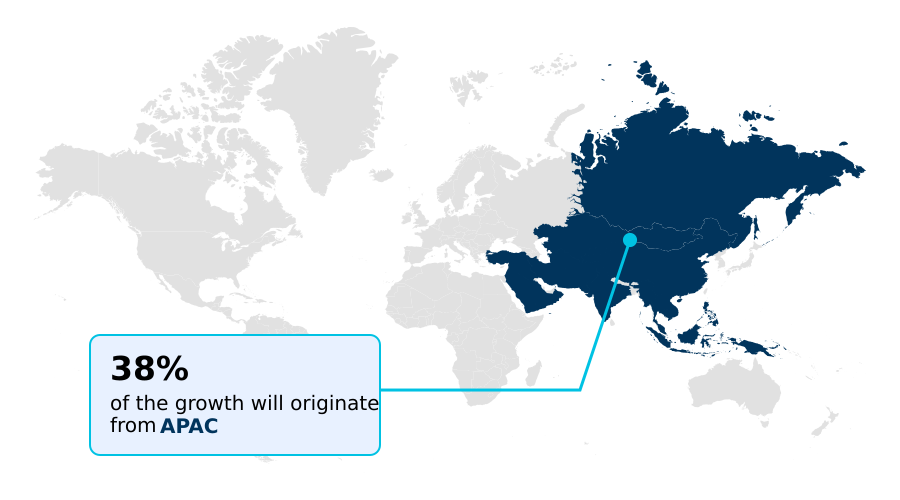
  • APAC dominated the market and accounted for a 37.5% growth during the forecast period.
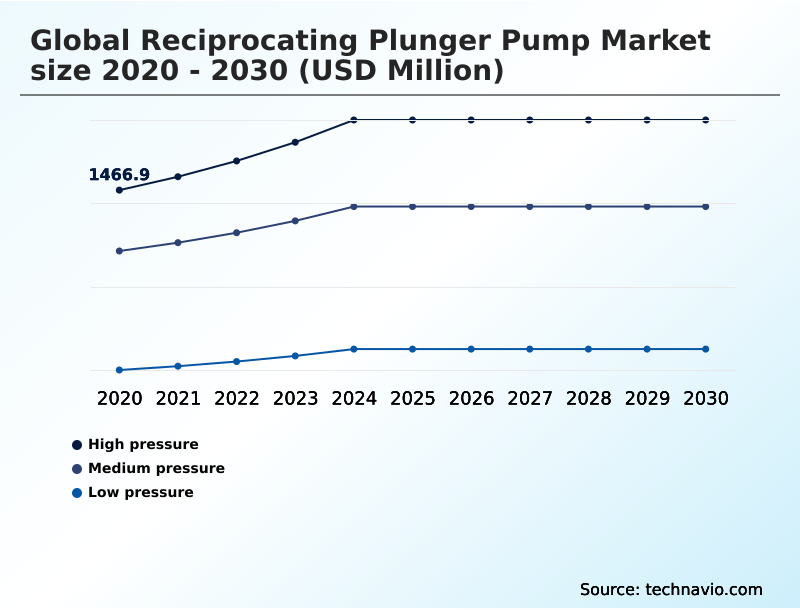
  • By Type - High pressure segment was valued at USD 1.76 billion in 2024
  • By Application - Oil and gas segment accounted for the largest market revenue share in 2024

Market Size & Forecast

  • Market Opportunities: USD 2.23 billion
  • Market Future Opportunities: USD 1.44 billion
  • CAGR from 2025 to 2030 : 6.1%

Market Summary

  • The reciprocating plunger pump market is defined by its critical role in providing high-pressure fluid handling across demanding industrial sectors. Growth is fueled by relentless demand from oil and gas exploration for activities like hydraulic fracturing, along with the global expansion of advanced wastewater treatment facilities.
  • These sectors require the robust performance and volumetric efficiency inherent to the positive displacement principle to manage abrasive slurries and achieve precise chemical dosing. A key trend transforming the landscape is the integration of Industrial Internet of Things (IIoT) and predictive maintenance sensors, which shifts maintenance from a reactive to a proactive model.
  • For instance, a chemical processing plant can leverage this technology to monitor pump health in real-time, ensuring precise, leak-free operation to maintain product quality and comply with stringent safety regulations, thereby avoiding costly production halts and environmental incidents. This digitalization, coupled with a shift toward high-efficiency electric drive mechanisms, enhances operational longevity.
  • However, the market contends with significant challenges, including the high initial capital expenditure for these complex machines and intense competition from alternative technologies like centrifugal pumps in lower-pressure applications, which forces manufacturers to continually innovate on durability and performance.

What will be the Size of the Reciprocating Plunger Pump Market during the forecast period?

Get Key Insights on Market Forecast (PDF) Get Free Sample

How is the Reciprocating Plunger Pump Market Segmented?

The reciprocating plunger pump industry research report provides comprehensive data (region-wise segment analysis), with forecasts and estimates in "USD million" for the period 2026-2030, as well as historical data from 2020-2024 for the following segments.

  • Type
    • High pressure
    • Medium pressure
    • Low pressure
  • Application
    • Oil and gas
    • Water treatment
    • Chemical processing
    • Industrial cleaning
    • Mining
  • Product
    • Triplex
    • Quintuplex
    • Duplex
    • Simplex
  • Geography
    • APAC
      • China
      • Japan
      • India
    • North America
      • US
      • Canada
      • Mexico
    • Europe
      • Germany
      • UK
      • France
    • Middle East and Africa
      • Saudi Arabia
      • UAE
      • South Africa
    • South America
      • Brazil
      • Argentina
      • Colombia
    • Rest of World (ROW)

By Type Insights

The high pressure segment is estimated to witness significant growth during the forecast period.

High-pressure systems are engineered for the most demanding industrial tasks. This segment, defined by its focus on high-pressure fluid handling, is critical for industrial surface preparation, hydrocracking process pumps, and boiler feed applications.

The triplex pump configuration is a common choice, offering a balance of power and a smooth flow profile. These systems are integral to infrastructure projects involving heavy-duty slurry pumping and even subsea pipeline testing.

The necessity for absolute reliability and safety drives the adoption of automated dosing units, which can improve process consistency by over 15%.

Investing in these systems supports a strategy of total cost of ownership reduction by enhancing productivity and minimizing mechanical failures in critical operations.

Get Free Sample

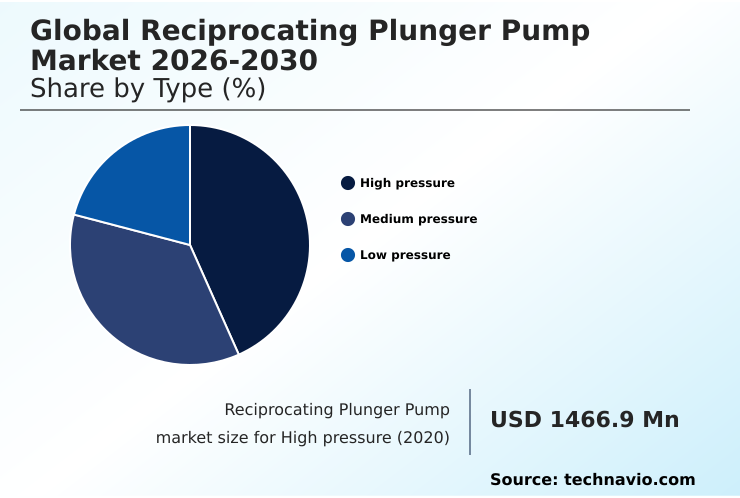
The High pressure segment was valued at USD 1.76 billion in 2024 and showed a gradual increase during the forecast period.

Get Free Sample

Regional Analysis

APAC is estimated to contribute 37.5% to the growth of the global market during the forecast period.Technavio’s analysts have elaborately explained the regional trends and drivers that shape the market during the forecast period.

See How Reciprocating Plunger Pump Market Demand is Rising in APAC Get Free Sample

The APAC region leads market growth, contributing over 37% of the market's incremental expansion. This is fueled by massive investment in mining and energy.

Key applications include mine dewatering systems and the use of the positive displacement principle for heavy-duty slurry pumping and abrasive slurry transport.

In the energy sector, offshore oil extraction and subsea pipeline testing are common, with quintuplex pump design favored for high-volume tasks. These applications require API 674 compliance and support enhanced oil recovery methods.

The construction industry also drives demand for hydro-demolition equipment. This focus on heavy industry underpins the region's strong market position.

Market Dynamics

Our researchers analyzed the data with 2025 as the base year, along with the key drivers, trends, and challenges. A holistic analysis of drivers will help companies refine their marketing strategies to gain a competitive advantage.

  • Strategic procurement decisions in this market often begin with a fundamental comparison of a reciprocating pump vs centrifugal pump, weighing the benefits of high pressure against flow volume. For industrial high pressure cleaning and specialized high pressure water jetting applications, the choice is clear. However, operational planning must account for triplex plunger pump maintenance costs, which can be significant.
  • The core advantage remains the superior positive displacement pump efficiency, a critical factor in energy-intensive processes like oil and gas well stimulation and plunger pump for hydraulic fracturing. In the chemical sector, selecting the right chemical injection pump systems and a specific plunger pump for corrosive fluids is paramount for safety and longevity.
  • Enterprises that invest in advanced systems see tangible benefits; for instance, facilities utilizing predictive maintenance for plunger pumps report that the maintenance of high pressure pumps is 25% more streamlined than those on a fixed schedule.
  • Further considerations include reciprocating pump for desalination projects, ensuring api 674 plunger pump standards are met for oilfield work, and implementing a variable frequency drive for pumps to manage energy.
  • Other key selection criteria involve quintuplex pump for oilfield services, choosing a sanitary plunger pump for food applications, making the right high pressure homogenizer pump selection, finding a robust pump selection for abrasive slurry, and integrating reciprocating pump pulsation dampening. Ultimately, a focus on reducing energy consumption in pumps underpins a successful long-term strategy.

What are the key market drivers leading to the rise in the adoption of Reciprocating Plunger Pump Industry?

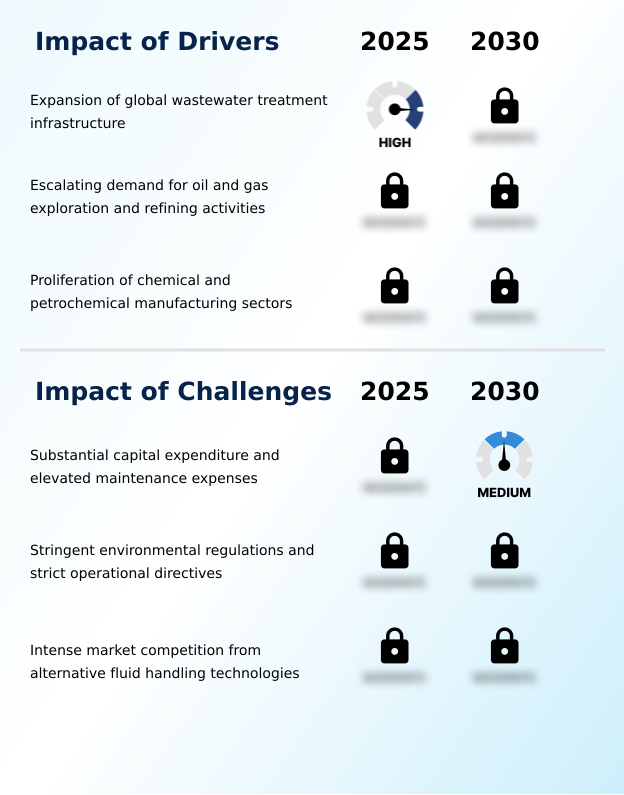
  • The expansion of global wastewater treatment infrastructure is a key driver for the market, creating sustained demand for advanced high-pressure fluid handling solutions.

  • Key market drivers stem from critical industrial needs. The expansion of pipeline transportation networks and downstream petrochemical processing facilities creates steady demand.
  • In the energy sector, the reciprocating plunger mechanism is essential for well stimulation techniques and hydraulic fracturing fluid injection, particularly for unconventional gas extraction. These methods can increase yield from mature wells by over 15%.
  • Similarly, the growth in global wastewater sludge management and desalination projects relies on the reverse osmosis process, where the chemical dosing accuracy of these pumps is vital for regulatory compliance. Systems can achieve dosing precision within a 1% tolerance.

What are the market trends shaping the Reciprocating Plunger Pump Industry?

  • The integration of Industrial Internet of Things (IIoT) capabilities is a significant market trend. This enables predictive maintenance strategies to optimize equipment performance and reduce operational downtime.

  • Market trends are driven by digitalization and efficiency. The integration of predictive maintenance sensors enables operational downtime minimization, with some facilities reporting a 20% reduction in unexpected failures. This is coupled with a shift toward energy-efficient drive mechanisms and variable frequency drives to control pump speed precisely.
  • In the food sector, high-pressure processing for non-thermal pasteurization is expanding, requiring sanitary pump design with advanced clean-in-place procedures. These pumps, often built with a forged steel fluid end for durability, can extend product shelf life by over 40% compared to traditional methods, supporting the drive for operational excellence.

What challenges does the Reciprocating Plunger Pump Industry face during its growth?

  • Substantial initial capital expenditure coupled with elevated ongoing maintenance expenses presents a key challenge affecting industry growth and broader market adoption.

  • The market faces challenges related to cost, complexity, and competition. While volumetric efficiency is a key benefit, the inherent pulsation requires expensive pulsation dampening systems. The high initial cost is influenced by the need for advanced metallurgical composition, such as corrosion-resistant alloys and high-grade stainless steel, especially for industrial cleaning solutions.
  • Ensuring fugitive emission control necessitates sophisticated designs, including hermetically sealed fluid transfer mechanisms or advanced ceramic plunger technology. Competing pump types can offer simpler maintenance, creating a scenario where the total cost can be 30% higher in applications not requiring extreme pressure.

Exclusive Technavio Analysis on Customer Landscape

The reciprocating plunger pump market forecasting report includes the adoption lifecycle of the market, covering from the innovator’s stage to the laggard’s stage. It focuses on adoption rates in different regions based on penetration. Furthermore, the reciprocating plunger pump market report also includes key purchase criteria and drivers of price sensitivity to help companies evaluate and develop their market growth analysis strategies.

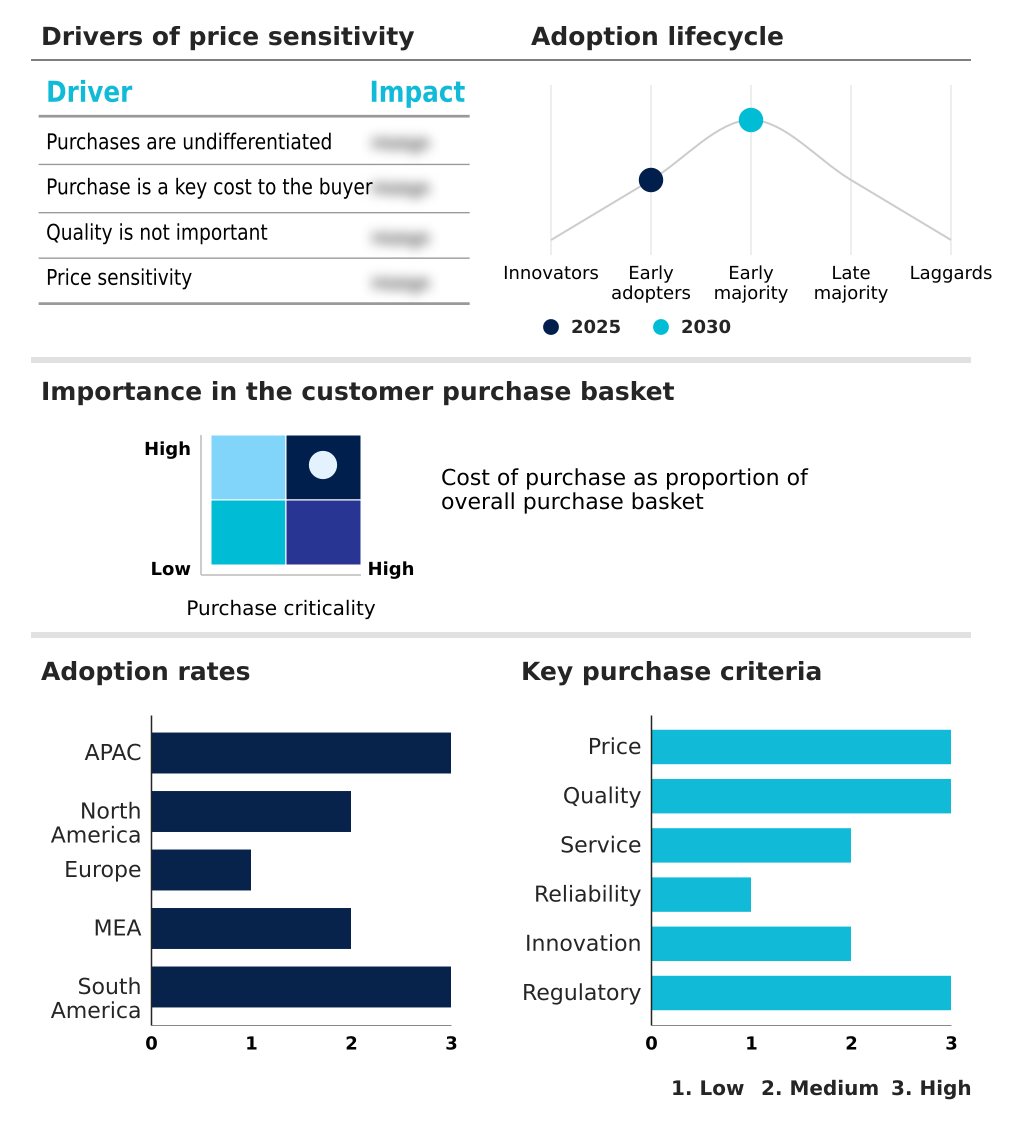
Customer Landscape of Reciprocating Plunger Pump Industry

Competitive Landscape

Companies are implementing various strategies, such as strategic alliances, reciprocating plunger pump market forecast, partnerships, mergers and acquisitions, geographical expansion, and product/service launches, to enhance their presence in the industry.

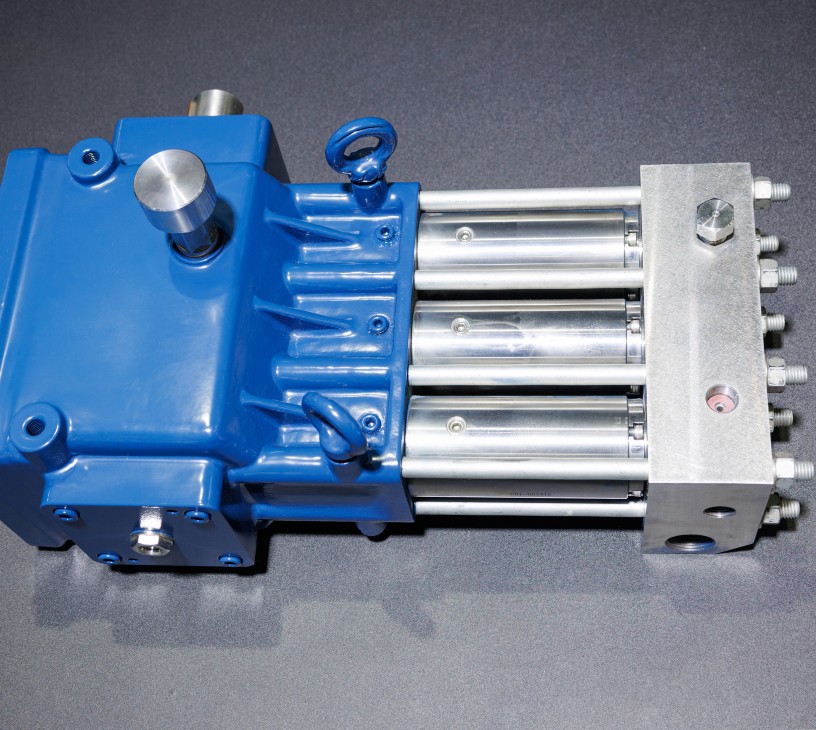
ALDRICH Pumps - Analysis points to key offerings of dependable, continuous-duty triplex plunger pumps, engineered for high-pressure washing, industrial misting, and critical fluid transfer applications.

The industry research and growth report includes detailed analyses of the competitive landscape of the market and information about key companies, including:

  • ALDRICH Pumps
  • Cat Pumps
  • Comet Spa
  • Flowserve Corp.
  • Goma Engineering Pvt. Ltd.
  • Hiro Nisha Systems Pvt. Ltd.
  • Ingersoll Rand Inc.
  • Interpump Group S.p.A.
  • KAMAT GmbH and Co. KG
  • LEWA GmbH
  • NOV Inc.
  • Pentair Plc
  • Peroni Pompe SpA
  • Ram Pumps Ltd
  • Ruhrpumpen Group
  • Sulzer Ltd.
  • TechnipFMC plc
  • URACA GmbH and Co. KG
  • Weatherford International Plc
  • WOMA GmbH

Qualitative and quantitative analysis of companies has been conducted to help clients understand the wider business environment as well as the strengths and weaknesses of key industry players. Data is qualitatively analyzed to categorize companies as pure play, category-focused, industry-focused, and diversified; it is quantitatively analyzed to categorize companies as dominant, leading, strong, tentative, and weak.

Recent Development and News in Reciprocating plunger pump market

  • In April, 2025, Danfoss Power Solutions introduced its new X1P series of open-circuit piston pumps, developed for medium-duty mobile equipment like skid steer loaders and compact excavators.
  • In November, 2024, Flowserve Corp. announced a strategic partnership with a leading IIoT platform provider to integrate predictive maintenance analytics into its high-pressure pump systems for the energy sector.
  • In January, 2025, Ingersoll Rand Inc. acquired a specialized manufacturer of ceramic plunger components, a move aimed at enhancing the durability and corrosion resistance of its pumps for the chemical processing industry.
  • In March, 2025, Sulzer Ltd. secured a major contract to supply a fleet of high-pressure reciprocating plunger pumps for a new large-scale desalination plant in the Middle East.

Dive into Technavio’s robust research methodology, blending expert interviews, extensive data synthesis, and validated models for unparalleled Reciprocating Plunger Pump Market insights. See full methodology.

Market Scope
Page number 309
Base year 2025
Historic period 2020-2024
Forecast period 2026-2030
Growth momentum & CAGR Accelerate at a CAGR of 6.1%
Market growth 2026-2030 USD 1435.1 million
Market structure Fragmented
YoY growth 2025-2026(%) 5.7%
Key countries China, Japan, India, South Korea, Australia, Indonesia, US, Canada, Mexico, Germany, UK, France, Italy, Spain, The Netherlands, Saudi Arabia, UAE, South Africa, Turkey, Israel, Brazil, Argentina and Colombia
Competitive landscape Leading Companies, Market Positioning of Companies, Competitive Strategies, and Industry Risks

Request Free Sample

Research Analyst Overview

  • The market for reciprocating plunger pumps is foundational to industries requiring precise high-pressure fluid handling. The core technology, based on the positive displacement principle, ensures high volumetric efficiency, making it essential for tasks like hydraulic fracturing fluid injection and reverse osmosis processes. A pivotal trend shaping boardroom capital allocation is the integration of predictive maintenance sensors.
  • This technology allows a shift from scheduled to condition-based servicing, with some operators reducing maintenance costs by up to 20%. The decision to invest in pumps with advanced features like variable frequency drives and corrosion-resistant alloys is no longer just an engineering choice but a strategic move toward operational resilience and sustainability.
  • Applications in downstream petrochemical processing and non-thermal pasteurization highlight the technology's versatility, from heavy-duty slurry pumping to delicate sanitary pump design.

What are the Key Data Covered in this Reciprocating Plunger Pump Market Research and Growth Report?

  • What is the expected growth of the Reciprocating Plunger Pump Market between 2026 and 2030?

    • USD 1.44 billion, at a CAGR of 6.1%

  • What segmentation does the market report cover?

    • The report is segmented by Type (High pressure, Medium pressure, and Low pressure), Application (Oil and gas, Water treatment, Chemical processing, Industrial cleaning, and Mining), Product (Triplex, Quintuplex, Duplex, and Simplex) and Geography (APAC, North America, Europe, Middle East and Africa, South America)

  • Which regions are analyzed in the report?

    • APAC, North America, Europe, Middle East and Africa and South America

  • What are the key growth drivers and market challenges?

    • Expansion of global wastewater treatment infrastructure, Substantial capital expenditure and elevated maintenance expenses

  • Who are the major players in the Reciprocating Plunger Pump Market?

    • ALDRICH Pumps, Cat Pumps, Comet Spa, Flowserve Corp., Goma Engineering Pvt. Ltd., Hiro Nisha Systems Pvt. Ltd., Ingersoll Rand Inc., Interpump Group S.p.A., KAMAT GmbH and Co. KG, LEWA GmbH, NOV Inc., Pentair Plc, Peroni Pompe SpA, Ram Pumps Ltd, Ruhrpumpen Group, Sulzer Ltd., TechnipFMC plc, URACA GmbH and Co. KG, Weatherford International Plc and WOMA GmbH

Market Research Insights

  • Market dynamics are shaped by a push for operational excellence and sustainability. The adoption of energy-efficient drive mechanisms is critical, with operators achieving an average 15% reduction in power consumption. In chemical processing, the focus on fugitive emission control and chemical dosing accuracy drives demand for pumps with advanced metallurgical composition. This ensures containment, improving safety compliance by over 95%.
  • Concurrently, sectors like food processing leverage sanitary pump design with clean-in-place procedures, which can cut cleaning cycle times by up to 30%. The core reciprocating plunger mechanism, often paired with pulsation dampening systems, remains essential for demanding applications like unconventional gas extraction and wastewater sludge management, where reliability is paramount.

We can help! Our analysts can customize this reciprocating plunger pump market research report to meet your requirements.

Get in touch

1. Executive Summary

1.1 Market overview

Executive Summary - Chart on Market Overview
Executive Summary - Data Table on Market Overview
Executive Summary - Chart on Global Market Characteristics
Executive Summary - Chart on Market by Geography
Executive Summary - Chart on Market Segmentation by Type
Executive Summary - Chart on Market Segmentation by Application
Executive Summary - Chart on Market Segmentation by Product
Executive Summary - Chart on Incremental Growth
Executive Summary - Data Table on Incremental Growth
Executive Summary - Chart on Company Market Positioning

2. Technavio Analysis

2.1 Analysis of price sensitivity, lifecycle, customer purchase basket, adoption rates, and purchase criteria

2.2 Criticality of inputs and Factors of differentiation

Chart on Overview on criticality of inputs and factors of differentiation

2.3 Factors of disruption

Chart on Overview on factors of disruption

2.4 Impact of drivers and challenges

Chart on Impact of drivers and challenges in 2025 and 2030

3. Market Landscape

3.1 Market ecosystem

Chart on Parent Market
Data Table on - Parent Market

3.2 Market characteristics

Chart on Market characteristics analysis

3.3 Value chain analysis

Chart on Value chain analysis

4. Market Sizing

4.1 Market definition

Data Table on Offerings of companies included in the market definition

4.2 Market segment analysis

Market segments

4.3 Market size 2025

4.4 Market outlook: Forecast for 2025-2030

Chart on Global - Market size and forecast 2025-2030 ($ million)
Data Table on Global - Market size and forecast 2025-2030 ($ million)
Chart on Global Market: Year-over-year growth 2025-2030 (%)
Data Table on Global Market: Year-over-year growth 2025-2030 (%)

5. Historic Market Size

5.1 Global Reciprocating Plunger Pump Market 2020 - 2024

Historic Market Size - Data Table on Global Reciprocating Plunger Pump Market 2020 - 2024 ($ million)

5.2 Type segment analysis 2020 - 2024

Historic Market Size - Type Segment 2020 - 2024 ($ million)

5.3 Application segment analysis 2020 - 2024

Historic Market Size - Application Segment 2020 - 2024 ($ million)

5.4 Product segment analysis 2020 - 2024

Historic Market Size - Product Segment 2020 - 2024 ($ million)

5.5 Geography segment analysis 2020 - 2024

Historic Market Size - Geography Segment 2020 - 2024 ($ million)

5.6 Country segment analysis 2020 - 2024

Historic Market Size - Country Segment 2020 - 2024 ($ million)

6. Qualitative Analysis

6.1 Impact of AI on Global Reciprocating Plunger Pump Market

6.2 Impact of Geopolitical Conflicts on Global Reciprocating Plunger Pump Market

7. Five Forces Analysis

7.1 Five forces summary

Five forces analysis - Comparison between 2025 and 2030

7.2 Bargaining power of buyers

Bargaining power of buyers - Impact of key factors 2025 and 2030

7.3 Bargaining power of suppliers

Bargaining power of suppliers - Impact of key factors in 2025 and 2030

7.4 Threat of new entrants

Threat of new entrants - Impact of key factors in 2025 and 2030

7.5 Threat of substitutes

Threat of substitutes - Impact of key factors in 2025 and 2030

7.6 Threat of rivalry

Threat of rivalry - Impact of key factors in 2025 and 2030

7.7 Market condition

Chart on Market condition - Five forces 2025 and 2030

8. Market Segmentation by Type

8.1 Market segments

Chart on Type - Market share 2025-2030 (%)
Data Table on Type - Market share 2025-2030 (%)

8.2 Comparison by Type

Chart on Comparison by Type
Data Table on Comparison by Type

8.3 High pressure - Market size and forecast 2025-2030

Chart on High pressure - Market size and forecast 2025-2030 ($ million)
Data Table on High pressure - Market size and forecast 2025-2030 ($ million)
Chart on High pressure - Year-over-year growth 2025-2030 (%)
Data Table on High pressure - Year-over-year growth 2025-2030 (%)

8.4 Medium pressure - Market size and forecast 2025-2030

Chart on Medium pressure - Market size and forecast 2025-2030 ($ million)
Data Table on Medium pressure - Market size and forecast 2025-2030 ($ million)
Chart on Medium pressure - Year-over-year growth 2025-2030 (%)
Data Table on Medium pressure - Year-over-year growth 2025-2030 (%)

8.5 Low pressure - Market size and forecast 2025-2030

Chart on Low pressure - Market size and forecast 2025-2030 ($ million)
Data Table on Low pressure - Market size and forecast 2025-2030 ($ million)
Chart on Low pressure - Year-over-year growth 2025-2030 (%)
Data Table on Low pressure - Year-over-year growth 2025-2030 (%)

8.6 Market opportunity by Type

Market opportunity by Type ($ million)
Data Table on Market opportunity by Type ($ million)

9. Market Segmentation by Application

9.1 Market segments

Chart on Application - Market share 2025-2030 (%)
Data Table on Application - Market share 2025-2030 (%)

9.2 Comparison by Application

Chart on Comparison by Application
Data Table on Comparison by Application

9.3 Oil and gas - Market size and forecast 2025-2030

Chart on Oil and gas - Market size and forecast 2025-2030 ($ million)
Data Table on Oil and gas - Market size and forecast 2025-2030 ($ million)
Chart on Oil and gas - Year-over-year growth 2025-2030 (%)
Data Table on Oil and gas - Year-over-year growth 2025-2030 (%)

9.4 Water treatment - Market size and forecast 2025-2030

Chart on Water treatment - Market size and forecast 2025-2030 ($ million)
Data Table on Water treatment - Market size and forecast 2025-2030 ($ million)
Chart on Water treatment - Year-over-year growth 2025-2030 (%)
Data Table on Water treatment - Year-over-year growth 2025-2030 (%)

9.5 Chemical processing - Market size and forecast 2025-2030

Chart on Chemical processing - Market size and forecast 2025-2030 ($ million)
Data Table on Chemical processing - Market size and forecast 2025-2030 ($ million)
Chart on Chemical processing - Year-over-year growth 2025-2030 (%)
Data Table on Chemical processing - Year-over-year growth 2025-2030 (%)

9.6 Industrial cleaning - Market size and forecast 2025-2030

Chart on Industrial cleaning - Market size and forecast 2025-2030 ($ million)
Data Table on Industrial cleaning - Market size and forecast 2025-2030 ($ million)
Chart on Industrial cleaning - Year-over-year growth 2025-2030 (%)
Data Table on Industrial cleaning - Year-over-year growth 2025-2030 (%)

9.7 Mining - Market size and forecast 2025-2030

Chart on Mining - Market size and forecast 2025-2030 ($ million)
Data Table on Mining - Market size and forecast 2025-2030 ($ million)
Chart on Mining - Year-over-year growth 2025-2030 (%)
Data Table on Mining - Year-over-year growth 2025-2030 (%)

9.8 Market opportunity by Application

Market opportunity by Application ($ million)
Data Table on Market opportunity by Application ($ million)

10. Market Segmentation by Product

10.1 Market segments

Chart on Product - Market share 2025-2030 (%)
Data Table on Product - Market share 2025-2030 (%)

10.2 Comparison by Product

Chart on Comparison by Product
Data Table on Comparison by Product

10.3 Triplex - Market size and forecast 2025-2030

Chart on Triplex - Market size and forecast 2025-2030 ($ million)
Data Table on Triplex - Market size and forecast 2025-2030 ($ million)
Chart on Triplex - Year-over-year growth 2025-2030 (%)
Data Table on Triplex - Year-over-year growth 2025-2030 (%)

10.4 Quintuplex - Market size and forecast 2025-2030

Chart on Quintuplex - Market size and forecast 2025-2030 ($ million)
Data Table on Quintuplex - Market size and forecast 2025-2030 ($ million)
Chart on Quintuplex - Year-over-year growth 2025-2030 (%)
Data Table on Quintuplex - Year-over-year growth 2025-2030 (%)

10.5 Duplex - Market size and forecast 2025-2030

Chart on Duplex - Market size and forecast 2025-2030 ($ million)
Data Table on Duplex - Market size and forecast 2025-2030 ($ million)
Chart on Duplex - Year-over-year growth 2025-2030 (%)
Data Table on Duplex - Year-over-year growth 2025-2030 (%)

10.6 Simplex - Market size and forecast 2025-2030

Chart on Simplex - Market size and forecast 2025-2030 ($ million)
Data Table on Simplex - Market size and forecast 2025-2030 ($ million)
Chart on Simplex - Year-over-year growth 2025-2030 (%)
Data Table on Simplex - Year-over-year growth 2025-2030 (%)

10.7 Market opportunity by Product

Market opportunity by Product ($ million)
Data Table on Market opportunity by Product ($ million)

11. Customer Landscape

11.1 Customer landscape overview

Analysis of price sensitivity, lifecycle, customer purchase basket, adoption rates, and purchase criteria

12. Geographic Landscape

12.1 Geographic segmentation

Chart on Market share by geography 2025-2030 (%)
Data Table on Market share by geography 2025-2030 (%)

12.2 Geographic comparison

Chart on Geographic comparison
Data Table on Geographic comparison

12.3 APAC - Market size and forecast 2025-2030

Chart on APAC - Market size and forecast 2025-2030 ($ million)
Data Table on APAC - Market size and forecast 2025-2030 ($ million)
Chart on APAC - Year-over-year growth 2025-2030 (%)
Data Table on APAC - Year-over-year growth 2025-2030 (%)
Chart on Regional Comparison - APAC
Data Table on Regional Comparison - APAC

12.3.1 China - Market size and forecast 2025-2030

Chart on China - Market size and forecast 2025-2030 ($ million)
Data Table on China - Market size and forecast 2025-2030 ($ million)
Chart on China - Year-over-year growth 2025-2030 (%)
Data Table on China - Year-over-year growth 2025-2030 (%)

12.3.2 Japan - Market size and forecast 2025-2030

Chart on Japan - Market size and forecast 2025-2030 ($ million)
Data Table on Japan - Market size and forecast 2025-2030 ($ million)
Chart on Japan - Year-over-year growth 2025-2030 (%)
Data Table on Japan - Year-over-year growth 2025-2030 (%)

12.3.3 India - Market size and forecast 2025-2030

Chart on India - Market size and forecast 2025-2030 ($ million)
Data Table on India - Market size and forecast 2025-2030 ($ million)
Chart on India - Year-over-year growth 2025-2030 (%)
Data Table on India - Year-over-year growth 2025-2030 (%)

12.3.4 South Korea - Market size and forecast 2025-2030

Chart on South Korea - Market size and forecast 2025-2030 ($ million)
Data Table on South Korea - Market size and forecast 2025-2030 ($ million)
Chart on South Korea - Year-over-year growth 2025-2030 (%)
Data Table on South Korea - Year-over-year growth 2025-2030 (%)

12.3.5 Australia - Market size and forecast 2025-2030

Chart on Australia - Market size and forecast 2025-2030 ($ million)
Data Table on Australia - Market size and forecast 2025-2030 ($ million)
Chart on Australia - Year-over-year growth 2025-2030 (%)
Data Table on Australia - Year-over-year growth 2025-2030 (%)

12.3.6 Indonesia - Market size and forecast 2025-2030

Chart on Indonesia - Market size and forecast 2025-2030 ($ million)
Data Table on Indonesia - Market size and forecast 2025-2030 ($ million)
Chart on Indonesia - Year-over-year growth 2025-2030 (%)
Data Table on Indonesia - Year-over-year growth 2025-2030 (%)

12.4 North America - Market size and forecast 2025-2030

Chart on North America - Market size and forecast 2025-2030 ($ million)
Data Table on North America - Market size and forecast 2025-2030 ($ million)
Chart on North America - Year-over-year growth 2025-2030 (%)
Data Table on North America - Year-over-year growth 2025-2030 (%)
Chart on Regional Comparison - North America
Data Table on Regional Comparison - North America

12.4.1 US - Market size and forecast 2025-2030

Chart on US - Market size and forecast 2025-2030 ($ million)
Data Table on US - Market size and forecast 2025-2030 ($ million)
Chart on US - Year-over-year growth 2025-2030 (%)
Data Table on US - Year-over-year growth 2025-2030 (%)

12.4.2 Canada - Market size and forecast 2025-2030

Chart on Canada - Market size and forecast 2025-2030 ($ million)
Data Table on Canada - Market size and forecast 2025-2030 ($ million)
Chart on Canada - Year-over-year growth 2025-2030 (%)
Data Table on Canada - Year-over-year growth 2025-2030 (%)

12.4.3 Mexico - Market size and forecast 2025-2030

Chart on Mexico - Market size and forecast 2025-2030 ($ million)
Data Table on Mexico - Market size and forecast 2025-2030 ($ million)
Chart on Mexico - Year-over-year growth 2025-2030 (%)
Data Table on Mexico - Year-over-year growth 2025-2030 (%)

12.5 Europe - Market size and forecast 2025-2030

Chart on Europe - Market size and forecast 2025-2030 ($ million)
Data Table on Europe - Market size and forecast 2025-2030 ($ million)
Chart on Europe - Year-over-year growth 2025-2030 (%)
Data Table on Europe - Year-over-year growth 2025-2030 (%)
Chart on Regional Comparison - Europe
Data Table on Regional Comparison - Europe

12.5.1 Germany - Market size and forecast 2025-2030

Chart on Germany - Market size and forecast 2025-2030 ($ million)
Data Table on Germany - Market size and forecast 2025-2030 ($ million)
Chart on Germany - Year-over-year growth 2025-2030 (%)
Data Table on Germany - Year-over-year growth 2025-2030 (%)

12.5.2 UK - Market size and forecast 2025-2030

Chart on UK - Market size and forecast 2025-2030 ($ million)
Data Table on UK - Market size and forecast 2025-2030 ($ million)
Chart on UK - Year-over-year growth 2025-2030 (%)
Data Table on UK - Year-over-year growth 2025-2030 (%)

12.5.3 France - Market size and forecast 2025-2030

Chart on France - Market size and forecast 2025-2030 ($ million)
Data Table on France - Market size and forecast 2025-2030 ($ million)
Chart on France - Year-over-year growth 2025-2030 (%)
Data Table on France - Year-over-year growth 2025-2030 (%)

12.5.4 Italy - Market size and forecast 2025-2030

Chart on Italy - Market size and forecast 2025-2030 ($ million)
Data Table on Italy - Market size and forecast 2025-2030 ($ million)
Chart on Italy - Year-over-year growth 2025-2030 (%)
Data Table on Italy - Year-over-year growth 2025-2030 (%)

12.5.5 Spain - Market size and forecast 2025-2030

Chart on Spain - Market size and forecast 2025-2030 ($ million)
Data Table on Spain - Market size and forecast 2025-2030 ($ million)
Chart on Spain - Year-over-year growth 2025-2030 (%)
Data Table on Spain - Year-over-year growth 2025-2030 (%)

12.5.6 The Netherlands - Market size and forecast 2025-2030

Chart on The Netherlands - Market size and forecast 2025-2030 ($ million)
Data Table on The Netherlands - Market size and forecast 2025-2030 ($ million)
Chart on The Netherlands - Year-over-year growth 2025-2030 (%)
Data Table on The Netherlands - Year-over-year growth 2025-2030 (%)

12.6 Middle East and Africa - Market size and forecast 2025-2030

Chart on Middle East and Africa - Market size and forecast 2025-2030 ($ million)
Data Table on Middle East and Africa - Market size and forecast 2025-2030 ($ million)
Chart on Middle East and Africa - Year-over-year growth 2025-2030 (%)
Data Table on Middle East and Africa - Year-over-year growth 2025-2030 (%)
Chart on Regional Comparison - Middle East and Africa
Data Table on Regional Comparison - Middle East and Africa

12.6.1 Saudi Arabia - Market size and forecast 2025-2030

Chart on Saudi Arabia - Market size and forecast 2025-2030 ($ million)
Data Table on Saudi Arabia - Market size and forecast 2025-2030 ($ million)
Chart on Saudi Arabia - Year-over-year growth 2025-2030 (%)
Data Table on Saudi Arabia - Year-over-year growth 2025-2030 (%)

12.6.2 UAE - Market size and forecast 2025-2030

Chart on UAE - Market size and forecast 2025-2030 ($ million)
Data Table on UAE - Market size and forecast 2025-2030 ($ million)
Chart on UAE - Year-over-year growth 2025-2030 (%)
Data Table on UAE - Year-over-year growth 2025-2030 (%)

12.6.3 South Africa - Market size and forecast 2025-2030

Chart on South Africa - Market size and forecast 2025-2030 ($ million)
Data Table on South Africa - Market size and forecast 2025-2030 ($ million)
Chart on South Africa - Year-over-year growth 2025-2030 (%)
Data Table on South Africa - Year-over-year growth 2025-2030 (%)

12.6.4 Turkey - Market size and forecast 2025-2030

Chart on Turkey - Market size and forecast 2025-2030 ($ million)
Data Table on Turkey - Market size and forecast 2025-2030 ($ million)
Chart on Turkey - Year-over-year growth 2025-2030 (%)
Data Table on Turkey - Year-over-year growth 2025-2030 (%)

12.6.5 Israel - Market size and forecast 2025-2030

Chart on Israel - Market size and forecast 2025-2030 ($ million)
Data Table on Israel - Market size and forecast 2025-2030 ($ million)
Chart on Israel - Year-over-year growth 2025-2030 (%)
Data Table on Israel - Year-over-year growth 2025-2030 (%)

12.7 South America - Market size and forecast 2025-2030

Chart on South America - Market size and forecast 2025-2030 ($ million)
Data Table on South America - Market size and forecast 2025-2030 ($ million)
Chart on South America - Year-over-year growth 2025-2030 (%)
Data Table on South America - Year-over-year growth 2025-2030 (%)
Chart on Regional Comparison - South America
Data Table on Regional Comparison - South America

12.7.1 Brazil - Market size and forecast 2025-2030

Chart on Brazil - Market size and forecast 2025-2030 ($ million)
Data Table on Brazil - Market size and forecast 2025-2030 ($ million)
Chart on Brazil - Year-over-year growth 2025-2030 (%)
Data Table on Brazil - Year-over-year growth 2025-2030 (%)

12.7.2 Argentina - Market size and forecast 2025-2030

Chart on Argentina - Market size and forecast 2025-2030 ($ million)
Data Table on Argentina - Market size and forecast 2025-2030 ($ million)
Chart on Argentina - Year-over-year growth 2025-2030 (%)
Data Table on Argentina - Year-over-year growth 2025-2030 (%)

12.7.3 Colombia - Market size and forecast 2025-2030

Chart on Colombia - Market size and forecast 2025-2030 ($ million)
Data Table on Colombia - Market size and forecast 2025-2030 ($ million)
Chart on Colombia - Year-over-year growth 2025-2030 (%)
Data Table on Colombia - Year-over-year growth 2025-2030 (%)

12.8 Market opportunity by geography

Market opportunity by geography ($ million)
Data Tables on Market opportunity by geography ($ million)

13. Drivers, Challenges, and Opportunity

13.1 Market drivers

Expansion of global wastewater treatment infrastructure
Escalating demand for oil and gas exploration and refining activities
Proliferation of chemical and petrochemical manufacturing sectors

13.2 Market challenges

Substantial capital expenditure and elevated maintenance expenses
Stringent environmental regulations and strict operational directives
Intense market competition from alternative fluid handling technologies

13.3 Impact of drivers and challenges

Impact of drivers and challenges in 2025 and 2030

13.4 Market opportunities

Integration of Industrial Internet of Things (IIoT) and predictive maintenance
Adoption in high-pressure food and beverage processing
Electrification and shift toward high-efficiency drive mechanisms

14. Competitive Landscape

14.1 Overview

14.2

Overview on criticality of inputs and factors of differentiation

14.3 Landscape disruption

Overview on factors of disruption

14.4 Industry risks

Impact of key risks on business

15. Competitive Analysis

15.1 Companies profiled

Companies covered

15.2 Company ranking index

15.3 Market positioning of companies

Matrix on companies position and classification

15.4 Cat Pumps

Cat Pumps - Overview
Cat Pumps - Product / Service
Cat Pumps - Key offerings
SWOT

15.5 Comet Spa

Comet Spa - Overview
Comet Spa - Product / Service
Comet Spa - Key offerings
SWOT

15.6 Flowserve Corp.

Flowserve Corp. - Overview
Flowserve Corp. - Business segments
Flowserve Corp. - Key offerings
Flowserve Corp. - Segment focus
SWOT

15.7 Goma Engineering Pvt. Ltd.

Goma Engineering Pvt. Ltd. - Overview
Goma Engineering Pvt. Ltd. - Product / Service
Goma Engineering Pvt. Ltd. - Key offerings
SWOT

15.8 Ingersoll Rand Inc.

Ingersoll Rand Inc. - Overview
Ingersoll Rand Inc. - Business segments
Ingersoll Rand Inc. - Key offerings
Ingersoll Rand Inc. - Segment focus
SWOT

15.9 Interpump Group S.p.A.

Interpump Group S.p.A. - Overview
Interpump Group S.p.A. - Product / Service
Interpump Group S.p.A. - Key offerings
SWOT

15.10 KAMAT GmbH and Co. KG

KAMAT GmbH and Co. KG - Overview
KAMAT GmbH and Co. KG - Product / Service
KAMAT GmbH and Co. KG - Key offerings
SWOT

15.11 NOV Inc.

NOV Inc. - Overview
NOV Inc. - Business segments
NOV Inc. - Key offerings
NOV Inc. - Segment focus
SWOT

15.12 Pentair Plc

Pentair Plc - Overview
Pentair Plc - Business segments
Pentair Plc - Key offerings
Pentair Plc - Segment focus
SWOT

15.13 Ruhrpumpen Group

Ruhrpumpen Group - Overview
Ruhrpumpen Group - Product / Service
Ruhrpumpen Group - Key offerings
SWOT

15.14 Sulzer Ltd.

Sulzer Ltd. - Overview
Sulzer Ltd. - Business segments
Sulzer Ltd. - Key offerings
Sulzer Ltd. - Segment focus
SWOT

15.15 TechnipFMC plc

TechnipFMC plc - Overview
TechnipFMC plc - Business segments
TechnipFMC plc - Key offerings
TechnipFMC plc - Segment focus
SWOT

15.16 URACA GmbH and Co. KG

URACA GmbH and Co. KG - Overview
URACA GmbH and Co. KG - Product / Service
URACA GmbH and Co. KG - Key offerings
SWOT

15.17 Weatherford International Plc

Weatherford International Plc - Overview
Weatherford International Plc - Business segments
Weatherford International Plc - Key offerings
Weatherford International Plc - Segment focus
SWOT

15.18 WOMA GmbH

WOMA GmbH - Overview
WOMA GmbH - Product / Service
WOMA GmbH - Key offerings
SWOT

16. Appendix

16.1 Scope of the report

Market definition
Objectives
Notes and caveats

16.2 Inclusions and exclusions checklist

Inclusions checklist
Exclusions checklist

16.3 Currency conversion rates for US$

16.4 Research methodology

16.5 Data procurement

Information sources

16.6 Data validation

16.7 Validation techniques employed for market sizing

16.8 Data synthesis

16.9 360 degree market analysis

16.10 List of abbreviations

Research Methodology

Technavio presents a detailed picture of the market by way of study, synthesis, and summation of data from multiple sources. The analysts have presented the various facets of the market with a particular focus on identifying the key industry influencers. The data thus presented is comprehensive, reliable, and the result of extensive research, both primary and secondary.

INFORMATION SOURCES

Primary sources

  • Manufacturers and suppliers
  • Channel partners
  • Industry experts
  • Strategic decision makers

Secondary sources

  • Industry journals and periodicals
  • Government data
  • Financial reports of key industry players
  • Historical data
  • Press releases

DATA ANALYSIS

Data Synthesis

  • Collation of data
  • Estimation of key figures
  • Analysis of derived insights

Data Validation

  • Triangulation with data models
  • Reference against proprietary databases
  • Corroboration with industry experts

REPORT WRITING

Qualitative

  • Market drivers
  • Market challenges
  • Market trends
  • Five forces analysis

Quantitative

  • Market size and forecast
  • Market segmentation
  • Geographical insights
  • Competitive landscape

Interested in this report?

Get your sample now to see our research methodology and insights!

Download Now

Frequently Asked Questions

Reciprocating Plunger Pump market growth will increase by USD 1435.1 million during 2026-2030.

The Reciprocating Plunger Pump market is expected to grow at a CAGR of 6.1% during 2026-2030.

Reciprocating Plunger Pump market is segmented by Type (High pressure, Medium pressure, Low pressure) Application (Oil and gas, Water treatment, Chemical processing, Industrial cleaning, Mining) Product (Triplex, Quintuplex, Duplex, Simplex)

ALDRICH Pumps, Cat Pumps, Comet Spa, Flowserve Corp., Goma Engineering Pvt. Ltd., Hiro Nisha Systems Pvt. Ltd., Ingersoll Rand Inc., Interpump Group S.p.A., KAMAT GmbH and Co. KG, LEWA GmbH, NOV Inc., Pentair Plc, Peroni Pompe SpA, Ram Pumps Ltd, Ruhrpumpen Group, Sulzer Ltd., TechnipFMC plc, URACA GmbH and Co. KG, Weatherford International Plc, WOMA GmbH are a few of the key vendors in the Reciprocating Plunger Pump market.

APAC will register the highest growth rate of 37.5% among the other regions. Therefore, the Reciprocating Plunger Pump market in APAC is expected to garner significant business opportunities for the vendors during the forecast period.

China, Japan, India, South Korea, Australia, Indonesia, US, Canada, Mexico, Germany, UK, France, Italy, Spain, The Netherlands, Saudi Arabia, UAE, South Africa, Turkey, Israel, Brazil, Argentina, Colombia

  • Expansion of global wastewater treatment infrastructure is the driving factor this market.

The Reciprocating Plunger Pump market vendors should focus on grabbing business opportunities from the Type segment as it accounted for the largest market share in the base year.
RIA - Research AI Assistant
Ask RIA