
Renewable Energy Investment Market Size 2024-2028
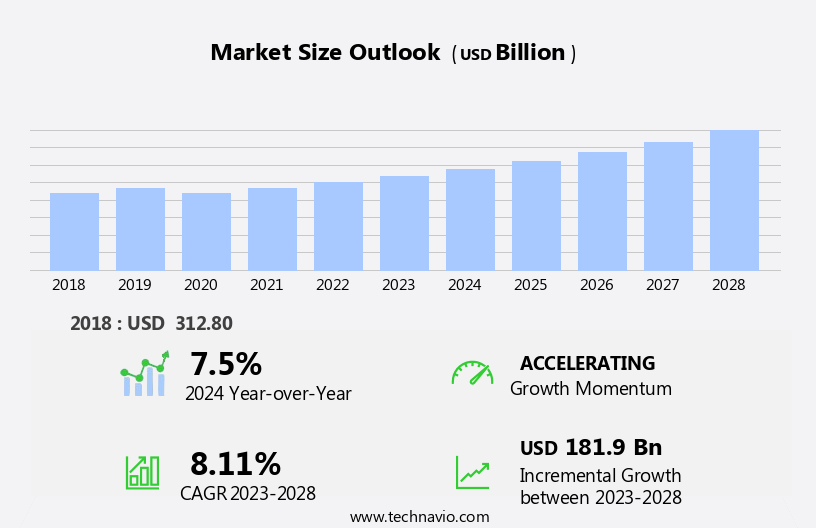
The renewable energy investment market size is forecast to increase by USD 181.9 billion at a CAGR of 8.11% between 2023 and 2028.
- The market is experiencing significant growth, driven by supportive government policies and increased spending on utility-scale projects. According to the latest market analysis, the global renewable energy sector is anticipated to witness substantial investments due to the increasing focus on reducing carbon emissions and transitioning away from fossil fuels. Governments worldwide are implementing policies and incentives to promote renewable energy adoption, creating a favorable business environment for investors. Moreover, the trend towards large-scale renewable energy projects is gaining momentum, with utility-scale solar and wind farms attracting substantial investments. However, the market is not without challenges. Competition from traditional energy sources, particularly fossil fuels, remains a significant barrier to growth.
- The volatility of renewable energy sources and the intermittency of solar and wind power generation are also concerns for investors. To capitalize on market opportunities and navigate challenges effectively, companies must stay informed about regulatory developments, technological advancements, and market trends. Strategic partnerships, innovation, and operational efficiency will be key differentiators for success in the market.
What will be the Size of the Renewable Energy Investment Market during the forecast period?
- The market in the US is experiencing growth, driven by the increasing deployment of solar technology and offshore wind for electricity generation. Utility-scale solar projects are leading the charge, with capacity additions expected to continue due to grid resilience and energy affordability concerns. Federal investments and energy security considerations are also significant growth factors, as the US seeks to reduce greenhouse gas emissions in line with the Paris Agreement and various clean energy laws. Policy developments, such as renewable portfolio standards and tax-credit transfer markets, are further fueling the market's expansion. The manufacturing sector is also playing a crucial role, with advancements in solar, wind, and biofuels technology driving innovation and efficiency.
- The renewable energy sector's growth is not limited to the US, as the EU and other regions are also making substantial investments in renewable energy. The IEA assessment indicates that renewable energy will continue to dominate new electricity capacity additions, with biofuels and generative artificial intelligence also playing a role in the energy transition. The energy crisis and decarbonization targets are further emphasizing the importance of renewable energy in the power system integration. The UN Climate Change Conference's Energy Transitions Stocktake and the Paris Agreement's policy developments are also influencing the market's direction. Overall, the renewable energy market is a dynamic and growing sector, with significant potential for continued expansion.
How is this Renewable Energy Investment Industry segmented?
The renewable energy investment industry research report provides comprehensive data (region-wise segment analysis), with forecasts and estimates in "USD billion" for the period 2024-2028, as well as historical data from 2018-2022 for the following segments.
- Type
- Asset finance
- Small distributed capacity
- Geography
- APAC
- China
- Japan
- North America
- US
- Europe
- Germany
- South America
- Brazil
- Middle East and Africa
- APAC
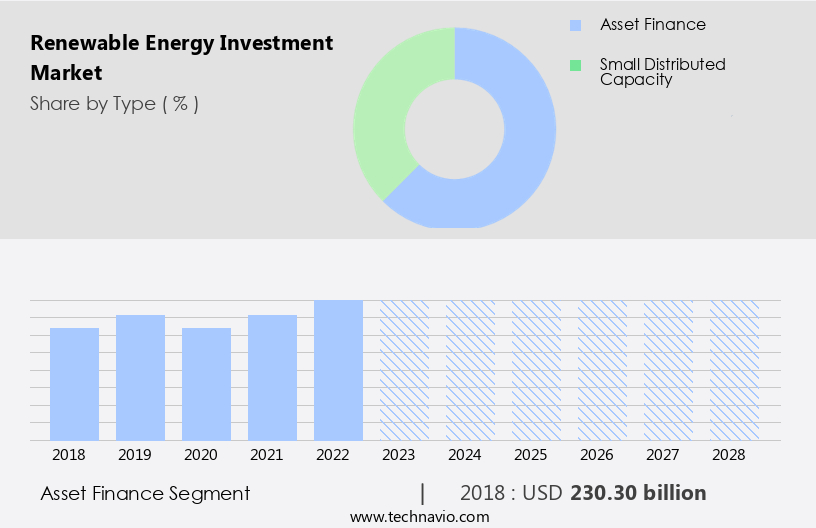
By Type Insights
The asset finance segment is estimated to witness significant growth during the forecast period.
The market is experiencing significant growth as businesses seek energy affordability and decarbonization solutions amidst increasing energy crisis and regulatory boosts. companies offering financial services for renewable power projects, such as the Clean Energy Finance Corporation, are playing a crucial role in this expansion. These entities provide investments for small-scale clean energy projects, enabling businesses, manufacturers, commercial property owners, and farmers to transition to a low-emission future. However, investments in solar thermal projects, including concentrated solar power (CSP) and solar heating systems, have declined, with offshore wind now holding the third-largest share of investments at 7%.
Hydroelectric power accounts for 4%, while other renewables account for 3%. Policy developments, such as renewable portfolio standards and clean energy laws, are driving the demand for fossil fuel alternatives, particularly wind technology and solar PV. Infrastructure investment in distributed systems, grid resilience, and power system integration is also essential for the competitiveness of renewable energy. Despite challenges, such as labor costs, transmission limitations, and permitting delays, the market is experiencing a rebound due to rising interest rates and carbon reduction targets. The growth of offshore wind, solar PV capacity, and biofuels is expected to continue, with utility-scale systems and commercial systems also seeing capacity additions.
Get a glance at the market report of share of various segments Request Free Sample
The Asset finance segment was valued at USD 230.30 billion in 2018 and showed a gradual increase during the forecast period.
Regional Analysis
APAC is estimated to contribute 67% to the growth of the global market during the forecast period.Technavio’s analysts have elaborately explained the regional trends and drivers that shape the market during the forecast period.

For more insights on the market size of various regions, Request Free Sample
The market is experiencing significant growth due to the global energy crisis and the increasing importance of energy affordability. Policy developments, such as renewable portfolio standards and clean energy laws, are providing regulatory boosts for the deployment of renewable technologies like wind and solar. Hydrogen deployment and distributed systems are also gaining traction as fossil fuel alternatives. In APAC, the integration of renewable grids with smart grid technology is on the rise, reducing greenhouse gas emissions and improving energy security. The need for energy storage systems to provide backup during intermittency or power outages is increasing alongside the growth of renewable energy production.
Challenges in the renewable energy sector include labor costs, transmission limitations, and permitting and interconnection delays. However, federal investments, tax-credit transfer markets, and the rebound of renewable energy projects are helping to mitigate these challenges. The competitiveness of renewable energy is also being driven by decreasing capital costs and advancements in power system integration. Offshore wind growth, solar PV capacity additions, and the expansion of onshore wind capacity are all contributing to the sector's expansion. Biofuel demand and utility-scale solar and wind projects are also key drivers of the market. Workforce reskilling and grid resilience are essential considerations for the industry's future, as is the integration of generative artificial intelligence and other advanced technologies.
Despite rising interest rates and decarbonization targets, the market for renewable energy is expected to continue its growth trajectory, with capacity additions and new projects planned in various stages of development.
Market Dynamics
Our researchers analyzed the data with 2023 as the base year, along with the key drivers, trends, and challenges. A holistic analysis of drivers will help companies refine their marketing strategies to gain a competitive advantage.
What are the key market drivers leading to the rise in the adoption of Renewable Energy Investment Industry?
- Supportive government policies is the key driver of the market.
- Renewable energy sources have gained significant importance in the global energy landscape due to their potential to reduce greenhouse gas (GHG) emissions. Governments worldwide are encouraging the adoption of renewable energy through incentives, subsidies, and tax benefits. One such initiative is the Investment Tax Credit (ITC) in Canada, which provides a financial incentive to power producers and consumers for installing renewable energy systems. The new legislation, passed in December 2020, offers a 26% tax credit for renewable energy installations established between 2020 and 2022 and a 22% credit for installations in 2023.
- This policy supports the growth of the renewable energy market in Canada by making it financially attractive for businesses and individuals to invest in wind, solar, and tidal energy.
What are the market trends shaping the Renewable Energy Investment Industry?
- Increased spending on utility-scale renewable energy projects is the upcoming market trend.
- Utility-scale renewable energy projects, defined as those with a capacity exceeding 10 MW, are significantly influenced by policies and initiatives at the state and local levels worldwide. These measures aim to facilitate the implementation of renewable energy projects by addressing potential barriers through financial incentives such as tax breaks and clean energy targets. However, determining the cost-effectiveness and efficiency of renewable energy versus traditional electricity generation sources can be challenging for stakeholders. This decision-making process involves policyholders, regulatory bodies, and investors, necessitating a thorough analysis of the cost structures of various energy generation methods.
- Despite the complexity of this assessment, the global trend towards renewable energy continues to gain momentum, driven by the increasing competitiveness of renewable energy technologies and the growing recognition of their environmental benefits.
What challenges does the Renewable Energy Investment Industry face during its growth?
- Competition from fossil fuels is a key challenge affecting the industry growth.
- Renewable energy has witnessed significant growth in global electricity consumption, yet fossil fuels remain preferred in many countries due to their abundant availability and lower costs for electricity generation. Establishing renewable energy facilities comes with a high initial investment, and the power output from renewable sources is intermittent, leading to increased costs. For instance, solar Photovoltaic (PV) installations require substantial capital expenditure, despite a decline in material costs over the past decade. The extensive area coverage needed to generate a substantial electricity volume further contributes to the investment and cost increase.
- Despite these challenges, the renewable energy sector continues to attract investments due to its long-term benefits, including reduced carbon emissions and energy security. The intermittency issue is being addressed through advancements in energy storage technologies, making renewables a more reliable and competitive option for electricity generation.
Exclusive Customer Landscape
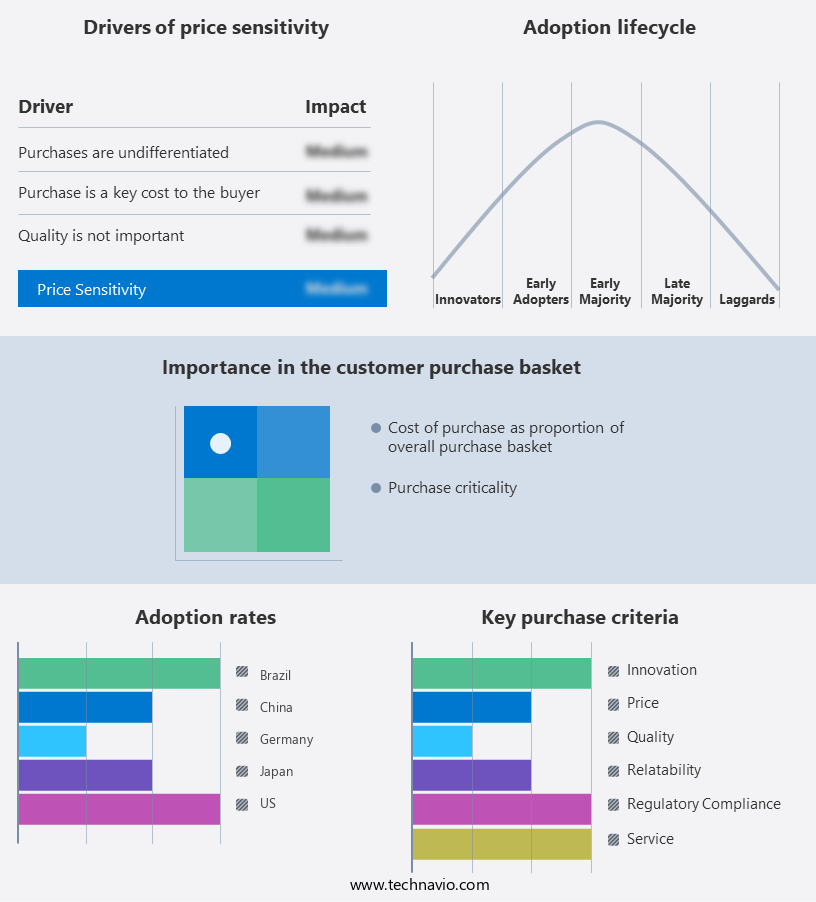
The renewable energy investment market forecasting report includes the adoption lifecycle of the market, covering from the innovator’s stage to the laggard’s stage. It focuses on adoption rates in different regions based on penetration. Furthermore, the renewable energy investment market report also includes key purchase criteria and drivers of price sensitivity to help companies evaluate and develop their market growth analysis strategies.
Customer Landscape
Key Companies & Market Insights
Companies are implementing various strategies, such as strategic alliances, renewable energy investment market forecast, partnerships, mergers and acquisitions, geographical expansion, and product/service launches, to enhance their presence in the industry.
AZORA CAPITAL SL - The company specializes in providing comprehensive solutions for renewable energy and energy efficiency, leveraging advanced technologies to optimize energy usage and reduce carbon footprint. Our offerings span various sectors, ensuring clients' unique energy needs are met with innovative and sustainable approaches. By focusing on efficiency and sustainability, we contribute to a more sustainable future for businesses and communities worldwide.
The industry research and growth report includes detailed analyses of the competitive landscape of the market and information about key companies, including:
- AZORA CAPITAL SL
- Bank of America Corp.
- Berkeley Partners LLP
- BlackRock Inc.
- BNP Paribas SA
- Capital Dynamics Holding AG
- Centerbridge Partners LP
- CHN ENERGY Investment Group Co. Ltd.
- Citigroup Inc.
- Deloitte Touche Tohmatsu Ltd.
- EKF
- ESFC Investment Group
- General Electric Co.
- KfW Bankengruppe
- Macquarie Group Ltd.
- Mitsubishi UFJ Financial Group Inc.
- Nebras Power
- Positive Energy Ltd.
- State Power Investment Corp.
- TerraForm Power Operating LLC
- The Group Inc.
Qualitative and quantitative analysis of companies has been conducted to help clients understand the wider business environment as well as the strengths and weaknesses of key industry players. Data is qualitatively analyzed to categorize companies as pure play, category-focused, industry-focused, and diversified; it is quantitatively analyzed to categorize companies as dominant, leading, strong, tentative, and weak.
Research Analyst Overview
Renewable energy investment continues to be a significant area of focus for businesses and governments worldwide as the world grapples with the challenges of energy affordability and the need to reduce greenhouse gas emissions. The renewable energy sector has seen considerable growth in recent years, driven by various market dynamics. One of the primary drivers of renewable energy investment is the increasing recognition of the importance of energy security and the need to diversify energy sources beyond fossil fuels. This trend is particularly evident in Europe, where there has been a push to deploy more renewable energy and reduce reliance on imported fossil fuels.
Hydrogen deployment is another area of renewed interest, with many countries and companies exploring its potential as a clean fuel for transportation and industrial processes. Policy developments have played a crucial role in this, with regulatory boosts and renewable portfolio standards driving investment in renewable hydrogen production. Wind technology continues to be a major focus of renewable energy investment, with both onshore and offshore wind seeing significant capacity additions. However, challenges remain, including permitting delays, transmission limitations, and interconnection delays, which can impact the competitiveness of wind energy. Solar technology, particularly solar photovoltaic (PV), has also seen significant growth in recent years.
The falling cost of solar PV has made it increasingly competitive with fossil fuels, making it an attractive option for both utility-scale and residential systems. However, there are challenges to be addressed, such as workforce reskilling, power system integration, and capacity additions. The infrastructure investment required for renewable energy deployment is significant, with large-scale projects requiring substantial capital costs. This has led to the emergence of the tax-credit transfer market, where companies can buy and sell tax credits associated with renewable energy projects. Despite the progress made in renewable energy deployment, there are still challenges to be addressed. These include rising interest rates, which can impact the competitiveness of renewable energy, and decarbonization targets that require significant reductions in greenhouse gas emissions.
Furthermore, there are ongoing discussions around the role of biofuels in the renewable energy mix, with some arguing that they are essential for achieving energy affordability and reducing emissions in the transportation sector. However, there are also concerns around the sustainability of biofuel production and the potential impact on food prices. In , the market is a dynamic and complex landscape, driven by various market dynamics, policy developments, and technological advancements. The challenges and opportunities in this sector are significant, requiring ongoing investment and innovation to address the energy crisis, reduce greenhouse gas emissions, and ensure energy affordability for all.
|
Market Scope |
|
|
Report Coverage |
Details |
|
Page number |
153 |
|
Base year |
2023 |
|
Historic period |
2018-2022 |
|
Forecast period |
2024-2028 |
|
Growth momentum & CAGR |
Accelerate at a CAGR of 8.11% |
|
Market growth 2024-2028 |
USD 181.9 billion |
|
Market structure |
Fragmented |
|
YoY growth 2023-2024(%) |
7.5 |
|
Key countries |
China, US, Japan, Germany, and Brazil |
|
Competitive landscape |
Leading Companies, Market Positioning of Companies, Competitive Strategies, and Industry Risks |
What are the Key Data Covered in this Renewable Energy Investment Market Research and Growth Report?
- CAGR of the Renewable Energy Investment industry during the forecast period
- Detailed information on factors that will drive the growth and forecasting between 2024 and 2028
- Precise estimation of the size of the market and its contribution of the industry in focus to the parent market
- Accurate predictions about upcoming growth and trends and changes in consumer behaviour
- Growth of the market across APAC, North America, Europe, South America, and Middle East and Africa
- Thorough analysis of the market’s competitive landscape and detailed information about companies
- Comprehensive analysis of factors that will challenge the renewable energy investment market growth of industry companies
We can help! Our analysts can customize this renewable energy investment market research report to meet your requirements.
 RIA -
RIA - 
