Residential Digital Faucets Market Analysis North America, Europe, APAC, South America, Middle East and Africa - US, China, UK, Japan, Canada - Size and Forecast 2024-2028

Residential Digital Faucets Market Analysis North America, Europe, APAC, South America, Middle East and Africa - US, China, UK, Japan, Canada - Size and Forecast 2024-2028

Published: May 2024 166 Pages SKU: IRTNTR44925

Market Overview at a Glance

$2.41 B
Market Opportunity
6.92%
CAGR
6.35
YoY growth 2023-2024(%)

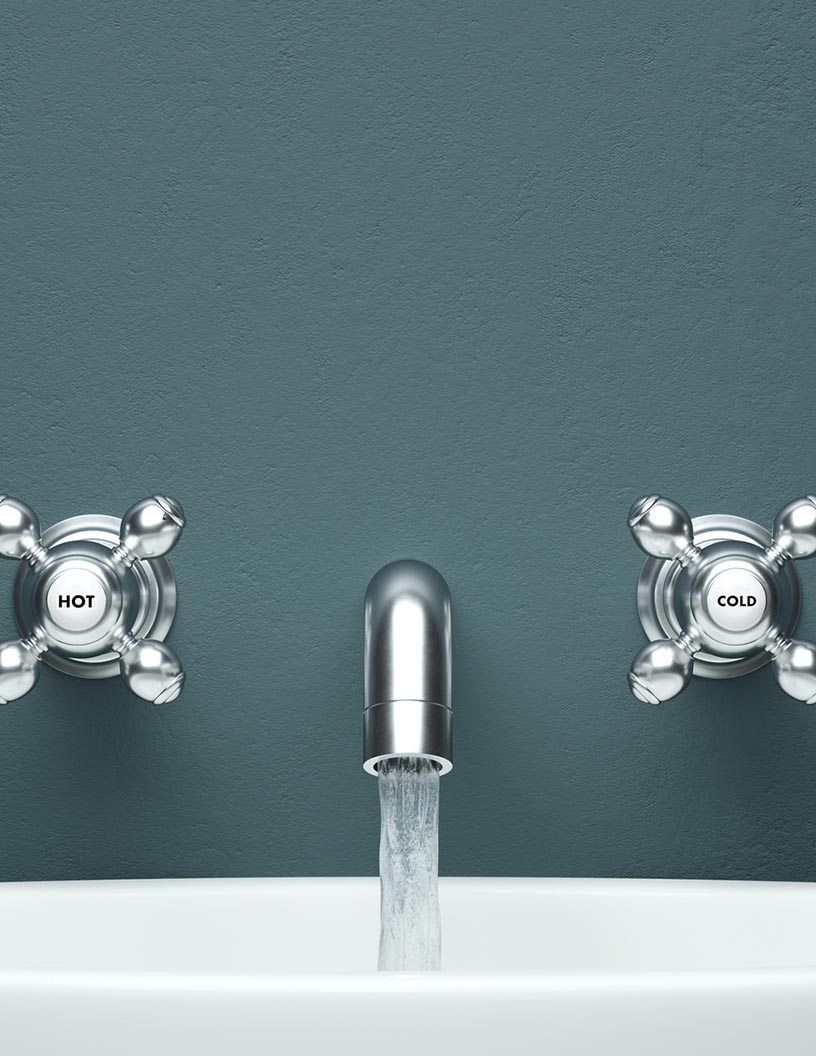
Residential Digital Faucets Market Size Report 2024-2028

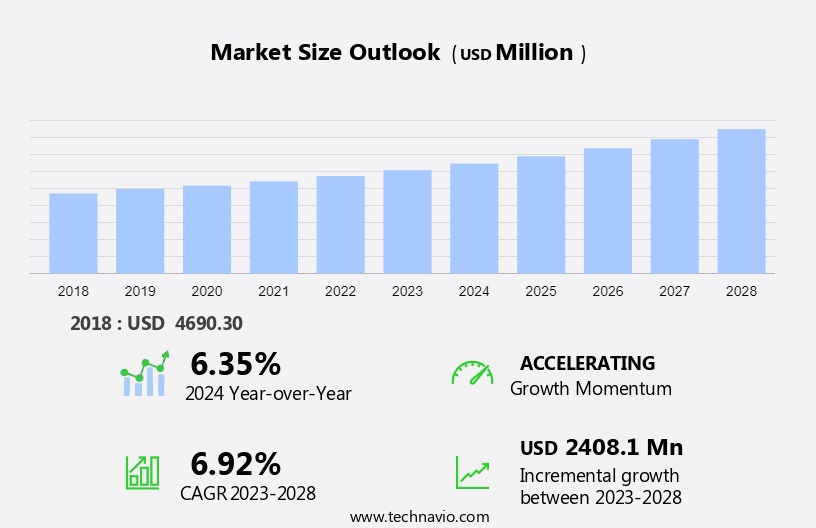
The residential digital faucets market size is forecast to increase by USD 2.40 billion at a CAGR of 6.92% between 2023 and 2028. The market is experiencing significant growth due to several key factors. Firstly, the increasing consumer expenditure on bathroom and kitchen remodeling projects is driving demand for advanced and technologically innovative faucets. Secondly, the flourishing residential construction industry is providing new opportunities for market expansion. Lastly, technological advancements in digital faucets, such as touchless controls, temperature regulation, and energy efficiency, are making these products increasingly desirable for homeowners. As a result, the market for residential digital faucets is poised for continued growth in the coming years. Our report examines historical data from 2018 - 2022, besides analyzing the current and forecasted market scenario.

The market in the region is experiencing significant growth due to escalating consumer expenditures on bathroom and kitchen remodeling and renovation projects. Innovative offerings from digital faucet manufacturers are further fueling this trend, as consumers are increasingly drawn to these advanced products. These faucets, equipped with features such as touchless control, temperature regulation, and energy efficiency, add value and convenience to homeowners' daily lives. As a result, the market for residential digital faucets is poised for continued expansion in the region.

What will the Residential Digital Faucets Market Size be during the Forecast Period?

Residential Digital Faucets Market Size

Market Forecast 2023-2027

To learn more about this report,  Request Residential Digital Faucets Market Analysis Report Free Sample

Residential Digital Faucets Market Dynamics

This market report predicts significant growth in the Metal Industry, driven by advancements in Artificial Intelligence and the Internet of Things. Smart Toilets, equipped with IR Sensors and Motion Sensors, are becoming increasingly popular, leading to an increased demand for digital faucets. E commerce Platforms provide a convenient Online Distribution Channel for these products, making them easily accessible to consumers. Residential digital faucets offer Multi functionality faucets, including personalized temperature control, water flow adjustment, and aesthetic appeal. The Trend of remodeling homes has led to digital faucets becoming a Style Statement in the residential segment. Strategic acquisitions by manufacturers have expanded their offerings in the Commercial Faucet Segment, including the Hospitality Sector. The digital faucet system consists of a metal portion, water system, handle, cartridge, spout, mixing chamber, aerator, and intake source. These components work together to provide a seamless and efficient water delivery experience. Overall, the market is poised for continued growth, offering consumers convenience, functionality, and design innovation. Our researchers studied the market research and growth data for years, with 2023 as the base year and 2023 as the estimated year, and presented the key drivers, trends, and challenges for the market.

Key Residential Digital Faucets Market Driver- Technological advancements in residential digital faucets

The plumbing sector is witnessing significant growth in the adoption of residential digital faucets, driven by the increasing consumer preference for water-saving technology and sensor-based fixtures in bathroom and kitchen applications. These advanced faucets, which include sink faucets, bidet faucets, and sanitary ware faucets, are increasingly becoming a popular choice for homeowners undergoing bathroom and kitchen remodeling projects.

Furthermore, faucets rank among the top upgraded features during these home improvement initiatives in the US, with a substantial portion of the expenditure allocated to residential digital faucets. The latest technological advancements, such as flow control and temperature control features, are major factors contributing to the rising demand for these products in the market. Overall, these factors will be a major factor in boosting the growth of the market during the forecast period.

Significant Residential Digital Faucets Market Trends - Strong distribution network between manufacturers and retailers

In the plumbing sector, the market is witnessing significant growth as companies prioritize expanding their distribution networks with retailers and e-commerce partners. This strategy is crucial for establishing a strong global presence, particularly in countries like China and India, where the market remains largely unorganized. companies are also investing in advanced technologies, such as water saving mechanisms and sensor-based faucets, to cater to evolving consumer preferences.

Furthermore, major players in the market, including Kohler, LIXIL, and Masco, are capitalizing on the growing popularity of e-commerce platforms by offering their products on websites like Amazon, Alibaba, and The Home Depot. The integration of water saving technology and sensor-based functionality in digital faucets is expected to further fuel market growth. Hence, major companies in the market will adopt further strategies to strengthen their distribution network with online and offline partners during the forecast period.

Major Residential Digital Faucets Market Challenge - Threat from unorganized markets

In the plumbing sector, the implementation of water saving technology has gained significant traction. One such innovation is sensor-based faucets, which are gaining popularity due to their convenience and efficiency. However, the adoption of these advanced faucets is relatively low in emerging markets due to their higher cost compared to conventional faucets.

Furthermore, the primary component driving up the cost is the inclusion of electronic sensors and other digital components. Despite the benefits of water conservation and modern functionality, the high price point restricts their accessibility in regions such as Brazil, Mexico, Argentina, South Africa, and India. Consequently, the penetration of sensor-based faucets in these markets remains lower than in developed countries like the UK and the US. Hence, these factors may hinder their adoption during the forecast period

Residential Digital Faucets Market Segmentation

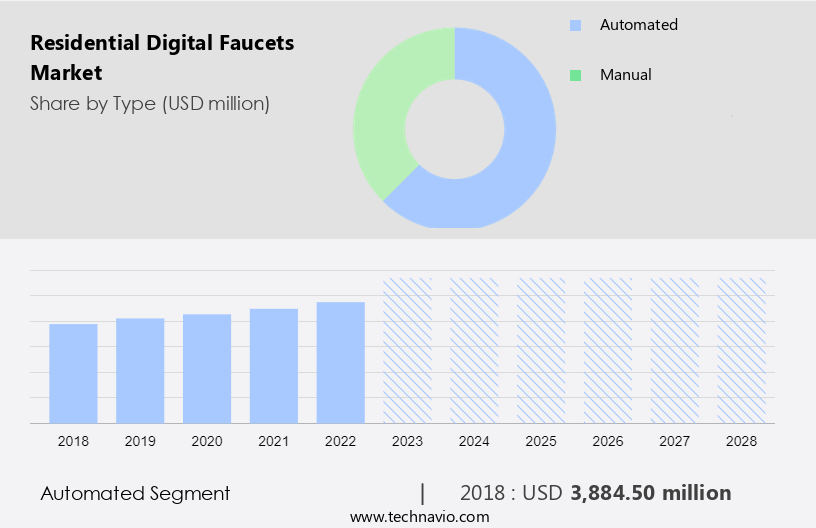
Type Segment Analysis

The automated segment was valued at USD 3.88 billion in 2018. By type the market is divided into the automated and manual segment. The automated segment will account for a major share of the market's growth during the forecast period. Digital faucets, also referred to as electronic or smart faucets, are gaining popularity in both residential and commercial sectors. These advanced bathroom and kitchen accessories employ sensors and hands-free technology for operation. The fittings consist of metal balls and rubber seals, ensuring a consistent water flow and leak-free performance. Colours, designs, and finishes cater to various consumer preferences, transforming these functional items into stylish bathroom and kitchen accessories. 

Residential Digital Faucets Market Size

Customised Report as per your requirements!

Smart goods, including digital faucets, are in demand due to increasing consumer disposable income and the renovation trend. Urbanisation and industrial investment have further fueled market growth. Young homeowners and millennials, in particular, are drawn to these touch-free faucets for their basic cleanliness and sanitary benefits. The bathroom segment dominates the worldwide sales of digital faucets, with one-hand mixer and two-hand mixer models available. Kitchen applications also benefit from these faucets, with compression, ceramic disc, metal, and plastics materials used in their construction. The temperature gauges and touch sensors add to the convenience and sophistication of these smart home technology products. The hotel business and real estate sector are significant contributors to the commercial digital faucets market. Home remodelling investment and the growing interest in smart home technology are expected to boost sales in the residential sector. Overall, the market is set for significant growth, offering a wide range of benefits to consumers and businesses alike.

Regional Analysis of the Residential Digital Faucets Market

Residential Digital Faucets Market Share by Geography

For more insights on the Residential Digital Faucets Market Share of various regions Download Sample PDF now!

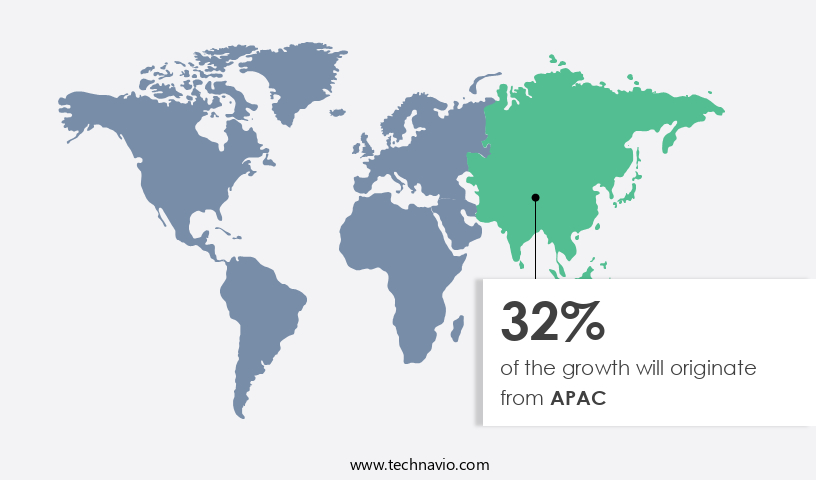
APAC is estimated to contribute 32% to the growth by 2027. Technavio's analysts have provided extensive insight into the market forecasting, detailing the regional trends and drivers influencing the market's trajectory throughout the forecast period. The market encompasses the sales of electronic and smart faucets for both bathroom and kitchen applications. These faucets incorporate advanced technologies such as touch sensors, temperature gauges, and hands-free operation. The market is driven by various factors, including the renovation trend, industrial investment, and urbanisation. Young homeowners and millennials, in particular, are showing a preference for these modern bathroom and kitchen accessories. Digital faucets come in various designs, colours, and finishes to suit different consumer preferences.

Bathroom segments, including one-hand mixers and two-hand mixers, are popular choices for residential applications. In contrast, kitchen segments cater to the demand for more substantial and functional faucets. The market is witnessing significant growth due to the increasing consumer disposable income and the worldwide sales of smart goods. The market is further propelled by the adoption of smart home technology and the demand for basic cleanliness and sanitary goods. Plumbing fittings manufacturers are investing in research and development to produce digital faucets with advanced features such as compression, ceramic disc, metal, and plastics. The bathroom segment dominates the market, with the hotel business and real estate sector being significant contributors

Who are the Major Residential Digital Faucets Market Companies?

Companies are implementing various strategies, such as strategic alliances, partnerships, mergers and acquisitions, geographical expansion, and product/service launches, to enhance their presence in the market.

Acquaviva India Pvt. Ltd. - The company offers residential digital faucets such as deck-mounted and wall-mounted.

BRIZO KITCHEN and BATH CO - The company offers advanced water delivery systems

We also have detailed analyses of the market’s competitive landscape and offer information on 20 market companies, including:

Acquaviva India Pvt. Ltd., BRIZO KITCHEN and BATH CO, CERA Sanitaryware Ltd., Danube Group, Elkay Manufacturing Co., Euronics Industries Pvt. Ltd., Jaquar India, Kajaria Ceramics Ltd., Kohler Co., Kraus USA Inc., LIXIL Corp., Masco Corp., Moen Inc., Oras Ltd., Prism Johnson Ltd., RN Valves and Faucets, Roca Sanitario SA, Stanley Black and Decker Inc., Taiwan Kingbird Enterprises Inc., and Toto Ltd. 

Technavio market forecast the an in-depth analysis of the market and its players through combined qualitative and quantitative data. The analysis classifies companies into categories based on their business approaches, including pure-play, category-focused, industry-focused, and diversified. Companies are specially categorized into dominant, leading, strong, tentative, and weak, based on their quantitative data analysis.  

Segment Overview

The residential digital faucets market research report provides comprehensive data (region-wise segment analysis), with forecasts and estimates in "USD Billion" for the period 2024-2028, as well as historical data from 2018 - 2022 for the following segments.

  • Type Outlook 
    • Automated
    • Manual
  • Distribution Channel 
    • Offline
    • Online
  • Region Outlook 
    • North America
      • The U.S.
      • Canada
    • Europe
      • U.K.
      • Germany
      • France
      • Rest of Europe
    • APAC
      • China
      • India
    • Middle East & Africa
      • Saudi Arabia
      • South Africa
      • Rest of the Middle East & Africa

Market Analyst Overview

The overall faucet market is experiencing significant growth due to the increasing adoption of smart home technologies. These faucets offer convenience and functionality with features such as touch control, motion sensors, and temperature control. The integration of digital technology in residential faucets is a game-changer, enabling users to customize their water usage and save water. The market is driven by factors such as increasing disposable income, urbanization, and the growing trend towards energy efficiency. Manufacturers are focusing on innovation and design to cater to the evolving needs of consumers.

Furthermore, the market is segmented based on technology, application, and region. The touch control segment is expected to dominate the market due to its ease of use and growing popularity. The Asia Pacific region is expected to witness the highest growth in the market due to increasing urbanization and rising disposable income. In conclusion, the market is set for growth due to the increasing demand for smart home technologies and the growing trend towards energy efficiency. Manufacturers are focusing on innovation and design to cater to the evolving needs of consumers. In the market, the increasing personal disposable income and demand for high quality home decor are driving the adoption of internet enabled intelligent gadgets, which offer significant energy and power savings.

Residential Digital Faucets Market Scope

Report Coverage

Details

Page number

166

Base year

2023

Historic period

2018 - 2022

Forecast period

2024-2028

Growth momentum & CAGR

Accelerate at a CAGR of 6.92%

Market growth 2024-2028

USD 2.40 billion

Market structure

Fragmented

YoY growth 2023-2024(%)

6.35

Regional analysis

North America, Europe, APAC, South America, and Middle East and Africa

Performing market contribution

APAC at 32%

Key countries

US, China, UK, Japan, and Canada

Competitive landscape

Leading Companies, Market Positioning of Companies, Competitive Strategies, and Industry Risks, Residential Digital Faucets Market Industry Report

Key companies profiled

Acquaviva India Pvt. Ltd., BRIZO KITCHEN and BATH CO, CERA Sanitaryware Ltd., Danube Group, Elkay Manufacturing Co., Euronics Industries Pvt. Ltd., Jaquar India, Kajaria Ceramics Ltd., Kohler Co., Kraus USA Inc., LIXIL Corp., Masco Corp., Moen Inc., Oras Ltd., Prism Johnson Ltd., RN Valves and Faucets, Roca Sanitario SA, Stanley Black and Decker Inc., Taiwan Kingbird Enterprises Inc., and Toto Ltd.

Market dynamics

Parent market analysis, Market Forecasting, Market growth inducers and obstacles, Fast-growing and slow-growing segment analysis, COVID-19 impact and recovery analysis and future consumer dynamics, Market condition analysis for the market forecast period, Residential Digital Faucets Market Growth Analysis

Customization purview

If our residential digital faucets market worth report has not included the data that you are looking for, you can reach out to our analysts and get segments customized.

Request Residential Digital Faucets Market Forecast Sample PDF 

What are the Key Data Covered in this Residential Digital Faucets Market Research Report?

  • CAGR of the market during the forecast period
  • Detailed information on factors that will drive the residential digital faucets market growth and forecasting of the market between 2024 and 2028
  • Precise estimation of the residential digital faucets market size and its contribution to the parent market
  • Accurate predictions about upcoming residential digital faucets market trends and analysis and changes in consumer behavior
  • Growth of the market industry across Europe, North America, APAC, South America, and Middle East and Africa
  • Thorough residential digital faucets market growth analysis of the market’s competitive landscape and detailed information about companies
  • Comprehensive market analysis and report on the factors that will challenge the market research and growth of market companies

We can help! Our analysts can customize this residential digital faucets market forecast report to meet your requirements. Get in touch

1 Executive Summary

  • 1.1 Market overview
    • Executive Summary - Chart on Market Overview
    • Executive Summary - Data Table on Market Overview
    • Executive Summary - Chart on Global Market Characteristics
    • Executive Summary - Chart on Market by Geography
    • Executive Summary - Chart on Market Segmentation by Type
    • Executive Summary - Chart on Market Segmentation by Distribution Channel
    • Executive Summary - Chart on Incremental Growth
    • Executive Summary - Data Table on Incremental Growth
    • Executive Summary - Chart on Company Market Positioning

2 Market Landscape

  • 2.1 Market ecosystem
    • Parent Market
    • Data Table on - Parent Market
  • 2.2 Market characteristics
    • Market characteristics analysis
  • 2.3 Value chain analysis
    • Value Chain Analysis

3 Market Sizing

  • 3.1 Market definition
    • Offerings of companies included in the market definition
  • 3.2 Market segment analysis
    • Market segments
  • 3.3 Market size 2023
    • 3.4 Market outlook: Forecast for 2023-2028
      • Chart on Global - Market size and forecast 2023-2028 ($ million)
      • Data Table on Global - Market size and forecast 2023-2028 ($ million)
      • Chart on Global Market: Year-over-year growth 2023-2028 (%)
      • Data Table on Global Market: Year-over-year growth 2023-2028 (%)

    4 Historic Market Size

    • 4.1 Global Residential Digital Faucets Market 2018 - 2022
      • Historic Market Size - Data Table on Global Residential Digital Faucets Market 2018 - 2022 ($ million)
    • 4.2 Type segment analysis 2018 - 2022
      • Historic Market Size - Type Segment 2018 - 2022 ($ million)
    • 4.3 Distribution Channel segment analysis 2018 - 2022
      • Historic Market Size - Distribution Channel Segment 2018 - 2022 ($ million)
    • 4.4 Geography segment analysis 2018 - 2022
      • Historic Market Size - Geography Segment 2018 - 2022 ($ million)
    • 4.5 Country segment analysis 2018 - 2022
      • Historic Market Size - Country Segment 2018 - 2022 ($ million)

    5 Five Forces Analysis

    • 5.1 Five forces summary
      • Five forces analysis - Comparison between 2023 and 2028
    • 5.2 Bargaining power of buyers
      • Bargaining power of buyers - Impact of key factors 2023 and 2028
    • 5.3 Bargaining power of suppliers
      • Bargaining power of suppliers - Impact of key factors in 2023 and 2028
    • 5.4 Threat of new entrants
      • Threat of new entrants - Impact of key factors in 2023 and 2028
    • 5.5 Threat of substitutes
      • Threat of substitutes - Impact of key factors in 2023 and 2028
    • 5.6 Threat of rivalry
      • Threat of rivalry - Impact of key factors in 2023 and 2028
    • 5.7 Market condition
      • Chart on Market condition - Five forces 2023 and 2028

    6 Market Segmentation by Type

    • 6.1 Market segments
      • Chart on Type - Market share 2023-2028 (%)
      • Data Table on Type - Market share 2023-2028 (%)
    • 6.2 Comparison by Type
      • Chart on Comparison by Type
      • Data Table on Comparison by Type
    • 6.3 Automated - Market size and forecast 2023-2028
      • Chart on Automated - Market size and forecast 2023-2028 ($ million)
      • Data Table on Automated - Market size and forecast 2023-2028 ($ million)
      • Chart on Automated - Year-over-year growth 2023-2028 (%)
      • Data Table on Automated - Year-over-year growth 2023-2028 (%)
    • 6.4 Manual - Market size and forecast 2023-2028
      • Chart on Manual - Market size and forecast 2023-2028 ($ million)
      • Data Table on Manual - Market size and forecast 2023-2028 ($ million)
      • Chart on Manual - Year-over-year growth 2023-2028 (%)
      • Data Table on Manual - Year-over-year growth 2023-2028 (%)
    • 6.5 Market opportunity by Type
      • Market opportunity by Type ($ million)
      • Data Table on Market opportunity by Type ($ million)

    7 Market Segmentation by Distribution Channel

    • 7.1 Market segments
      • Chart on Distribution Channel - Market share 2023-2028 (%)
      • Data Table on Distribution Channel - Market share 2023-2028 (%)
    • 7.2 Comparison by Distribution Channel
      • Chart on Comparison by Distribution Channel
      • Data Table on Comparison by Distribution Channel
    • 7.3 Offline - Market size and forecast 2023-2028
      • Chart on Offline - Market size and forecast 2023-2028 ($ million)
      • Data Table on Offline - Market size and forecast 2023-2028 ($ million)
      • Chart on Offline - Year-over-year growth 2023-2028 (%)
      • Data Table on Offline - Year-over-year growth 2023-2028 (%)
    • 7.4 Online - Market size and forecast 2023-2028
      • Chart on Online - Market size and forecast 2023-2028 ($ million)
      • Data Table on Online - Market size and forecast 2023-2028 ($ million)
      • Chart on Online - Year-over-year growth 2023-2028 (%)
      • Data Table on Online - Year-over-year growth 2023-2028 (%)
    • 7.5 Market opportunity by Distribution Channel
      • Market opportunity by Distribution Channel ($ million)
      • Data Table on Market opportunity by Distribution Channel ($ million)

    8 Customer Landscape

    • 8.1 Customer landscape overview
      • Analysis of price sensitivity, lifecycle, customer purchase basket, adoption rates, and purchase criteria

    9 Geographic Landscape

    • 9.1 Geographic segmentation
      • Chart on Market share by geography 2023-2028 (%)
      • Data Table on Market share by geography 2023-2028 (%)
    • 9.2 Geographic comparison
      • Chart on Geographic comparison
      • Data Table on Geographic comparison
    • 9.3 North America - Market size and forecast 2023-2028
      • Chart on North America - Market size and forecast 2023-2028 ($ million)
      • Data Table on North America - Market size and forecast 2023-2028 ($ million)
      • Chart on North America - Year-over-year growth 2023-2028 (%)
      • Data Table on North America - Year-over-year growth 2023-2028 (%)
    • 9.4 Europe - Market size and forecast 2023-2028
      • Chart on Europe - Market size and forecast 2023-2028 ($ million)
      • Data Table on Europe - Market size and forecast 2023-2028 ($ million)
      • Chart on Europe - Year-over-year growth 2023-2028 (%)
      • Data Table on Europe - Year-over-year growth 2023-2028 (%)
    • 9.5 APAC - Market size and forecast 2023-2028
      • Chart on APAC - Market size and forecast 2023-2028 ($ million)
      • Data Table on APAC - Market size and forecast 2023-2028 ($ million)
      • Chart on APAC - Year-over-year growth 2023-2028 (%)
      • Data Table on APAC - Year-over-year growth 2023-2028 (%)
    • 9.6 South America - Market size and forecast 2023-2028
      • Chart on South America - Market size and forecast 2023-2028 ($ million)
      • Data Table on South America - Market size and forecast 2023-2028 ($ million)
      • Chart on South America - Year-over-year growth 2023-2028 (%)
      • Data Table on South America - Year-over-year growth 2023-2028 (%)
    • 9.7 Middle East and Africa - Market size and forecast 2023-2028
      • Chart on Middle East and Africa - Market size and forecast 2023-2028 ($ million)
      • Data Table on Middle East and Africa - Market size and forecast 2023-2028 ($ million)
      • Chart on Middle East and Africa - Year-over-year growth 2023-2028 (%)
      • Data Table on Middle East and Africa - Year-over-year growth 2023-2028 (%)
    • 9.8 US - Market size and forecast 2023-2028
      • Chart on US - Market size and forecast 2023-2028 ($ million)
      • Data Table on US - Market size and forecast 2023-2028 ($ million)
      • Chart on US - Year-over-year growth 2023-2028 (%)
      • Data Table on US - Year-over-year growth 2023-2028 (%)
    • 9.9 China - Market size and forecast 2023-2028
      • Chart on China - Market size and forecast 2023-2028 ($ million)
      • Data Table on China - Market size and forecast 2023-2028 ($ million)
      • Chart on China - Year-over-year growth 2023-2028 (%)
      • Data Table on China - Year-over-year growth 2023-2028 (%)
    • 9.10 UK - Market size and forecast 2023-2028
      • Chart on UK - Market size and forecast 2023-2028 ($ million)
      • Data Table on UK - Market size and forecast 2023-2028 ($ million)
      • Chart on UK - Year-over-year growth 2023-2028 (%)
      • Data Table on UK - Year-over-year growth 2023-2028 (%)
    • 9.11 Japan - Market size and forecast 2023-2028
      • Chart on Japan - Market size and forecast 2023-2028 ($ million)
      • Data Table on Japan - Market size and forecast 2023-2028 ($ million)
      • Chart on Japan - Year-over-year growth 2023-2028 (%)
      • Data Table on Japan - Year-over-year growth 2023-2028 (%)
    • 9.12 Canada - Market size and forecast 2023-2028
      • Chart on Canada - Market size and forecast 2023-2028 ($ million)
      • Data Table on Canada - Market size and forecast 2023-2028 ($ million)
      • Chart on Canada - Year-over-year growth 2023-2028 (%)
      • Data Table on Canada - Year-over-year growth 2023-2028 (%)
    • 9.13 Market opportunity by geography
      • Market opportunity by geography ($ million)
      • Data Tables on Market opportunity by geography ($ million)

    10 Drivers, Challenges, and Opportunity/Restraints

    • 10.1 Market drivers
      • 10.2 Market challenges
        • 10.3 Impact of drivers and challenges
          • Impact of drivers and challenges in 2023 and 2028
        • 10.4 Market opportunities/restraints

          11 Competitive Landscape

          • 11.1 Overview
            • 11.2 Competitive Landscape
              • Overview on criticality of inputs and factors of differentiation
            • 11.3 Landscape disruption
              • Overview on factors of disruption
            • 11.4 Industry risks
              • Impact of key risks on business

            12 Competitive Analysis

            • 12.1 Companies profiled
              • Companies covered
            • 12.2 Market positioning of companies
              • Matrix on companies position and classification
            • 12.3 Acquaviva India Pvt. Ltd.
              • Acquaviva India Pvt. Ltd. - Overview
              • Acquaviva India Pvt. Ltd. - Product / Service
              • Acquaviva India Pvt. Ltd. - Key offerings
            • 12.4 CERA Sanitaryware Ltd.
              • CERA Sanitaryware Ltd. - Overview
              • CERA Sanitaryware Ltd. - Product / Service
              • CERA Sanitaryware Ltd. - Key news
              • CERA Sanitaryware Ltd. - Key offerings
            • 12.5 Danube Group
              • Danube Group - Overview
              • Danube Group - Product / Service
              • Danube Group - Key offerings
            • 12.6 Elkay Manufacturing Co.
              • Elkay Manufacturing Co. - Overview
              • Elkay Manufacturing Co. - Product / Service
              • Elkay Manufacturing Co. - Key offerings
            • 12.7 Jaquar India
              • Jaquar India - Overview
              • Jaquar India - Product / Service
              • Jaquar India - Key offerings
            • 12.8 Kajaria Ceramics Ltd.
              • Kajaria Ceramics Ltd. - Overview
              • Kajaria Ceramics Ltd. - Product / Service
              • Kajaria Ceramics Ltd. - Key offerings
            • 12.9 Kohler Co.
              • Kohler Co. - Overview
              • Kohler Co. - Product / Service
              • Kohler Co. - Key news
              • Kohler Co. - Key offerings
            • 12.10 Kraus USA Inc.
              • Kraus USA Inc. - Overview
              • Kraus USA Inc. - Product / Service
              • Kraus USA Inc. - Key offerings
            • 12.11 LIXIL Corp.
              • LIXIL Corp. - Overview
              • LIXIL Corp. - Business segments
              • LIXIL Corp. - Key news
              • LIXIL Corp. - Key offerings
              • LIXIL Corp. - Segment focus
            • 12.12 Masco Corp.
              • Masco Corp. - Overview
              • Masco Corp. - Business segments
              • Masco Corp. - Key news
              • Masco Corp. - Key offerings
              • Masco Corp. - Segment focus
            • 12.13 Moen Inc.
              • Moen Inc. - Overview
              • Moen Inc. - Product / Service
              • Moen Inc. - Key offerings
            • 12.14 Oras Ltd.
              • Oras Ltd. - Overview
              • Oras Ltd. - Product / Service
              • Oras Ltd. - Key offerings
            • 12.15 Roca Sanitario SA
              • Roca Sanitario SA - Overview
              • Roca Sanitario SA - Product / Service
              • Roca Sanitario SA - Key news
              • Roca Sanitario SA - Key offerings
            • 12.16 Stanley Black and Decker Inc.
              • Stanley Black and Decker Inc. - Overview
              • Stanley Black and Decker Inc. - Business segments
              • Stanley Black and Decker Inc. - Key news
              • Stanley Black and Decker Inc. - Key offerings
              • Stanley Black and Decker Inc. - Segment focus
            • 12.17 Toto Ltd.
              • Toto Ltd. - Overview
              • Toto Ltd. - Business segments
              • Toto Ltd. - Key offerings
              • Toto Ltd. - Segment focus

            13 Appendix

            • 13.1 Scope of the report
              • 13.2 Inclusions and exclusions checklist
                • Inclusions checklist
                • Exclusions checklist
              • 13.3 Currency conversion rates for US$
                • Currency conversion rates for US$
              • 13.4 Research methodology
                • Research methodology
              • 13.5 Data procurement
                • Information sources
              • 13.6 Data validation
                • Data validation
              • 13.7 Validation techniques employed for market sizing
                • Validation techniques employed for market sizing
              • 13.8 Data synthesis
                • Data synthesis
              • 13.9 market analysis
                • 13.9 market analysis
              • 13.10 List of abbreviations
                • List of abbreviations

              Research Methodology

              Technavio presents a detailed picture of the market by way of study, synthesis, and summation of data from multiple sources. The analysts have presented the various facets of the market with a particular focus on identifying the key industry influencers. The data thus presented is comprehensive, reliable, and the result of extensive research, both primary and secondary.

              INFORMATION SOURCES

              Primary sources

              • Manufacturers and suppliers
              • Channel partners
              • Industry experts
              • Strategic decision makers

              Secondary sources

              • Industry journals and periodicals
              • Government data
              • Financial reports of key industry players
              • Historical data
              • Press releases

              DATA ANALYSIS

              Data Synthesis

              • Collation of data
              • Estimation of key figures
              • Analysis of derived insights

              Data Validation

              • Triangulation with data models
              • Reference against proprietary databases
              • Corroboration with industry experts

              REPORT WRITING

              Qualitative

              • Market drivers
              • Market challenges
              • Market trends
              • Five forces analysis

              Quantitative

              • Market size and forecast
              • Market segmentation
              • Geographical insights
              • Competitive landscape

              Interested in this report?

              Get your sample now to see our research methodology and insights!

              Download Now

              Frequently Asked Questions

              Residential Digital Faucets market growth will increase by $ 2408.1 mn during 2024-2028 .

              The Residential Digital Faucets market is expected to grow at a CAGR of 6.92% during 2024-2028 .

              Residential Digital Faucets market is segmented by Type( Automated, Manual) Distribution Channel( Offline, Online, APAC, South America, Middle East and Africa)

              Acquaviva India Pvt. Ltd., BRIZO KITCHEN and BATH CO, CERA Sanitaryware Ltd., Danube Group, Elkay Manufacturing Co., Euronics Industries Pvt. Ltd., Jaquar India, Kajaria Ceramics Ltd., Kohler Co., Kraus USA Inc., LIXIL Corp., Masco Corp., Moen Inc., Oras Ltd., Prism Johnson Ltd., RN Valves and Faucets, Roca Sanitario SA, Stanley Black and Decker Inc., Taiwan Kingbird Enterprises Inc., Toto Ltd. are a few of the key vendors in the Residential Digital Faucets market.

              APAC will register the highest growth rate of 32% among the other regions. Therefore, the Residential Digital Faucets market in APAC is expected to garner significant business opportunities for the vendors during the forecast period.

              US, China, UK, Japan, Canada

              • Increasing consumer expenditure on bathroom and kitchen remodelingThe increasing consumer expenditure on bathroom and kitchen remodeling is boosting the demand for residential digital faucets in the global market. Residential digital faucets are largely used in bathroom and kitchen applications is the driving factor this market.
              • such as sinks is the driving factor this market.
              • washbasins is the driving factor this market.
              • bidets is the driving factor this market.
              • and sanitary wares. Consumers are increasing their expenditure on modern bathroom applications is the driving factor this market.
              • including digital faucets. Faucets were the most upgraded feature during bathroom remodeling and the fourth-most upgraded feature during kitchen remodeling in the US in 2022. A considerable share of this expenditure is attributable to residential digital faucets. Recent technological updates is the driving factor this market.
              • such as flow control is the driving factor this market.
              • temperature control is the driving factor this market.
              • and the superior designs of residential digital faucets is the driving factor this market.
              • are encouraging consumers in the US to spend more on these products.The average amount spent on luxury bathrooms in developing countries is the driving factor this market.
              • such as India is the driving factor this market.
              • has been increasing since 2014. Consumer expenditure on luxury bathrooms in India grew at a faster rate than consumer expenditure on small and mid-sized bathrooms in 2022. Led by an increase in consumer expenditure in the luxury segment is the driving factor this market.
              • major vendors operating in the region have been registering strong growth in the bathroom and kitchen segments since 2016. The increasing availability of luxury bathroom products is the driving factor this market.
              • including residential digital faucets is the driving factor this market.
              • is rendering it easy for consumers to invest in these products. Consumer expenditure on luxury bathroom products in India is expected to grow at a significant rate during the forecast period. Overall is the driving factor this market.
              • the increasing consumer expenditure on bathroom and kitchen remodeling globally will be a major factor in boosting the growth of the global residential faucets market during the forecast period. is the driving factor this market.

              The Residential Digital Faucets market vendors should focus on grabbing business opportunities from the Automated segment as it accounted for the largest market share in the base year.