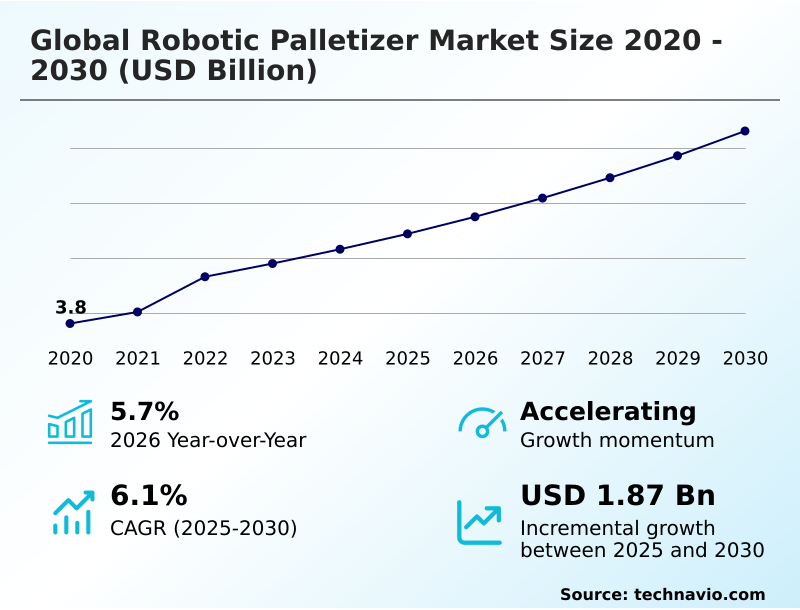
Robotic Palletizer Market Size 2026-2030
The robotic palletizer market size is valued to increase by USD 1.87 billion, at a CAGR of 6.1% from 2025 to 2030. Increasing adoption of automation to mitigate labor scarcity and boost productivity will drive the robotic palletizer market.
Major Market Trends & Insights
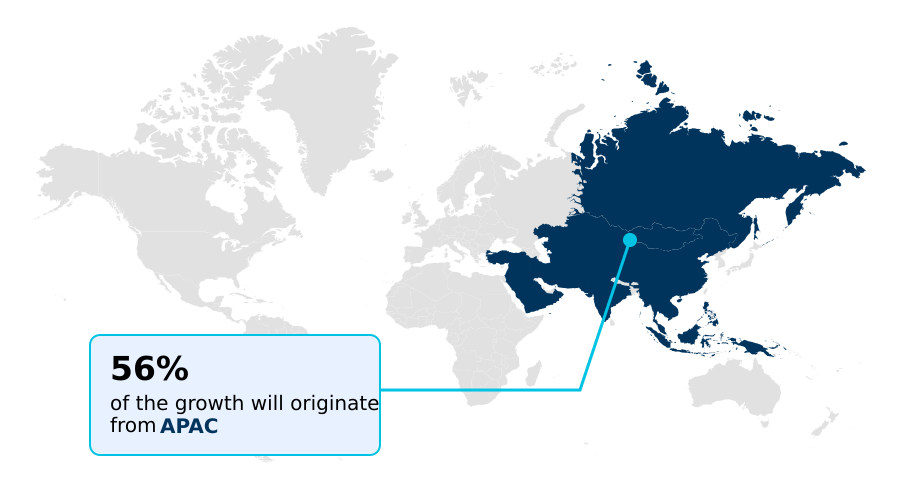
- APAC dominated the market and accounted for a 56% growth during the forecast period.
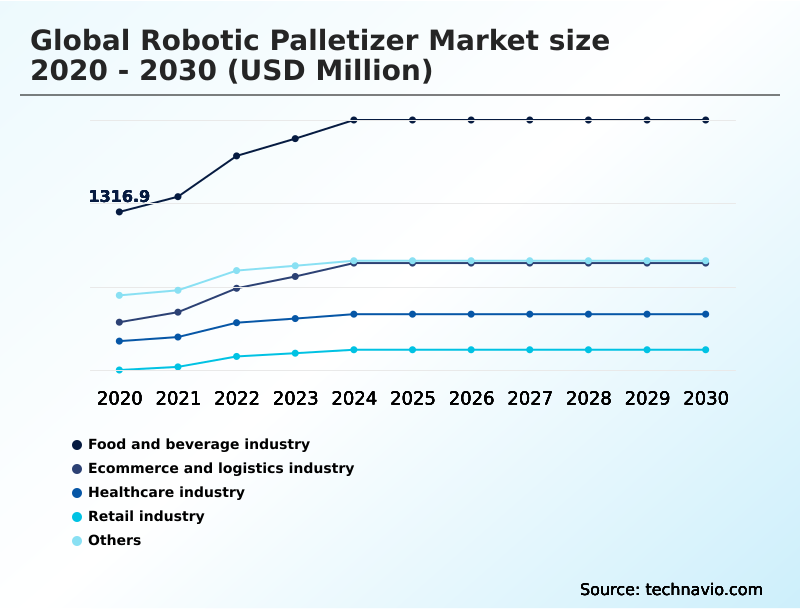
- By End-user - Food and beverage industry segment was valued at USD 1.85 billion in 2024
- By Type - Articulated robots segment accounted for the largest market revenue share in 2024
Market Size & Forecast
- Market Opportunities: USD 3.51 billion
- Market Future Opportunities: USD 1.87 billion
- CAGR from 2025 to 2030 : 6.1%
Market Summary
- The Robotic Palletizer Market is undergoing significant expansion, driven by the convergence of labor market shifts and technological innovation. Persistent worker shortages and rising operational costs in manufacturing and logistics compel businesses to adopt automation as a strategic imperative for productivity and operational continuity.
- Robotic systems automate the physically strenuous and repetitive task of stacking products, allowing companies to reallocate human capital to higher-value activities. This pivot is not merely about cost reduction; it is a fundamental component of building more resilient and efficient supply chains.
- For example, in a high-volume distribution center, automated palletizing can increase throughput by over 30% while simultaneously reducing product damage, ensuring that goods are ready for dispatch faster and more reliably.
- The integration of advanced sensors and AI is making these systems more versatile, capable of handling diverse product types and complex stacking patterns, which is critical in sectors with high product variability like e-commerce and consumer goods. However, the high initial investment and the complexity of integrating these systems with existing infrastructure remain significant considerations for many organizations.
What will be the Size of the Robotic Palletizer Market during the forecast period?
Get Key Insights on Market Forecast (PDF) Get Free Sample
How is the Robotic Palletizer Market Segmented?
The robotic palletizer industry research report provides comprehensive data (region-wise segment analysis), with forecasts and estimates in "USD million" for the period 2026-2030, as well as historical data from 2020-2024 for the following segments.
- End-user
- Food and beverage industry
- Ecommerce and logistics industry
- Healthcare industry
- Retail industry
- Others
- Type
- Articulated robots
- Collaborative robots
- Application
- Case palletizers
- Depalletizers
- Bag palletizers
- Pail palletizers
- Geography
- APAC
- China
- Japan
- India
- Europe
- Germany
- UK
- France
- North America
- US
- Canada
- Mexico
- South America
- Brazil
- Argentina
- Middle East and Africa
- Saudi Arabia
- UAE
- South Africa
- Rest of World (ROW)
- APAC
By End-user Insights
The food and beverage industry segment is estimated to witness significant growth during the forecast period.
The food and beverage sector remains a dominant end-user, driven by the need for high-speed, hygienic, and precise handling of diverse packaged goods. The push for supply chain velocity is critical, as automation improves operational resilience against labor volatility.
Deploying robotic systems leads to a quantifiable return on investment through higher throughput and reduced product damage, with automated handling decreasing spoilage and breakage incidents by over 15% compared to manual processes.
As the industry adapts to the demands of omnichannel retail, the integration of these systems within fulfillment centers and distribution centers becomes essential for managing both bulk shipments and direct e-commerce fulfillment, often leveraging the industrial internet of things for enhanced process control.
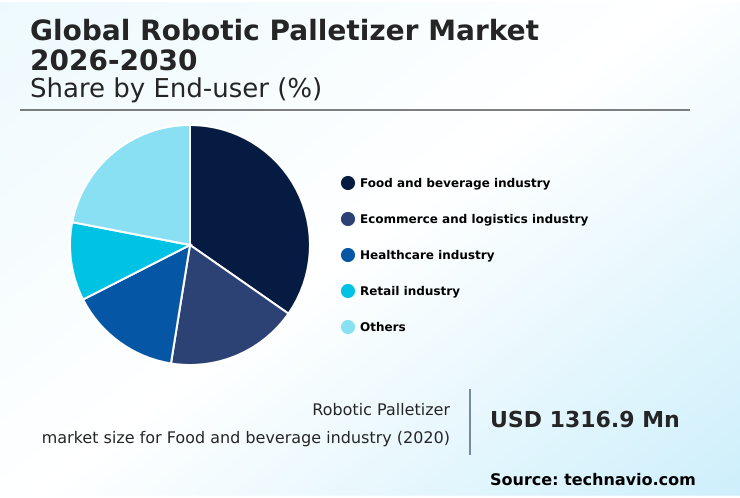
The Food and beverage industry segment was valued at USD 1.85 billion in 2024 and showed a gradual increase during the forecast period.
Regional Analysis
APAC is estimated to contribute 56% to the growth of the global market during the forecast period.Technavio’s analysts have elaborately explained the regional trends and drivers that shape the market during the forecast period.
See How Robotic Palletizer Market Demand is Rising in APAC Get Free Sample
The global landscape is led by APAC, where adoption of advanced manufacturing technologies is expanding at a rate approximately 35% faster than in North America. In this region, high throughput is critical for automotive component manufacturing and electronics.
Europe's market is driven by strict regulations, fueling demand for systems in pharmaceutical packaging machinery that can operate in cleanroom environments. North America focuses on automating food and beverage packaging lines and logistics.
Across regions, technology is advancing, with multi-axis robotic arms performing precise layer forming. The adoption of the modular palletizer is growing, particularly for SMEs needing flexible solutions for tasks that fall short of full-scale heavy-duty palletizing operations.
Market Dynamics
Our researchers analyzed the data with 2025 as the base year, along with the key drivers, trends, and challenges. A holistic analysis of drivers will help companies refine their marketing strategies to gain a competitive advantage.
- Enterprises are increasingly conducting a detailed cost analysis of robotic palletizing to justify investment. The benefits of robotic palletizers in ecommerce are clear, driving adoption in high-velocity environments. A common point of evaluation is the robotic palletizer vs conventional palletizer, where robots offer superior flexibility.
- For instance, the robotic palletizer for food and beverage applications must adhere to strict hygiene standards, while systems for retail distribution focus on creating store-friendly pallets. A key application is the collaborative robot for mixed-case palletizing, a complex task in modern logistics. System integrators are crucial for successful robotic palletizer integration with WMS, ensuring seamless data flow.
- The market for high-payload robotic palletizer applications continues to grow, particularly for heavy industries requiring robotic palletizer for pail and drum handling. For inbound logistics, the robotic depalletizer for distribution centers is becoming standard. Firms also seek turnkey palletizing solution providers to manage robotic palletizer implementation challenges, including the need for robotic palletizer maintenance and training.
- Adherence to robotic palletizer safety standards compliance is non-negotiable. Furthermore, AI-driven pallet pattern optimization is a key value-add, ensuring stability. Solutions are also being developed for specialized needs, such as the robotic palletizer for cold storage environments and systems that meet robotic palletizing for pharmaceutical compliance.
- A modular robotic palletizer for SMEs offers an accessible entry point, with adoption rates in this segment growing nearly 50% faster than in large enterprises with legacy systems.
What are the key market drivers leading to the rise in the adoption of Robotic Palletizer Industry?
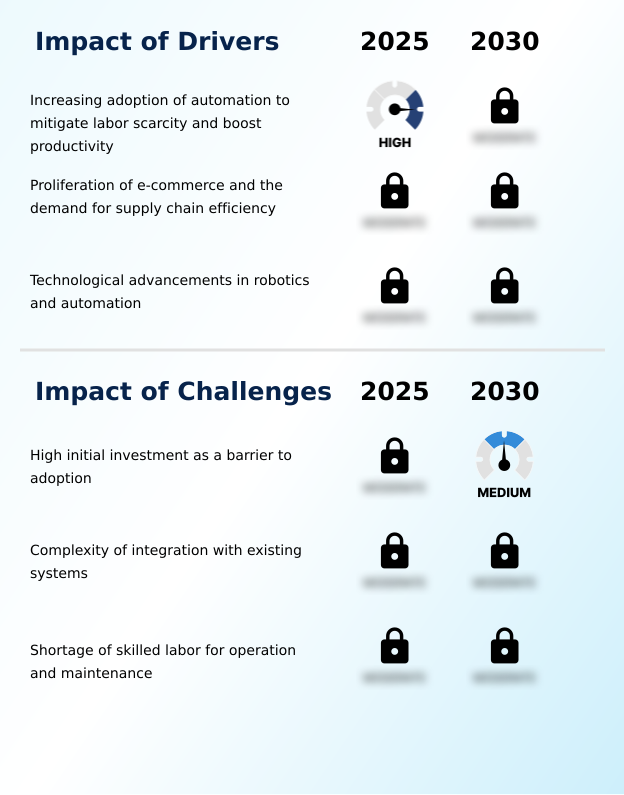
- The increasing adoption of automation to mitigate labor scarcity and boost productivity serves as a key driver for market growth.
- The push toward smart factory concepts and greater manufacturing resilience is a significant market driver. Companies are leveraging logistics automation to achieve workforce optimization and operational efficiency.
- The demand for high-speed operation is met by robotic systems that increase throughput by up to 40% compared to manual methods.
- Integrating these systems with a warehouse management system and automated storage and retrieval systems creates a seamless data and material flow.
- Furthermore, advancements like digital twin technologies are enabling businesses to model and de-risk the implementation of turnkey palletizing systems, ensuring solutions are optimized for specific payload capacity requirements and facility layouts before deployment.
What are the market trends shaping the Robotic Palletizer Industry?
- Pervasive labor shortages and escalating operational costs are emerging as a significant market trend, compelling industries to accelerate the adoption of automation.
- The imperative for supply chain optimization is accelerating the adoption of advanced warehouse automation technologies. Evolving end-of-line packaging requirements, particularly the rise of complex mixed-case palletizing in e-commerce, are driving demand for flexible automated palletizing solutions. This trend favors the deployment of both traditional articulated robots for high-speed tasks and, increasingly, collaborative robots for their adaptability.
- Integrated with advanced machine vision systems, these platforms improve picking accuracy by over 99.5%. The complexity of robotic system integration with customized end-of-arm tooling remains a key consideration, but the need to manage rising operational costs makes these investments crucial for maintaining a competitive edge.
What challenges does the Robotic Palletizer Industry face during its growth?
- The high initial investment required for implementation presents a key challenge to widespread adoption, affecting industry growth.
- Achieving production efficiency and operational continuity through end-of-line automation faces implementation hurdles. The complexity of system integration, particularly with legacy equipment in high-volume production environments, can extend deployment times by 25% or more compared to greenfield projects.
- While turnkey robotic solutions aim to simplify this process, a shortage of skilled technicians for programming and predictive maintenance on AI-powered systems creates ongoing challenges. Ensuring new systems improve ergonomic conditions without disrupting workflows is a delicate balance.
- The need for a workforce capable of managing sophisticated automation, from robotic palletizers to goods-to-person mobile robots, remains a primary consideration for sustained success.
Exclusive Technavio Analysis on Customer Landscape
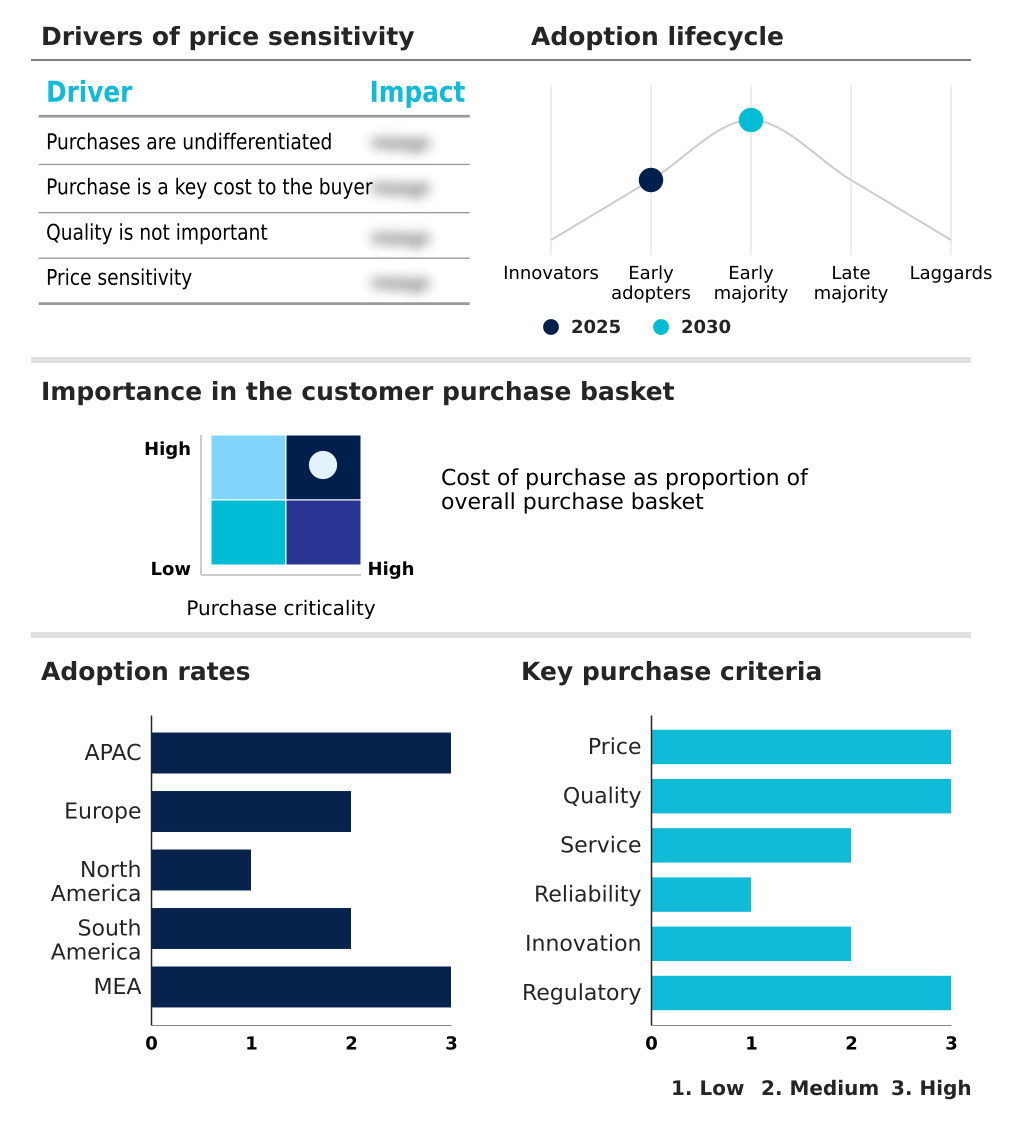
The robotic palletizer market forecasting report includes the adoption lifecycle of the market, covering from the innovator’s stage to the laggard’s stage. It focuses on adoption rates in different regions based on penetration. Furthermore, the robotic palletizer market report also includes key purchase criteria and drivers of price sensitivity to help companies evaluate and develop their market growth analysis strategies.
Customer Landscape of Robotic Palletizer Industry
Competitive Landscape
Companies are implementing various strategies, such as strategic alliances, robotic palletizer market forecast, partnerships, mergers and acquisitions, geographical expansion, and product/service launches, to enhance their presence in the industry.
ABB Ltd. - Offerings feature robotic systems engineered for flexible packaging automation, enhancing end-of-line productivity and operational versatility for diverse industrial applications.
The industry research and growth report includes detailed analyses of the competitive landscape of the market and information about key companies, including:
- ABB Ltd.
- ABC Packaging Machine Corp
- Armstrong World Industries
- Brenton LLC
- Concetti S.p.a
- DENSO Corp.
- Duravant LLC
- FANUC Corp.
- Fuji Yusoki Kogyo Co. Ltd.
- Hartness International
- Kawasaki Heavy Industries Ltd.
- Krones AG
- KUKA AG
- MMCI Automation
- Okura Yusoki Co. Ltd.
- Schneider Packaging
- Serpa Packaging Solutions
- Staubli International
- Universal Robots AS
- Yaskawa Electric Corp.
Qualitative and quantitative analysis of companies has been conducted to help clients understand the wider business environment as well as the strengths and weaknesses of key industry players. Data is qualitatively analyzed to categorize companies as pure play, category-focused, industry-focused, and diversified; it is quantitatively analyzed to categorize companies as dominant, leading, strong, tentative, and weak.
Recent Development and News in Robotic palletizer market
- In November 2024, Fanuc Corp. introduced the M-950iA/500 palletizing robot, expanding its automation solutions to address heavy-duty industrial applications.
- In November 2024, Catalyx and INEL announced a strategic partnership to deliver comprehensive end-to-end automated packaging solutions for the pharmaceutical and medical device sectors.
- In January 2025, Sager Foods implemented two collaborative robot palletizers as a strategic response to labor shortages, enabling the reallocation of three operators to higher-value positions.
- In May 2025, Yaskawa Electric Corp. launched a new collaborative robot specifically designed for medium-payload palletizing, featuring advanced safety systems to facilitate safe collaboration with human workers.
Dive into Technavio’s robust research methodology, blending expert interviews, extensive data synthesis, and validated models for unparalleled Robotic Palletizer Market insights. See full methodology.
| Market Scope | |
|---|---|
| Page number | 306 |
| Base year | 2025 |
| Historic period | 2020-2024 |
| Forecast period | 2026-2030 |
| Growth momentum & CAGR | Accelerate at a CAGR of 6.1% |
| Market growth 2026-2030 | USD 1872.7 million |
| Market structure | Fragmented |
| YoY growth 2025-2026(%) | 5.7% |
| Key countries | China, Japan, India, South Korea, Australia, Indonesia, Germany, UK, France, Italy, Spain, The Netherlands, US, Canada, Mexico, Brazil, Argentina, Chile, Saudi Arabia, UAE, South Africa, Israel and Turkey |
| Competitive landscape | Leading Companies, Market Positioning of Companies, Competitive Strategies, and Industry Risks |
Research Analyst Overview
- The robotic palletizer market is defined by the strategic imperative to enhance operational resilience and supply chain velocity. Core technologies include multi-axis robotic arms, which are increasingly deployed as both high-payload articulated robots and flexible collaborative robots. Key applications like mixed-case palletizing for e-commerce depend on advanced machine vision systems and sophisticated end-of-arm tooling.
- The pursuit of high throughput and high-speed operation is driving adoption across industries. A critical decision for management involves balancing the initial capital for a modular palletizer or turnkey robotic solutions against the long-term return on investment, which is often realized within 24 months. Integration with a warehouse management system and automated storage and retrieval systems is vital.
- The use of AI-powered systems and digital twin technologies facilitates predictive maintenance and optimizes layer forming, leading to reduced product damage. Successful system integration ensures improved ergonomic conditions and addresses the demand for automation in sterile cleanroom environments, boosting overall payload capacity and efficiency.
What are the Key Data Covered in this Robotic Palletizer Market Research and Growth Report?
-
What is the expected growth of the Robotic Palletizer Market between 2026 and 2030?
-
USD 1.87 billion, at a CAGR of 6.1%
-
-
What segmentation does the market report cover?
-
The report is segmented by End-user (Food and beverage industry, Ecommerce and logistics industry, Healthcare industry, Retail industry, and Others), Type (Articulated robots, and Collaborative robots), Application (Case palletizers, Depalletizers, Bag palletizers, and Pail palletizers) and Geography (APAC, Europe, North America, South America, Middle East and Africa)
-
-
Which regions are analyzed in the report?
-
APAC, Europe, North America, South America and Middle East and Africa
-
-
What are the key growth drivers and market challenges?
-
Increasing adoption of automation to mitigate labor scarcity and boost productivity, High initial investment as a barrier to adoption
-
-
Who are the major players in the Robotic Palletizer Market?
-
ABB Ltd., ABC Packaging Machine Corp, Armstrong World Industries, Brenton LLC, Concetti S.p.a, DENSO Corp., Duravant LLC, FANUC Corp., Fuji Yusoki Kogyo Co. Ltd., Hartness International, Kawasaki Heavy Industries Ltd., Krones AG, KUKA AG, MMCI Automation, Okura Yusoki Co. Ltd., Schneider Packaging, Serpa Packaging Solutions, Staubli International, Universal Robots AS and Yaskawa Electric Corp.
-
Market Research Insights
- Modern supply chains are leveraging automated palletizing solutions to achieve unprecedented production efficiency. Within fulfillment centers and distribution centers, these warehouse automation technologies are central to supply chain optimization and e-commerce fulfillment. The focus on manufacturing resilience and operational continuity drives investment in end-of-line packaging and broader end-of-line automation.
- This includes robotic system integration within smart factory concepts, often as turnkey palletizing systems. Workforce optimization is a key benefit, as automation handles high-volume production and heavy-duty palletizing operations. Advanced manufacturing technologies, such as goods-to-person mobile robots, work in concert with palletizers for seamless logistics automation.
- This is seen across food and beverage packaging lines, pharmaceutical packaging machinery, automotive component manufacturing, and omnichannel retail, where system uptime is improved by over 20% compared to non-automated lines.
We can help! Our analysts can customize this robotic palletizer market research report to meet your requirements.
 RIA -
RIA - 
