Salts And Flavored Salts Market Size 2024-2028
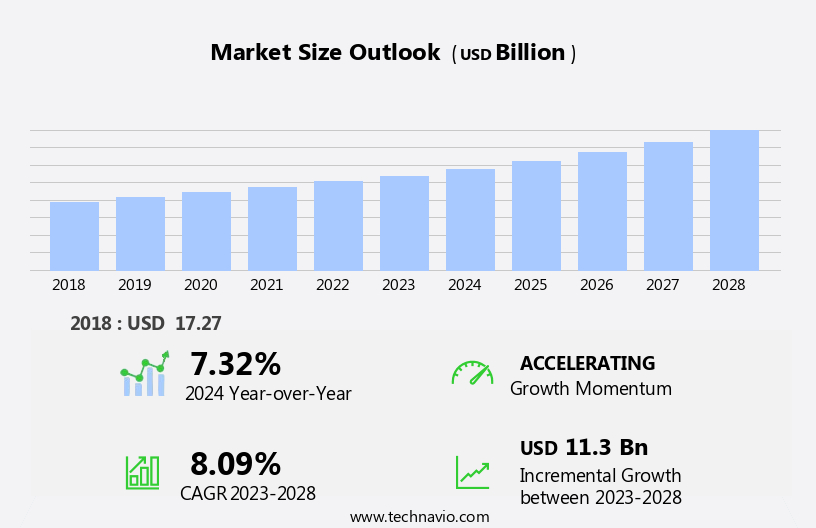
The salts and flavored salts market size is forecast to increase by USD 11.3 billion at a CAGR of 8.09% between 2023 and 2028.
- The market is experiencing significant growth, driven by the increasing popularity of flavored salts as a culinary trend and the expanding consumer base seeking healthier alternatives. The market's dynamics are shaped by several key factors. Firstly, the growing influence of online retailing is fueling market expansion, as consumers increasingly turn to e-commerce platforms for convenience and a wider range of options. Secondly, health risks and diseases related to excessive salt and sodium intake are driving demand for flavored salts, which offer enhanced taste without the added sodium. However, market growth is not without challenges. Regulations and consumer awareness regarding the health implications of salt consumption continue to evolve, posing potential risks for market players.
- Companies seeking to capitalize on market opportunities must stay abreast of these trends and regulatory developments while also focusing on product innovation and sustainable sourcing to meet evolving consumer preferences. By adopting a strategic approach to market dynamics, players can navigate challenges and capitalize on the growing demand for flavored salts.
What will be the Size of the Salts And Flavored Salts Market during the forecast period?
- The market encompasses a wide range of products, including table salt, seasoned salt, garlic salt, truffle salt, smoked salt, and various herb and spice blends. Consumers' increasing focus on nutritional benefits and clean-label products has driven growth in the market for flavored salts, which offer enhanced flavor without artificial additives. The market's size is significant, with applications spanning various industries, from packaged foods and beverages to the foodservice sector, including the meat and fish industries, fast food chains, and savory product manufacturers. Consumer eating habits continue to evolve, with a growing preference for natural and minimally processed foods.
- As a result, the market for salts and flavored salts is expected to maintain a positive growth trajectory, with trends including the use of herbs and spices, natural food products, and soluble salts in a variety of applications, from salads and sauces to semi-processed food products. The market's direction is influenced by Western culture's savory palate, with jalapeno salt and other flavored salts gaining popularity as seasoning options for a diverse range of dishes.
How is this Salts And Flavored Salts Industry segmented?
The salts and flavored salts industry research report provides comprehensive data (region-wise segment analysis), with forecasts and estimates in "USD billion" for the period 2024-2028, as well as historical data from 2018-2022 for the following segments.
- Distribution Channel
- Offline
- Online
- End-user
- Food and beverages industry
- Food service industry/quick service restaurants
- Household
- Geography
- North America
- US
- Europe
- France
- Germany
- APAC
- China
- India
- South America
- Middle East and Africa
- North America
By Distribution Channel Insights
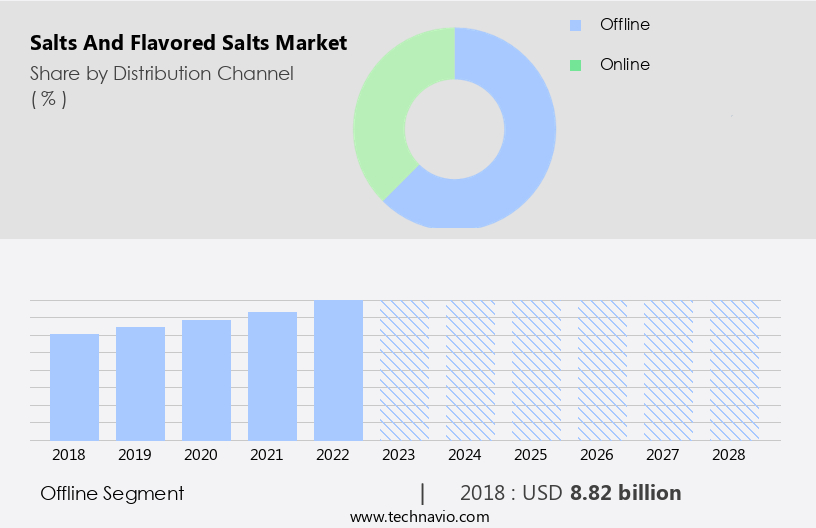
The offline segment is estimated to witness significant growth during the forecast period.
The market encompasses organic food ingredients, such as Himalayan salt and various herbs, which add nutritional value and unique flavors to semi-processed food products, packaged foods, salads, meat, and more. Free-form labels and clean labels are increasingly preferred by consumers, aligning with Western culture's emphasis on healthy alternatives and allergen avoidance. The market includes gourmet salts like smoked salt, seasoned salt, and garlic salt, as well as savory products like jalapeno salt and onion salt. Government interventions and consumer eating habits have led to the use of sodium reduction ingredients like potassium chloride, magnesium sulfate, and potassium lactate.
The fast food industry and food service restaurants are significant consumers, while beverages and sauces also contribute to the market's growth. The market offers high-quality, cost-effective products, including organic flavored salts and mineral-rich options like truffle salt. Herbs and spices, such as garlic, ginger, chili, and lemon, add flavor without preservatives, appealing to consumers seeking natural food products. The market is influenced by social media marketing and commercialization of clean-label products. The semi-processed food segment, including grilled vegetables, fish, and meat, benefits from the addition of flavored salts, extending their shelf life and enhancing their nutritional benefits. The market caters to various consumer preferences, including those for Italian, French, and other foreign cuisines.
The market's growth is driven by the increasing popularity of healthy lifestyles, private company interventions, and the influence of Westernization trends on flavor combinations.
Get a glance at the market report of share of various segments Request Free Sample
The Offline segment was valued at USD 8.82 billion in 2018 and showed a gradual increase during the forecast period.
Regional Analysis
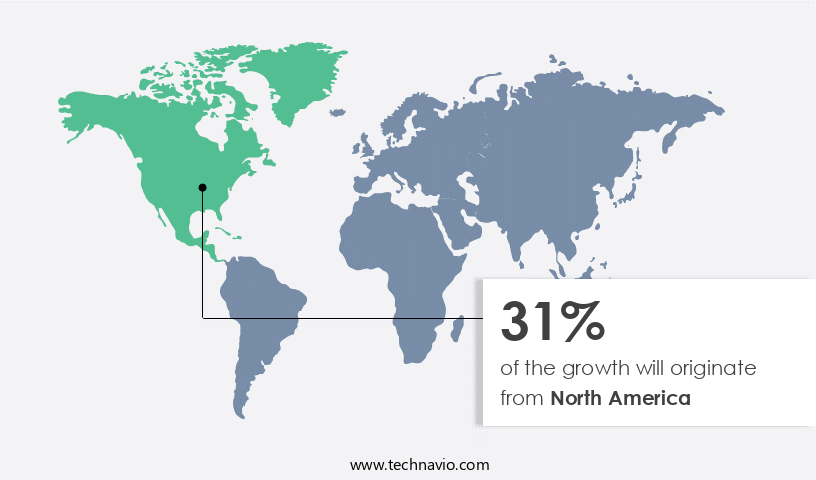
North America is estimated to contribute 31% to the growth of the global market during the forecast period.Technavio’s analysts have elaborately explained the regional trends and drivers that shape the market during the forecast period.
For more insights on the market size of various regions, Request Free Sample
The market in North America, specifically in the US and Canada, has witnessed significant growth due to the increasing consumption of organic food ingredients and semi-processed food products. Consumers' preference for nutritional value and clean labels in packaged foods, such as salads, meat, and grilled vegetables, has fueled the demand for flavored salts. Himalayan salt and gourmet salts, including garlic salt, onion salt, and chili salt, are popular choices for adding flavor without preservatives. The market is also driven by the meat industry and food service restaurants, which use flavored salts as sodium reduction ingredients, such as potassium chloride and magnesium sulfate.
Start-ups and established brands offer a range of flavored salts, from savory seasoning blends to exotic indulgences like truffle salt and jalapeno salt. Consumer eating habits, influenced by Western culture and foreign cuisines, have led to the commercialization of various flavor combinations. The market's growth is further supported by the fast food industry's adoption of flavored salts in their menu items. The market's future prospects are promising, with opportunities in the production of fiber-rich, vitamin-enriched, and gluten-free flavored salts, as well as the development of natural food products with extended shelf life. The market's growth is also influenced by government interventions aimed at reducing sodium intake and promoting healthy alternatives to table salt.
Social media marketing and promotional activities play a crucial role in increasing consumer awareness and demand for flavored salts.
Market Dynamics
Our researchers analyzed the data with 2023 as the base year, along with the key drivers, trends, and challenges. A holistic analysis of drivers will help companies refine their marketing strategies to gain a competitive advantage.
What are the key market drivers leading to the rise in the adoption of Salts And Flavored Salts Industry?
- Strategies adopted by leading players is the key driver of the market.
- The market is characterized by intense competition among companies. To gain regulatory approval, such as from the US Food and Drug Administration (FDA), is a significant focus for market participants. New product launches are a common strategy employed by companies to differentiate themselves and cater to evolving consumer preferences. Strategic collaborations, partnerships, mergers and acquisitions (M&A), and expansion projects are also utilized to enhance market presence and tackle competition.
- The market's competitiveness is anticipated to drive established companies to form alliances and strengthen their positions.
What are the market trends shaping the Salts And Flavored Salts Industry?
- Growing influence of online retailing is the upcoming market trend.
- E-commerce retail has witnessed significant growth, accounting for approximately 19% of global retail trade in 2023. This channel caters to both business-to-business (B2B) and business-to-consumer (B2C) transactions. The increasing trend of online shopping is driven by the rise in average online transaction value and the number of digital transactions. The expansion of the Internet user base and the growing preference for convenience are major factors fueling this growth.
- For instance, the UK, with an Internet penetration rate of around 97.8% in 2023, has seen a notable rise in Internet retailing. This trend is expected to continue as more consumers adopt the convenience of online shopping.
What challenges does the Salts And Flavored Salts Industry face during its growth?
- Health risks and diseases related to salt and sodium is a key challenge affecting the industry growth.
- Salt, a common household ingredient, is essential for enhancing food flavor. However, consuming excessive amounts of conventional gourmet salt, which contains a significant amount of sodium chloride, can pose health risks. Sodium intake beyond the recommended limit can lead to increased blood pressure, causing the heart to work harder and potentially resulting in conditions such as stroke, heart failure, stomach cancer, kidney disease, and osteoporosis. When the kidneys are unable to eliminate the excess sodium through urine, it accumulates in the interstitial fluid, increasing both water and blood volume, and putting additional strain on the heart and blood vessels. As per , the market for flavored salts is gaining traction as consumers seek healthier alternatives to conventional salt.
- These salts, infused with various herbs, spices, or fruits, offer a burst of flavor while reducing the sodium intake. This market trend is driven by growing health consciousness and the desire for gourmet and exotic taste experiences.
Exclusive Customer Landscape
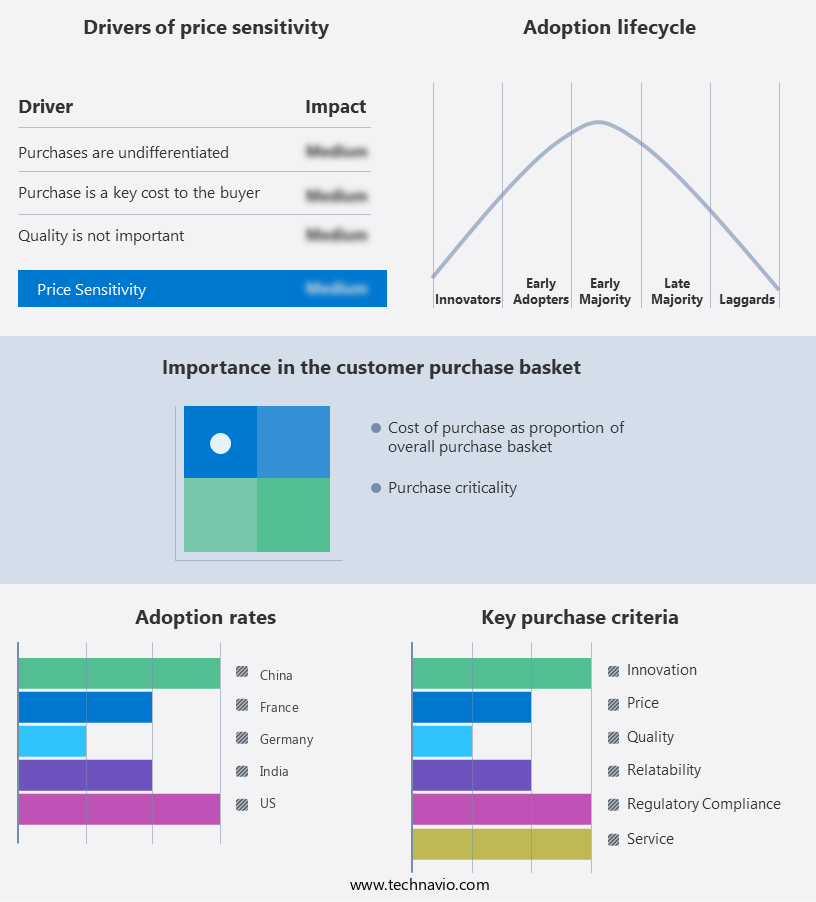
The salts and flavored salts market forecasting report includes the adoption lifecycle of the market, covering from the innovator’s stage to the laggard’s stage. It focuses on adoption rates in different regions based on penetration. Furthermore, the salts and flavored salts market report also includes key purchase criteria and drivers of price sensitivity to help companies evaluate and develop their market growth analysis strategies.
Customer Landscape
Key Companies & Market Insights
Companies are implementing various strategies, such as strategic alliances, salts and flavored salts market forecast, partnerships, mergers and acquisitions, geographical expansion, and product/service launches, to enhance their presence in the industry.
Ajinomoto Co. Inc. - The company specializes in providing a diverse range of salts and flavored salts, including raw and edible varieties, as well as industrial options. Our product offerings cater to various industries and applications, ensuring high-quality and consistency. From enhancing food flavors to contributing to industrial processes, our salts deliver exceptional value.
The industry research and growth report includes detailed analyses of the competitive landscape of the market and information about key companies, including:
- Ajinomoto Co. Inc.
- Amagansett Sea Salt Co.
- Cornish Sea Salt Co. Ltd.
- El Nasr Salines Co.
- HimalaSalt
- Himalayan chef
- Hoosier Hill Farm LLC
- INFOSA
- ITC Ltd.
- KS Aktiengesellschaft
- McCormick and Co. Inc.
- Olde Thompson
- Red Monkey Foods Inc.
- SaltWorks Inc.
- Suprasel
- Tata Sons Pvt. Ltd.
- Twang Partners LLC
- United Salt Corp.
- Vancouver Island Salt Co.
- Verlag A.Vogel AG
Qualitative and quantitative analysis of companies has been conducted to help clients understand the wider business environment as well as the strengths and weaknesses of key industry players. Data is qualitatively analyzed to categorize companies as pure play, category-focused, industry-focused, and diversified; it is quantitatively analyzed to categorize companies as dominant, leading, strong, tentative, and weak.
Research Analyst Overview
The market for salts and flavored salts continues to experience significant growth, driven by the increasing demand for organic food ingredients and the shift towards semi-processed food products. Consumers' preference for free-form labels and cleaner, more natural food products has led to an influx of new entrants, particularly start-ups, in the market. Salt, a fundamental ingredient in various food applications, has evolved beyond its traditional role as a simple seasoning. The introduction of flavored salts, which infuse salts with herbs, spices, and other natural flavors, has expanded the product offerings in the market. Himalayan salt, with its unique mineral content and distinct flavor, has gained popularity among consumers seeking healthier and more natural alternatives to normal table salt.
The nutritional value of salts and flavored salts extends beyond their role as seasonings. Some salts, such as those infused with minerals like magnesium sulfate, calcium chloride, and potassium lactate, offer additional health benefits. These salts are increasingly being used in the food service industry, where they cater to consumers' growing demand for high-quality, nutritious food options. The market for savory products, including salads, meat, fish, and grilled vegetables, is a significant contributor to the growth of the market. Consumers are increasingly seeking out gourmet salts and flavored salts to add depth and complexity to their dishes, creating opportunities for innovation and differentiation.
The fast food industry, too, has embraced the trend towards flavored salts, with many brands offering their unique blends as part of their menu. However, the market is not without its challenges. Consumer eating habits and preferences continue to evolve, with an increasing focus on fiber, vitamins, and healthy lifestyles. This has led to the development of sodium reduction ingredients and the commercialization of low-sodium and no-sodium salt alternatives. The market for flavored salts is also influenced by government interventions and Westernization trends. In some regions, there are regulations limiting the use of certain ingredients, such as preservatives, in food products.
This has led to the development of natural food products and the adoption of clean labels. Additionally, Westernization trends have led to the popularity of foreign cuisines, such as Italian and French, which often feature unique and exotic flavor combinations. The market for salts and flavored salts is highly competitive, with a diverse range of players, from large multinational corporations to small start-ups. Social media marketing and promotional activities have become essential tools for companies looking to reach consumers and build brand awareness. The market is expected to continue growing, driven by consumer preferences for healthier, more natural food options and the ongoing trend towards gourmet and exotic indulgences.
|
Market Scope |
|
|
Report Coverage |
Details |
|
Page number |
168 |
|
Base year |
2023 |
|
Historic period |
2018-2022 |
|
Forecast period |
2024-2028 |
|
Growth momentum & CAGR |
Accelerate at a CAGR of 8.09% |
|
Market growth 2024-2028 |
USD 11.3 billion |
|
Market structure |
Fragmented |
|
YoY growth 2023-2024(%) |
7.32 |
|
Key countries |
US, Germany, China, India, and France |
|
Competitive landscape |
Leading Companies, Market Positioning of Companies, Competitive Strategies, and Industry Risks |
What are the Key Data Covered in this Salts And Flavored Salts Market Research and Growth Report?
- CAGR of the Salts And Flavored Salts industry during the forecast period
- Detailed information on factors that will drive the growth and forecasting between 2024 and 2028
- Precise estimation of the size of the market and its contribution of the industry in focus to the parent market
- Accurate predictions about upcoming growth and trends and changes in consumer behaviour
- Growth of the market across North America, Europe, APAC, South America, and Middle East and Africa
- Thorough analysis of the market’s competitive landscape and detailed information about companies
- Comprehensive analysis of factors that will challenge the salts and flavored salts market growth of industry companies
We can help! Our analysts can customize this salts and flavored salts market research report to meet your requirements.
 RIA -
RIA - 
