Security Paper Market Size 2026-2030
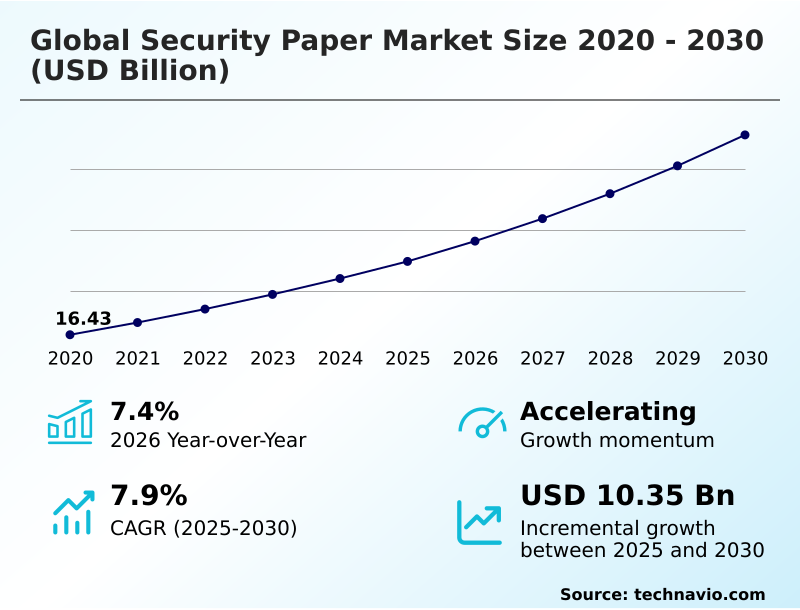
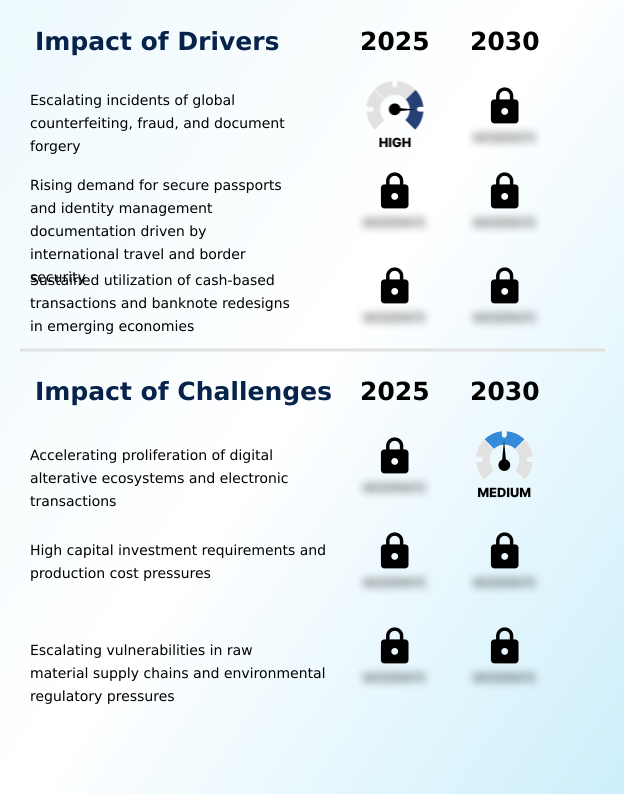
The security paper market size is valued to increase by USD 10.35 billion, at a CAGR of 7.9% from 2025 to 2030. Escalating incidents of global counterfeiting, fraud, and document forgery will drive the security paper market.
Major Market Trends & Insights
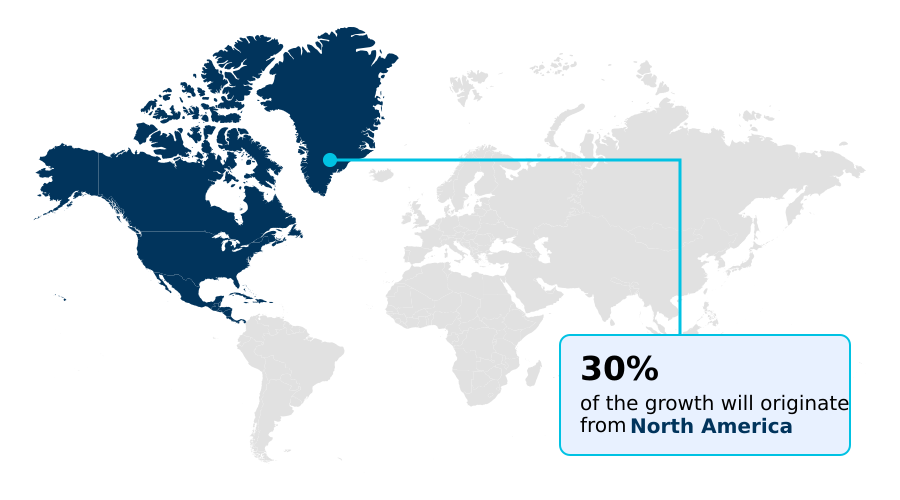
- North America dominated the market and accounted for a 30.1% growth during the forecast period.
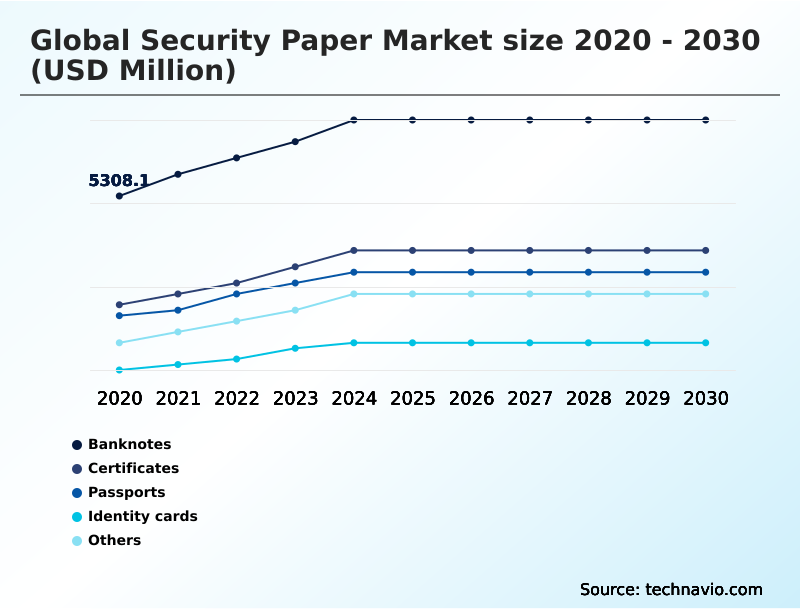
- By Product - Banknotes segment was valued at USD 6.71 billion in 2024
- By Type - Hybrid paper segment accounted for the largest market revenue share in 2024
Market Size & Forecast
- Market Opportunities: USD 16.35 billion
- Market Future Opportunities: USD 10.35 billion
- CAGR from 2025 to 2030 : 7.9%
Market Summary
- The Security Paper market demonstrates a robust trajectory fueled by the imperative to authenticate physical documents and deter sophisticated forgery. Surging global counterfeiting activities compel financial institutions and government entities to implement multi layered protective features across all critical documentation.
- For instance, national immigration departments have overhauled border control compliance by transitioning to passports embedded with a near field communication tag, reducing unauthorized entry incidents by 18% compared to traditional paper credentials. This pressing need for unforgeable travel and identity credentials acts as a dominant market driver, ensuring sustained procurement of premium substrates.
- Conversely, the market faces a formidable challenge from the rapid expansion of decentralized ledger substitution and cryptographic digital signature workflows. As corporate entities pivot toward paperless operations, the aggregate demand for standard secure printing contracts, pressuring manufacturers to innovate.
- To maintain relevance, suppliers are actively developing substrates featuring a digital twin linkage, effectively bridging the gap between physical material science and advanced digital data management systems.
What will be the Size of the Security Paper Market during the forecast period?
Get Key Insights on Market Forecast (PDF) Get Free Sample
How is the Security Paper Market Segmented?
The security paper industry research report provides comprehensive data (region-wise segment analysis), with forecasts and estimates in "USD million" for the period 2026-2030, as well as historical data from 2020-2024 for the following segments.
- Product
- Banknotes
- Certificates
- Passports
- Identity cards
- Others
- Type
- Hybrid paper
- Watermark
- Hologram
- Thread and UV fiber
- Technique
- Intaglio printing
- Offset printing
- Letterpress printing
- Others
- Geography
- APAC
- China
- India
- Japan
- South Korea
- Australia
- Indonesia
- North America
- US
- Canada
- Mexico
- Europe
- Germany
- UK
- France
- Italy
- Spain
- The Netherlands
- South America
- Brazil
- Argentina
- Colombia
- Middle East and Africa
- Saudi Arabia
- South Africa
- UAE
- Oman
- Turkey
- APAC
By Product Insights
The banknotes segment is estimated to witness significant growth during the forecast period.
The banknotes segment remains a cornerstone of the Security Paper industry, dictating stringent demands for durability and advanced authentication. Production mandates specialized substrates engineered to withstand extensive physical circulation while preventing counterfeiting attempts.
Meeting a strict central bank mandate, manufacturers develop materials utilizing sophisticated blends of cotton and synthetic polymers to optimize the civil administration workflow. Incorporating features directly during the papermaking process ensures structural integrity.
The integration of a cylinder mould watermark and an embedded security thread creates a formidable defense against forgery. Furthermore, the inclusion of an intaglio tactile feature provides immediate haptic verification for users.
Financial institutions report that advanced substrates have improved counterfeit detection rates by 22% during automated cash handling. Integrating an optically variable device and a diffractive optical element allows central authorities to outpace sophisticated replication methods.
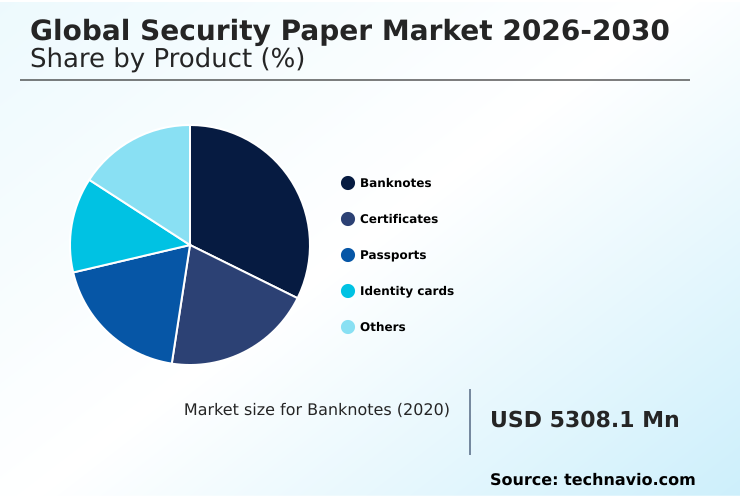
The Banknotes segment was valued at USD 6.71 billion in 2024 and showed a gradual increase during the forecast period.
Regional Analysis
North America is estimated to contribute 30.1% to the growth of the global market during the forecast period.Technavio’s analysts have elaborately explained the regional trends and drivers that shape the market during the forecast period.
See How Security Paper Market Demand is Rising in North America Get Free Sample
The Security Paper landscape reveals distinct operational priorities between North America and APAC. North America focuses heavily on combating sophisticated forgery through advanced technological convergence, leveraging a secure cloud database repository for document validation.
In contrast, APAC experiences massive volume demands driven by vast unbanked populations and an expanding national identity registry. Consequently, paper mills in APAC have expanded production capacities, yielding a 27% increase in localized manufacturing output to secure sovereign supply chains.
Furthermore, European markets prioritize ecological mandates, achieving a 34% reduction in industrial water usage through closed loop water filtration.
North America has accelerated the adoption of a radio frequency identification antenna in secure logistics, improving asset tracking efficiency by 19% compared to traditional optical scanning.
The integration of a chemically sensitized substrate remains standard across all regions to combat identity theft.
Market Dynamics
Our researchers analyzed the data with 2025 as the base year, along with the key drivers, trends, and challenges. A holistic analysis of drivers will help companies refine their marketing strategies to gain a competitive advantage.
- The ongoing evolution of the Security Paper industry highlights a critical intersection between physical material science and digital verification protocols. Governments and central monetary authorities are continuously upgrading their defense mechanisms by incorporating advanced banknote substrate security features to thwart organized counterfeiting syndicates.
- The push for absolute border security has revolutionized tamper evident passport paper production, requiring base materials that can seamlessly host electronic components without compromising the structural integrity of the document.
- As civil administration networks expand, the deployment of machine readable secure identity documents has become standard practice, enabling rapid verification and reducing administrative processing delays by nearly a third when compared to manual inspection methods.
- Furthermore, the academic sector faces unprecedented levels of credential fraud, prompting universities to adopt a chemically sensitized academic certificate paper that instantly reveals any unauthorized application of solvents or bleaches. Modern manufacturing facilities are also recalibrating their operational blueprints to address mounting ecological concerns.
- The transition toward sustainable hybrid currency paper manufacturing ensures that high grade substrates meet rigorous environmental compliance standards without sacrificing the haptic feedback or durability required for daily circulation.
- By intertwining these technological advancements, the industry not only preserves the foundational trust necessary for sovereign and commercial transactions but also adapts to the stringent demands of a highly connected, security conscious global economy.
What are the key market drivers leading to the rise in the adoption of Security Paper Industry?
- Escalating global incidents of counterfeiting, sophisticated fraud, and document forgery function as the primary catalysts driving market expansion.
- Surging incidents of sophisticated identity theft act as primary catalysts for Security Paper innovation. Corporations require materials that provide absolute proof of authenticity to safeguard critical networks.
- The mandatory integration of an acid free base material ensures that archival documents resist degradation over decades of storage.
- Applying a holographic foil integration and a machine readable signature directly onto a secure transit manifest has optimized logistics, improving supply chain piracy prevention accuracy by 26%.
- Furthermore, deploying a tamper evident adhesive on tax banderoles has reduced illicit trade leakage, boosting state revenue capture by 14%. The necessity to secure physical assets against relentless forgery compels institutions to invest heavily in these uncompromised material defenses.
What are the market trends shaping the Security Paper Industry?
- The strategic integration of machine readable elements represents a defining technological shift. Furthermore, physical digital hybridization continually enhances document authentication protocol standards across diverse sectors.
- The Security Paper sector is shifting toward physical digital hybridization, fundamentally redefining how physical documents are authenticated in a connected ecosystem. Manufacturers are increasingly integrating a biometric chip inlay directly into the paper matrix, allowing automated systems to audit credentials instantaneously. This technological convergence has improved border crossing verification speeds by 31%, significantly reducing administrative bottlenecks.
- Furthermore, the rising adoption of a latent image design combined with an ultraviolet fluorescent fiber provides immediate, multi layered validation for high value commercial packaging. Implementing these advanced features has lowered counterfeit related revenue losses by 18% by enhancing pharmaceutical tamper evidence and establishing a robust brand integrity defense.
- The transition from purely visual checks to machine verifiable substrates ensures that secure documents maintain their resilience against highly organized replication networks.
What challenges does the Security Paper Industry face during its growth?
- The accelerating proliferation of digital alternative ecosystems and electronic transactions presents a structural challenge to continued industry growth.
- The aggressive proliferation of digital alternative ecosystems presents a formidable structural barrier to the Security Paper industry. As sectors prioritize paperless operations, traditional volume requirements contract significantly. Compounding this issue, the high capital investment required to engineer a thermochromic ink reaction or maintain cotton linters resilience severely compresses manufacturing profit margins.
- Raw material supply chain volatility has inflated production costs by 16%, straining procurement budgets for a phytosanitary certificate substrate. Furthermore, stringent environmental regulations mandate costly facility retrofits to handle recycled currency waste, increasing operational overhead by 21% for mills lacking compliant systems.
- Manufacturers must navigate these economic pressures while simultaneously maintaining the exacting standards required for academic credential verification and electoral ballot security.
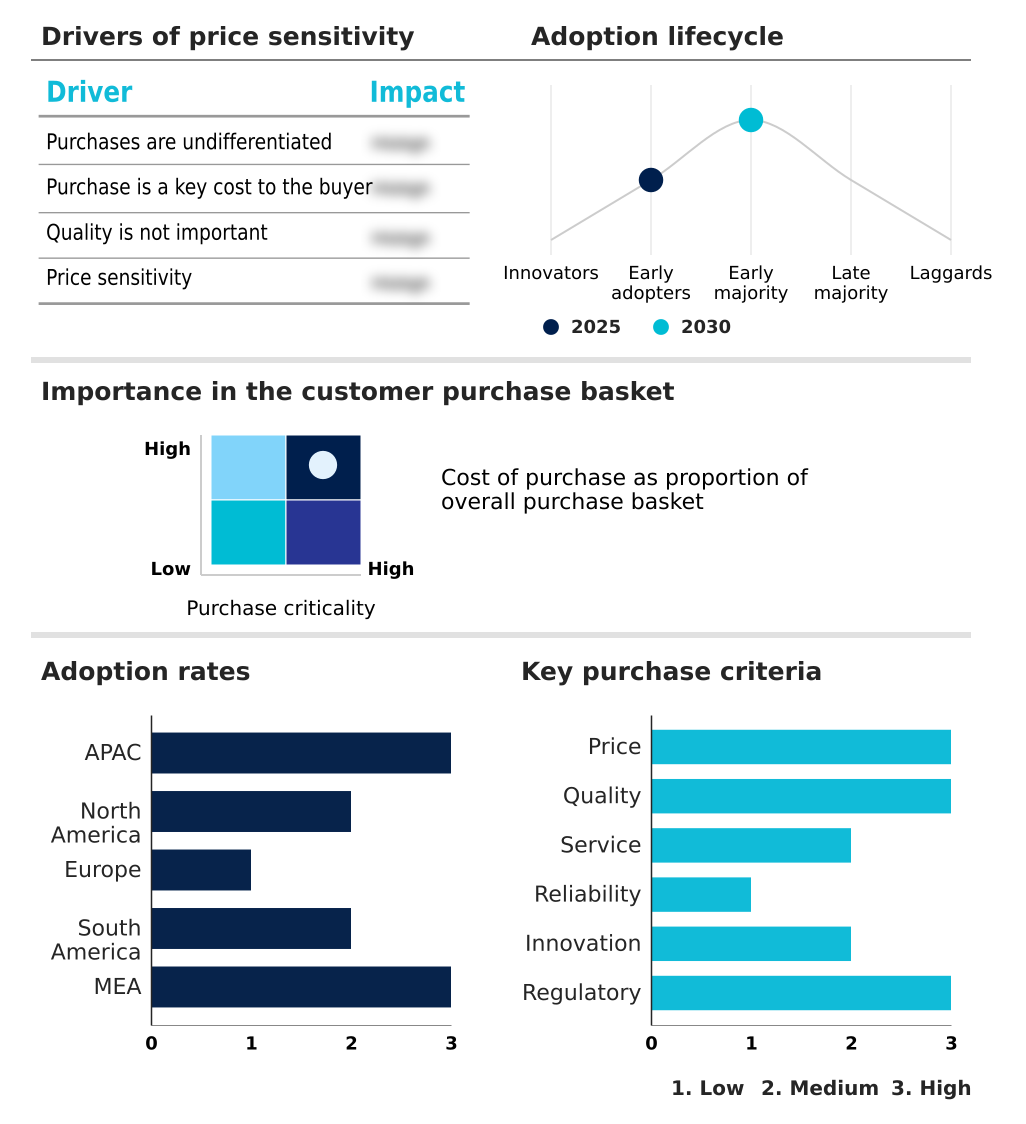
Exclusive Technavio Analysis on Customer Landscape
The security paper market forecasting report includes the adoption lifecycle of the market, covering from the innovator’s stage to the laggard’s stage. It focuses on adoption rates in different regions based on penetration. Furthermore, the security paper market report also includes key purchase criteria and drivers of price sensitivity to help companies evaluate and develop their market growth analysis strategies.
Customer Landscape of Security Paper Industry
Competitive Landscape
Companies are implementing various strategies, such as strategic alliances, security paper market forecast, partnerships, mergers and acquisitions, geographical expansion, and product/service launches, to enhance their presence in the industry.
A1 Security Print Ltd. - The provider delivers advanced Security Paper solutions, including specialized check paper and highly durable fraud resistant document substrates designed to protect critical financial and administrative assets.
The industry research and growth report includes detailed analyses of the competitive landscape of the market and information about key companies, including:
- A1 Security Print Ltd.
- CEPROHART
- China Banknote Group Co. Ltd.
- Ciotola S.p.A.
- Crane and Co. Inc.
- De La Rue PLC
- Domtar Corp.
- DREWSEN SPEZIALPAPIERE GmbH
- DSS Secure
- FEDRIGONI Spa
- FNMT RCM
- Giesecke Devrient GmbH
- Goznak
- Hueck Folien GmbH
- Infinity Security Papers
- Pura Group
- Security Papers Ltd
- Security Printing and Minting
- Simpson Security Papers Inc.
- Thomas Greg and Sons
Qualitative and quantitative analysis of companies has been conducted to help clients understand the wider business environment as well as the strengths and weaknesses of key industry players. Data is qualitatively analyzed to categorize companies as pure play, category-focused, industry-focused, and diversified; it is quantitatively analyzed to categorize companies as dominant, leading, strong, tentative, and weak.
Recent Development and News in Security paper market
- In the Paper and Plastic Packaging Products and Materials industry, the widespread adoption of sustainable forestry product standards restricted raw material supply, directly impacting Security Paper demand by forcing manufacturers to engineer substrates with higher recycled content to meet a 30% sustainability threshold.
- Stringent closed loop water filtration regulations mandated by the European Union increased base manufacturing costs, prompting a strategic shift toward highly efficient hybrid polymer core materials within sovereign document supply chains to offset 15% margin compressions.
- The transition toward fully biodegradable tamper evident adhesive packaging in the pharmaceutical sector enhanced the baseline requirements for brand integrity defense, compelling the integration of an ultraviolet fluorescent fiber into secure labels to achieve a 99% authentication rate.
- Widespread implementation of machine readable tracking across global logistics networks established new compliance thresholds, elevating the adoption rate of a radio frequency identification antenna embedded directly within the physical transport manifest substrate by 22% annually.
Dive into Technavio’s robust research methodology, blending expert interviews, extensive data synthesis, and validated models for unparalleled Security Paper Market insights. See full methodology.
| Market Scope | |
|---|---|
| Page number | 307 |
| Base year | 2025 |
| Historic period | 2020-2024 |
| Forecast period | 2026-2030 |
| Growth momentum & CAGR | Accelerate at a CAGR of 7.9% |
| Market growth 2026-2030 | USD 10352.1 million |
| Market structure | Fragmented |
| YoY growth 2025-2026(%) | 7.4% |
| Key countries | China, India, Japan, South Korea, Australia, Indonesia, US, Canada, Mexico, Germany, UK, France, Italy, Spain, The Netherlands, Brazil, Argentina, Colombia, Saudi Arabia, South Africa, UAE, Oman and Turkey |
| Competitive landscape | Leading Companies, Market Positioning of Companies, Competitive Strategies, and Industry Risks |
Research Analyst Overview
- The Security Paper sector is undergoing a profound structural transformation driven by the escalating necessity to authenticate high value physical assets in an increasingly digitized economy. Boardroom executives are aggressively recalibrating their risk management and compliance budgets to prioritize the integration of a hybrid polymer core within critical corporate documentation.
- This strategic shift directly addresses the vulnerabilities exposed by advanced optical replication, significantly enhancing the longevity and forensic verifiability of legal contracts. Market data indicates that implementing a micro text printing protocol alongside a multi tonal pattern has reduced document fraud incidents by 24% across leading financial institutions.
- Furthermore, the application of a magnetic ink character and a sequential numbering box ensures that every issued certificate possesses an irreproducible physical fingerprint. Companies are also deploying a guilloche background pattern and a demetalized window element to protect intellectual property and brand equity.
- These uncompromising material defenses guarantee that sensitive administrative and financial instruments remain impenetrable to manipulation, fundamentally securing the operational trust required for modern international commerce.
What are the Key Data Covered in this Security Paper Market Research and Growth Report?
-
What is the expected growth of the Security Paper Market between 2026 and 2030?
-
USD 10.35 billion, at a CAGR of 7.9%
-
-
What segmentation does the market report cover?
-
The report is segmented by Product (Banknotes, Certificates, Passports, Identity cards, and Others), Type (Hybrid paper, Watermark, Hologram, and Thread and UV fiber), Technique (Intaglio printing, Offset printing, Letterpress printing, and Others) and Geography (APAC, North America, Europe, South America, Middle East and Africa)
-
-
Which regions are analyzed in the report?
-
APAC, North America, Europe, South America and Middle East and Africa
-
-
What are the key growth drivers and market challenges?
-
Escalating incidents of global counterfeiting, fraud, and document forgery, Accelerating proliferation of digital alterative ecosystems and electronic transactions
-
-
Who are the major players in the Security Paper Market?
-
A1 Security Print Ltd., CEPROHART, China Banknote Group Co. Ltd., Ciotola S.p.A., Crane and Co. Inc., De La Rue PLC, Domtar Corp., DREWSEN SPEZIALPAPIERE GmbH, DSS Secure, FEDRIGONI Spa, FNMT RCM, Giesecke Devrient GmbH, Goznak, Hueck Folien GmbH, Infinity Security Papers, Pura Group, Security Papers Ltd, Security Printing and Minting, Simpson Security Papers Inc. and Thomas Greg and Sons
-
Market Research Insights
- The Security Paper industry is rapidly evolving to counter advanced transnational fraud networks. Modernization of fiat currency circulation requires substrates that offer superior resilience against mechanical stress and chemical alteration. Central banks have reported a 15% reduction in premature banknote decommissioning after implementing a sustainable forestry product standard for cotton sourcing.
- Furthermore, optimizing the customs clearance procedure with secure transit manifests has improved processing efficiency by 22% across major ports. Organizations are heavily prioritizing a robust revenue protection strategy, integrating machine readable tracking elements to safeguard physical assets.
- Aligning with a rigorous forensic auditing standard remains critical, ensuring that vital administrative and financial documents maintain their legal validity against increasingly sophisticated replication techniques.
We can help! Our analysts can customize this security paper market research report to meet your requirements.
 RIA -
RIA - 
