
Smart Office Furniture Market Size 2024-2028
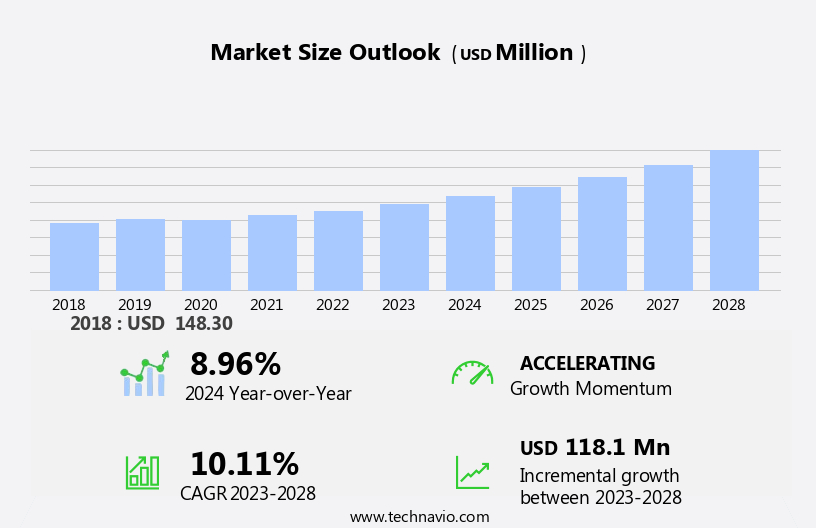
The smart office furniture market size is forecast to increase by USD 118.1 million at a CAGR of 10.11% between 2023 and 2028. The market is experiencing significant growth due to the increasing trend of remote work and the need for flexible home environments. Home automation technology and the smart home ecosystem are key drivers, enabling user-friendly, energy-efficient, and eco-friendly living in modern workspaces. Developments in connectivity technologies are facilitating seamless integration of furniture with other smart devices, enhancing productivity and convenience. However, interoperability issues pose a challenge, requiring standardization and collaboration among manufacturers and technology providers to ensure compatibility and seamless integration. Overall, the market offers numerous benefits, including improved workspace design, increased efficiency, and enhanced user experience.
The smart office furniture market is rapidly evolving, driven by the growing demand for tech-savvy workspaces. Smart chairs and smart tables are revolutionizing how professionals work from home, offering features like adjustable heights, lumbar support, and built-in sensors for ergonomic comfort. As work from home professionals seek greater efficiency, these innovative solutions provide personalized comfort and productivity. The rise of voice-activated virtual assistants further enhances the smart office experience, allowing users to control lighting, temperature, and tasks hands-free. In urban areas, where space is often limited, these intelligent furniture pieces combine functionality with style, optimizing home office setups. The smart table segment continues to gain traction, as professionals demand multifunctional workstations that seamlessly integrate with their digital needs.
Market Segmentation
The market research report provides comprehensive data (region-wise segment analysis), with forecasts and estimates in "USD million" for the period 2024-2028, as well as historical data from 2018-2022 for the following segments.
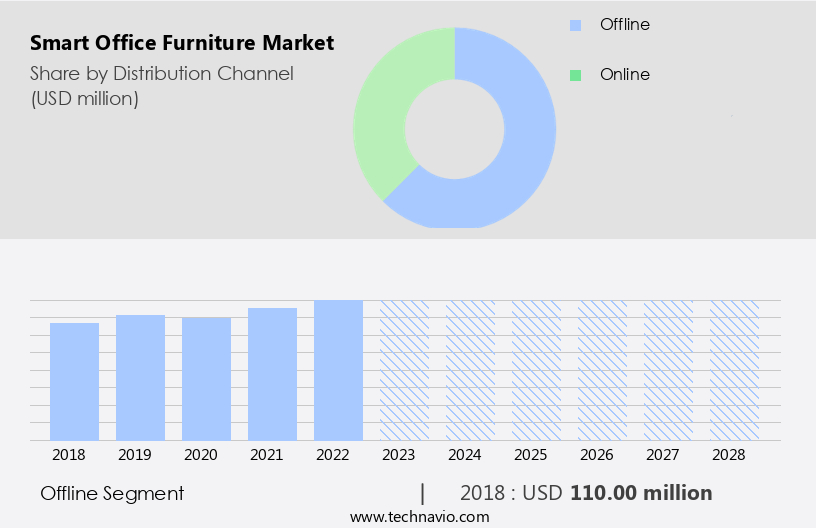
- Distribution Channel
- Offline
- Online
- Product
- Smart tables desks and storage
- Smart seating benches and stools
- Geography
- North America
- Canada
- US
- Europe
- Germany
- France
- APAC
- China
- South America
- Middle East and Africa
- North America
By Distribution Channel Insights
The offline segment is estimated to witness significant growth during the forecast period. The market in the United States is witnessing significant growth due to the increasing demand for luxurious products in the commercial sector. Office construction and improvement activity are driving the market, with a focus on open floor plans and collaborative work areas. The smart desks sector is also experiencing a wave in demand, as businesses prioritize product longevity and replacement activity. The offline distribution channel plays a crucial role in catering to this demand. This segment includes direct sales, dealers, distributors, and retailers. Direct sales, a sub-category within offline distribution, involves the sale of smart office furniture through catalogs, both digital and physical.
End-users benefit from the wide availability of brands and varieties offered through this channel. Additionally, potential buyers can directly engage with companies for product information and selection. Overall, the market in the US continues to expand, with the offline distribution channel providing a vital platform for businesses and consumers to connect and transact.
Get a glance at the market share of various segments Request Free Sample
The offline segment accounted for USD 110.00 million in 2018 and showed a gradual increase during the forecast period.
Regional Insights
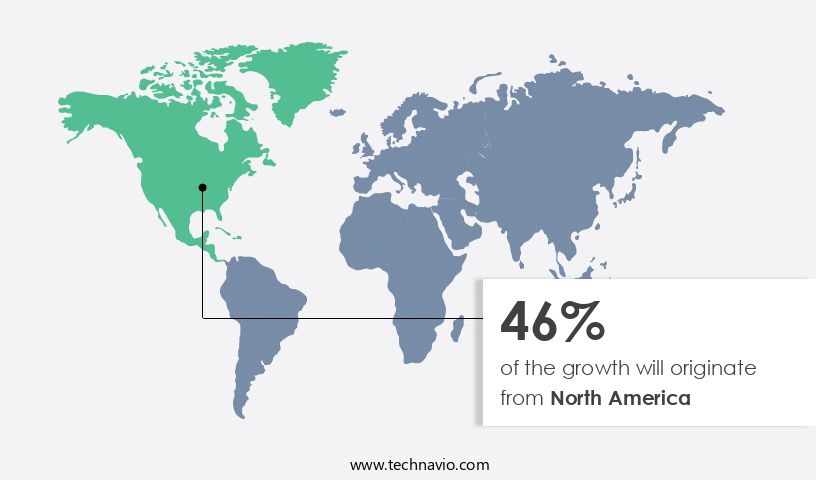
North America is estimated to contribute 46% to the growth of the global market during the forecast period. Technavio's analysts have elaborately explained the regional trends and drivers that shape the market during the forecast period.
For more insights on the market share of various regions Request Free Sample
In North America, the United States, Canada, and Mexico are significant contributors to the expansion of the market. The advanced economies in these countries, coupled with high urbanization, are key drivers for market growth. The increasing disposable income in countries like the US and Canada is anticipated to fuel the demand for high-end and sophisticated office furniture in corporate environments. Favorable macroeconomic conditions are expected to bolster the market's growth in these regions. Employers in North America prioritize the efficient utilization of office spaces, and the installation of smart furniture is becoming increasingly popular to enhance employee well-being. Smart office furniture, equipped with features like remote control via smartphone apps, adjustable settings, environmental sensors, and voice-activated lighting, is gaining traction in both working and recreational spaces. This technology enables users to create personalized settings and optimize their office environments for productivity and comfort.
Our researchers analyzed the data with 2023 as the base year, along with the key drivers, trends, and challenges. A holistic analysis of drivers will help companies refine their marketing strategies to gain a competitive advantage.
Market Driver
Developments in connectivity technologies is the key driver of the market. The market is witnessing significant growth due to the integration of advanced technologies such as climate control systems, wireless chargers, and Bluetooth speakers. These features enhance the aesthetics of intelligent living spaces and offer multiple functions, making them compact and space-saving. Homeowners are increasingly adopting automated home systems, and smart office furniture is a natural extension of this trend.
Major companies in the market, including Steelcase, are incorporating Wi-Fi and IoT connectivity to create smart desks, tables, and chairs. Collaborations with technology companies like Sprint and Ericsson to explore the impact of 5G on offices further demonstrate this trend. The integration of these advanced technologies is expected to positively influence the market's growth during the forecast period.
Market Trends
Increasing online retailing is the upcoming trend in the market. The market refers to the sales and distribution of office furniture through online retail channels. Architects and designers increasingly prefer this mode of purchasing due to its convenience and cost savings. Online retailing enables the buying and selling of office furniture products through various e-commerce models, including business-to-business (B2B), business-to-consumer (B2C), and consumer-to-consumer (C2C). This trend is driven by the widespread use of smartphones and advanced technology devices, which facilitate remote shopping. Online retailing eliminates the need for brick-and-mortar stores, large inventories, and associated labor costs. Instead, it offers retailers increased market reach and visibility, allowing them to target new customer bases globally.
Market Challenge
Increasing interoperability issues is a key challenge affecting the market growth. Smart office furniture is gaining popularity in corporate environments as businesses strive to create comfortable and efficient workspaces for their employees. The global market for smart office furniture is witnessing significant growth as companies innovate to meet the demands of modern businesses. However, selecting the right smart office furniture solution can be a challenge for organizations. Failure to properly understand business requirements and the capabilities of available solutions can lead to ineffective deployments. Integration of smart technology into existing office furniture can also be a complex process due to the need for customization and expertise. To overcome these challenges, it is crucial for organizations to conduct thorough research and partner with companies who can provide user-friendly, energy-efficient, and eco-friendly smart office furniture solutions that seamlessly integrate into the smart home ecosystem.
Exclusive Customer Landscape
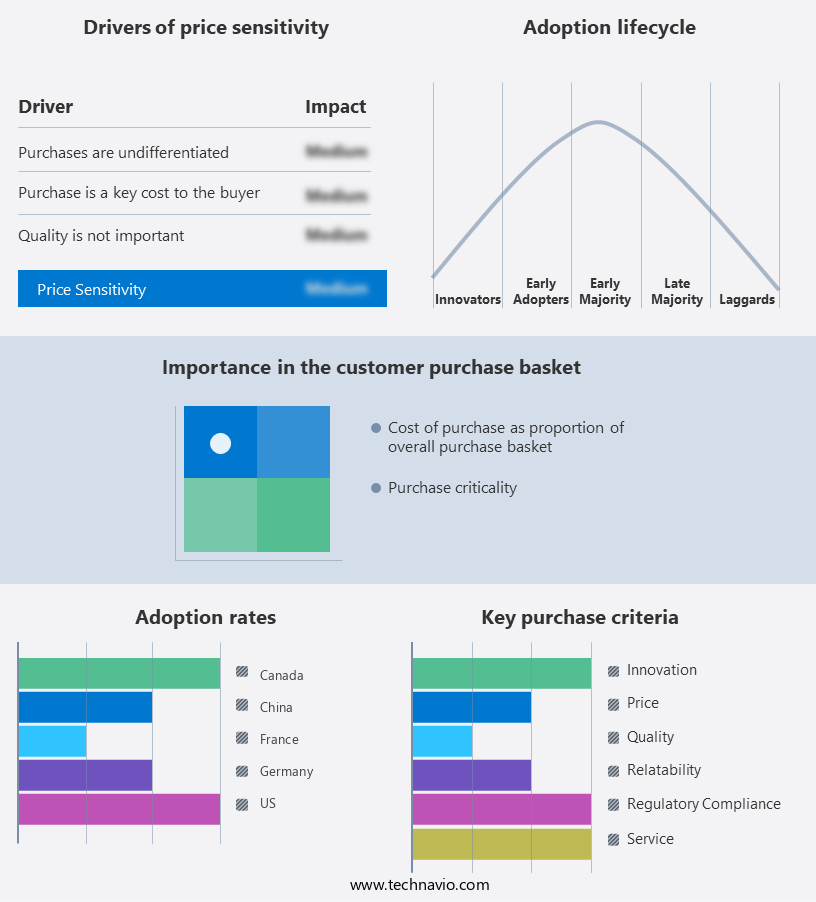
The market forecasting report includes the adoption lifecycle of the market, covering from the innovator's stage to the laggard's stage. It focuses on adoption rates in different regions based on penetration. Furthermore, the report also includes key purchase criteria and drivers of price sensitivity to help companies evaluate and develop their market growth analysis strategies.
Customer Landscape
Key Companies & Market Insights
Companies are implementing various strategies, such as strategic alliances, partnerships, mergers and acquisitions, geographical expansion, and product/service launches, to enhance their presence in the market.
Avnet Inc.: The company offers Smart Office solution that makes it simple, fast, and convenient to find and book a meeting room by simply entering the room with a smartphone.
The market research and growth report includes detailed analyses of the competitive landscape of the market and information about key companies, including:
- Berco Designs
- DEKOM AG
- Featherlite
- GoBright B V
- Haworth Inc.
- Humanscale International Holdings Ltd.
- Interogo Foundation
- Kimball International Inc.
- Kinnarps AB
- KOKUYO Co. Ltd.
- Konig Neurath AG
- Mikomax Sp z o o
- MillerKnoll Inc.
- Nilkamal Ltd.
- Schiavello International
- Smart Furniture LLC
- Steelcase Inc.
- Tabula Sense
- ZHEJIANG SUNON FURNITURE MANUFACTURE CO. LTD
Qualitative and quantitative analysis of companies has been conducted to help clients understand the wider business environment as well as the strengths and weaknesses of key market players. Data is qualitatively analyzed to categorize companies as pure play, category-focused, industry-focused, and diversified; it is quantitatively analyzed to categorize companies as dominant, leading, strong, tentative, and weak.
Research Analyst Overview
The market is witnessing significant growth due to the increasing demand for tech-savvy workspaces in both residential and commercial sectors. In urban regions, the trend towards open floor plans and collaborative work areas is driving the adoption of smart desks, tables, and chairs. These modern furnishings come with embedded technology, connectivity features, and functionality that cater to the needs of professionals and workaholics. The commercial sector, including corporate offices and laboratories, is a major consumer of smart office furniture. Product longevity and replacement activity in this sector are high due to the need for durable and advanced furniture. Smart desks and tables with sensors, intelligent systems, and wireless charging capabilities are popular choices.
Further, home centers and specialty stores are key distribution channels for smart office furniture in residential spaces. These retailers offer a wide range of smart furniture options, including smart coffee tables with Bluetooth speakers and voice-activated lighting. The residential segment is witnessing growth due to the increasing trend towards automated home ecosystems and eco-friendly living. The market for smart office furniture is also expanding through e-commerce capabilities, allowing consumers to purchase these luxurious products online. The flexibility and space-saving features of smart furniture make it an attractive option for remote work and flexible home environments. With adjustable settings, environmental sensors, and smart devices, these modern fixtures offer user-friendly solutions for both living and working spaces.
|
Market Scope |
|
|
Report Coverage |
Details |
|
Page number |
163 |
|
Base year |
2023 |
|
Historic period |
2018-2022 |
|
Forecast period |
2024-2028 |
|
Growth momentum & CAGR |
Accelerate at a CAGR of 10.11% |
|
Market growth 2024-2028 |
USD 118.1 million |
|
Market structure |
Fragmented |
|
YoY growth 2023-2024(%) |
8.96 |
|
Regional analysis |
North America, Europe, APAC, South America, and Middle East and Africa |
|
Performing market contribution |
North America at 46% |
|
Key countries |
US, Canada, Germany, France, and China |
|
Competitive landscape |
Leading Companies, Market Positioning of Companies, Competitive Strategies, and Industry Risks |
|
Key companies profiled |
Avnet Inc., Berco Designs, DEKOM AG, Featherlite, GoBright B V, Haworth Inc., Humanscale International Holdings Ltd., Interogo Foundation, Kimball International Inc., Kinnarps AB, KOKUYO Co. Ltd., Konig Neurath AG, Mikomax Sp z o o, MillerKnoll Inc., Nilkamal Ltd., Schiavello International, Smart Furniture LLC, Steelcase Inc., Tabula Sense, and ZHEJIANG SUNON FURNITURE MANUFACTURE CO. LTD |
|
Market dynamics |
Parent market analysis, market growth inducers and obstacles, market forecast, fast-growing and slow-growing segment analysis, COVID-19 impact and recovery analysis and future consumer dynamics, market condition analysis for the forecast period |
|
Customization purview |
If our market report has not included the data that you are looking for, you can reach out to our analysts and get segments customized. |
What are the Key Data Covered in this Market Research and Growth Report?
- CAGR of the market during the forecast period
- Detailed information on factors that will drive the market growth and forecasting between 2024 and 2028
- Precise estimation of the size of the market and its contribution of the market in focus to the parent market
- Accurate predictions about upcoming market growth and trends and changes in consumer behaviour
- Growth of the market across North America, Europe, APAC, South America, and Middle East and Africa
- Thorough analysis of the market's competitive landscape and detailed information about companies
- Comprehensive analysis of factors that will challenge the growth of market companies
We can help! Our analysts can customize this market research report to meet your requirements. Get in touch
 RIA -
RIA - 
