Specialty Fluids Market Analysis APAC, North America, Europe, South America, Middle East and Africa - US, China, Japan, Germany, UK - Size and Forecast 2024-2028

Specialty Fluids Market Analysis APAC, North America, Europe, South America, Middle East and Africa - US, China, Japan, Germany, UK - Size and Forecast 2024-2028

Published: Jan 2024 186 Pages SKU: IRTNTR45767

Market Overview at a Glance

$9.11 B
Market Opportunity
4.68%
CAGR
4.22
YoY growth 2023-2024(%)

Specialty Fluids Market 2024-2028

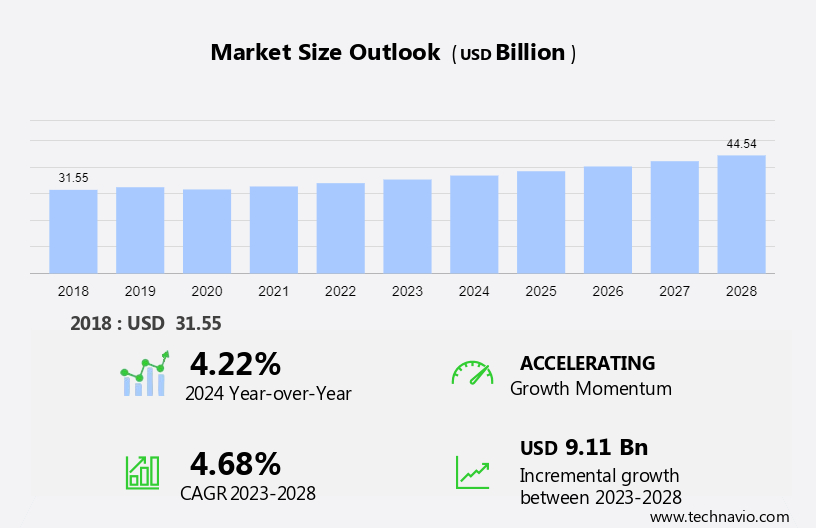
The specialty fluids market size is forecast to increase by USD 9.11 billion at a CAGR of 4.68% between 2023 and 2028. The growth rate of the market depends on several factors, including the growing chemical industry in APAC, the rapid industrialization around the globe, and the innovations in aerosols. 

The report includes a comprehensive outlook on the Specialty Fluids Market, offering forecasts for the industry segmented by Product, which comprises aerosols, precision cleaning, coolants, carrier fluids, and others.  Additionally, it categorizes Type into hydrofluorocarbon (HFC), hydrofluoroolefin (HFO), polyethylene glycol, and alcohol ethoxylates, and covers Regions, including APAC, North America, Europe, South America, and Middle East and Africa. The market research report provides market size, historical data spanning from 2018 to 2022, and future projections, all presented in terms of value in USD billion for each of the mentioned segments.

What will be the  Specialty Fluids Market Size During the Forecast Period?

Specialty Fluids Market Size

Request Free Sample in PDF

Specialty Fluids Market Definition 

Specialty fluids contain hydrofluorocarbon (HFC), hydrofluoroolefin (HFO), polyethylene glycol, alcohol ethoxylates, isoparaffins, or other products with zero ozone-depleting and low global warming potential. These fluids exhibit superior properties such as low boiling point, low surface tension, excellent solvent retention, non-flammability, high dielectric strength, and chemical and thermal stability.

To Know more about the Market Report  Request Free Sample

Specialty Fluids Market: Key Drivers, Trends, Challenges

Key Specialty Fluids Market Driver

The growing chemical industry in APAC is the key factor driving market growth. The chemical industry in APAC contributes significantly to the economic growth of the region. In China and India, the chemical industry has led to the growth of the manufacturing and agriculture sectors. It offers building blocks for various downstream industries such as paper, textiles, leather, and paints. In addition, the chemical industry in APAC has registered rapid growth because of the increase in the number of M&A, high demand for chemical and chemical products, and increasing investments in the region. 

Furthermore, the high domestic consumption of chemicals drives the chemical industry in the region. Urbanization and industrialization have increased the demand for chemicals in adhesives, paints, construction, and textile segments. The expanding manufacturing sector in the region has increased the demand for specialty fluids, coatings, and paints, which has led to a rise in the consumption of specialty fluids. Thus, such developments are expected to drive the growth of the global specialty fluids market during the forecast period.

Significant Specialty Fluids Market Trends

Increasing investments in CSP technology is the primary trend shaping market growth. The increasing focus on sustainability has increased innovations in CSP technology. CSP technology generates solar power by using mirrors or lenses to concentrate solar energy or thermal energy into a small area. The light is converted into heat to produce electricity. Moreover, many countries and organizations are investing heavily in the development of CSP technology. 

For instance, in October 2023, the Gujarat government approved more than USD 300 million for the development and construction of solar power plants. The project combines the concentrated solar power and photovoltaic project and will have a total capacity of 600-800 MW. Thus, increasing innovations in CSP technology is the market trends and analysis that will lead to a rise in the demand for specialty fluids, which, in turn, will boost the growth of the global specialty fluids market during the forecast period.

Major Specialty Fluids Market Challenge

Volatility in crude oil prices is a challenge that affects market growth. Each petrochemical feedstock has a unique correlation with oil prices, and this correlation is influenced by the supply and demand of feedstock, the manufacturing process, and the part of the world where the product is produced. Fluctuations in petrochemical feedstock prices adversely affect the demand for specialty fluids. Fluctuations in global crude oil prices affect the profitability and performance of oil and gas E&P companies.

Moreover, low crude oil prices can lead to the cancelation or rescheduling of oil and gas E&P projects. In addition, the plunge in global crude oil and natural gas prices has impeded the entire upstream oil and gas sector during the past decade. Several oil and gas E&P projects were canceled or postponed across the world. Hence, fluctuation in global crude oil prices is one of the major factors that will hinder market growth during the forecast period.

Specialty Fluids Market Segmentation by Product, Type, and Geography 

Specialty Fluids Market Product Analysis 

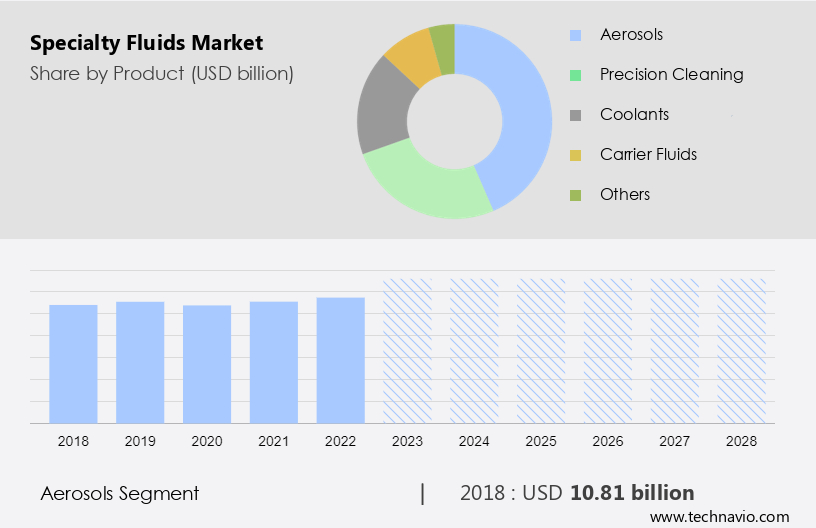
The market share growth by the aerosols segment will be significant during the forecast period. The rise in demand for aerosols is driving the demand for specialty fluids in aerosol applications. The growth in the use of aerosols is majorly driven by the increasing consumption of personal care products, such as deodorants, shaving creams, hair sprays, and body sprays. Aerosols are colloidal systems of solid or liquid particles that are suspended in a gas. 

Specialty Fluids Market Size

Get a glance at the market contribution of the End User  segment Request Free Sample

The aerosols segment accounted for USD 10.81 billion in 2018. Specialty fluids are used as replacements for hydrochlorofluorocarbons (HCFCs) in aerosols. They meet the diverse requirements of formulators and are environment-friendly and ozone-safe. Specialty fluids are used in aerosols as they exhibit superior cleaning properties. In addition, they are nonflammable and less toxic. These fluids contain a low concentration of volatile organic compounds (VOCs), exhibit quick drying, and are compatible with most materials. These benefits have increased the use of specialty fluids in aerosols, driving market growth during the forecast period.

Specialty Fluids Market Type Analysis 

In 2023, the hydrofluorocarbon (HFC) segment led the global specialty fluids and is expected to retain its dominant position throughout the forecast period. HFC-32 is a versatile aerosol refrigerant suitable for air-conditioning and heat pump applications. HFC-152a is viable in mobile vehicle air-conditioning applications. Hydrofluorocarbon-152a is suitable for commercial refrigeration applications, chillers, and industrial refrigeration. The global HVAC industry is expected to grow during the forecast period due to the exponential growth in the global construction sector. Furthermore, market players are providing cost advantages and maintenance and support services for a limited period to end-users, which is encouraging these end-users to opt for HVAC equipment. This is expected to increase the adoption of HFC as an aerosol refrigerant, which, in turn, is anticipated to drive the growth of the HFC segment of the market in focus during the forecast period. 

Specialty Fluids Market Region Analysis

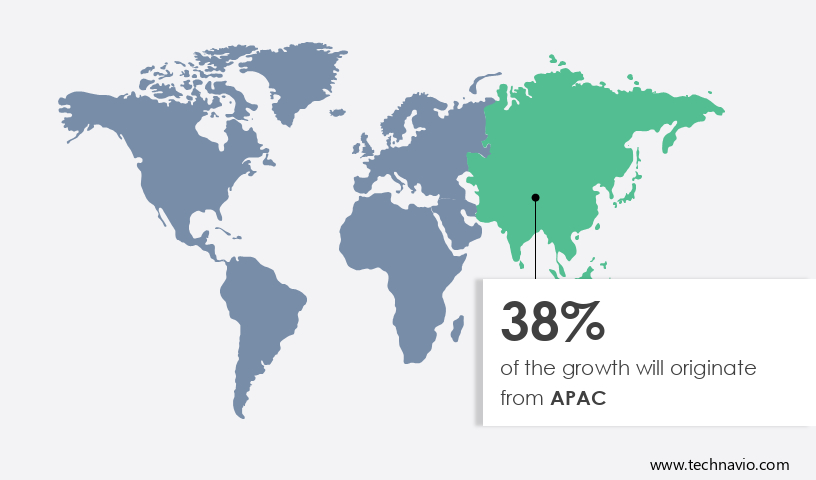
APAC is estimated to contribute 38% to the growth of the global market during the forecast period. Technavio’s analysts have elaborately explained the regional trends and drivers that shape the market during the forecast period. 

Specialty Fluids Market Share by Geography

For more insights on the market share of various regions Request Free Sample

Increasing sales of fragrance products, hair care products, and skincare products are driving the demand for aerosols in APAC, which, in turn, is driving the specialty fluids market research and growth in the region. Growth in automotive manufacturing is promoting the use of automotive spray paints across APAC, leading to increased sales of specialty fluids. China held the largest share of the specialty fluids market in the region.

Furthermore, with the expansion of the oil and gas industry and government initiatives for foreign investments in the region, the specialty fluids market in the region is registering growth. Moreover, E&P activities involve the extensive use of specialty fluids; hence, the increasing investments in the oil and gas industry and the rise in the number of E&P and mining activities will fuel the demand for specialty fluids in the region. Thereby propelling the growth of the regional specialty fluids market during the forecast period.

Key Specialty Fluids Market Companies

Companies are implementing various strategies by analyzing factors such as strategic alliances, partnerships, mergers and acquisitions, geographical expansion, and product or service launches, to enhance their presence in the market.

  • Baker Hughes Co.: The company offers specialty fluids such as TekPlug fluid loss control system, Super InsulGel insulating packer fluid, and others. 

The report also includes detailed analyses of the competitive landscape of the market and information about 15 market companies, including: 

Baker Hughes Co., BASF SE, BP Plc, Clariant International Ltd., Compagnie de Saint Gobain, ConocoPhillips Co., DuPont de Nemours Inc., Exxon Mobil Corp., Kluber Lubrication Munchen SE and Co. KG, Mitsubishi Chemical Group Corp., Momentive Performance Materials Inc., PTT Public Co. Ltd., Quaker Chemical Corp., Repsol SA, Shell plc, Solvay SA, TETRA Technologies Inc., The Chemours Co., and Valvoline Inc.

Qualitative and quantitative analysis of companies has been conducted to help clients understand the wider business environment as well as the strengths and weaknesses of key market players. Data is qualitatively analyzed to categorize companies as pure play, category-focused, industry-focused, and diversified; it is quantitatively analyzed to categorize companies as dominant, leading, strong, tentative, and weak.

Segment Overview

The specialty fluids market growth and forecasting by revenue at global, regional & country levels and analyzes the market growth and trends from 2018-2028. 

  • Product Outlook 
    • Aerosols
    • Precision cleaning
    • Coolants
    • Carrier fluids
    • Others
  • Type Outlook
    • Hydrofluorocarbon (HFC)
    • Hydrofluoroolefin (HFO)
    • Polyethylene glycol
    • Alcohol ethoxylates
  • Region Outlook 
    • North America
      • The U.S.
      • Canada
    • Europe
      • U.K.
      • Germany
      • France
      • Rest of Europe
    • APAC
      • China
      • India
    • South America
      • Chile 
      • Brazil
      • Argentina
    • Middle East & Africa
      • Saudi Arabia
      • South Africa
      • Rest of the Middle East & Africa

Specialty Fluids Market Scope

Report Coverage

Details

Page number

186

Base year

2023

Historic period

2018-2022

Market forecasting period

2024-2028

Growth momentum & CAGR

Accelerate at a CAGR of 4.68%

Market Growth 2024-2028

USD 9.11 billion

Market structure

Fragmented

YoY growth 2023-2024(%)

4.22

Regional analysis

APAC, North America, Europe, South America, and Middle East and Africa

Performing market contribution

APAC at 38%

Key countries

US, China, Japan, Germany, and UK

Competitive landscape

Leading Companies, Market Positioning of Companies, Competitive Strategies, and Industry Risks

Key companies profiled

Baker Hughes Co., BASF SE, BP Plc, Clariant International Ltd., Compagnie de Saint Gobain, ConocoPhillips Co., DuPont de Nemours Inc., Exxon Mobil Corp., Kluber Lubrication Munchen SE and Co. KG, Mitsubishi Chemical Group Corp., Momentive Performance Materials Inc., PTT Public Co. Ltd., Quaker Chemical Corp., Repsol SA, Shell plc, Solvay SA, TETRA Technologies Inc., The Chemours Co., and Valvoline Inc.

Market dynamics

Parent market analysis, Market growth inducers and obstacles, Fast-growing and slow-growing segment analysis, COVID-19 impact and recovery analysis and future consumer dynamics, and market analysis and report for the forecast period. 

Customization purview

If our report has not included the data that you are looking for, you can reach out to our analysts and get segments customized.

Request Free Sample

What are the Key Data Covered in this Specialty Fluids Market Report?

  • CAGR of the market during the forecast period
  • Detailed information on factors that will drive the growth of the market forecast between 2024 and 2028
  • Precise estimation of the market size and its contribution to the market in focus on the parent market
  • Accurate predictions about upcoming trends and changes in consumer behavior
  • The market growth analysis across APAC, North America, Europe, South America, and Middle East and Africa
  • A thorough analysis of the market’s competitive landscape and detailed information about companies
  • Comprehensive analysis of factors that will challenge the growth of specialty fluids market companies

We can help! Our analysts can customize this report to meet your requirements. Get in touch

1 Executive Summary

  • 1.1 Market overview
    • Exhibit 01: Executive Summary – Chart on Market Overview
    • Exhibit 02: Executive Summary – Data Table on Market Overview
    • Exhibit 03: Executive Summary – Chart on Global Market Characteristics
    • Exhibit 04: Executive Summary – Chart on Market by Geography
    • Exhibit 05: Executive Summary – Chart on Market Segmentation by Product
    • Exhibit 06: Executive Summary – Chart on Market Segmentation by Type
    • Exhibit 07: Executive Summary – Chart on Incremental Growth
    • Exhibit 08: Executive Summary – Data Table on Incremental Growth
    • Exhibit 09: Executive Summary – Chart on Vendor Market Positioning

2 Market Landscape

  • 2.1 Market ecosystem
    • Exhibit 10: Parent market
    • Exhibit 11: Market Characteristics

3 Market Sizing

  • 3.1 Market definition
    • Exhibit 12: Offerings of vendors included in the market definition
  • 3.2 Market segment analysis
    • Exhibit 13: Market segments
  • 3.3 Market size 2023
    • 3.4 Market outlook: Forecast for 2023-2028
      • Exhibit 14: Chart on Global - Market size and forecast 2023-2028 ($ billion)
      • Exhibit 15: Data Table on Global - Market size and forecast 2023-2028 ($ billion)
      • Exhibit 16: Chart on Global Market: Year-over-year growth 2023-2028 (%)
      • Exhibit 17: Data Table on Global Market: Year-over-year growth 2023-2028 (%)

    4 Historic Market Size

    • 4.1 Global specialty fluids market 2018 - 2022
      • Exhibit 18: Historic Market Size – Data Table on global specialty fluids market 2018 - 2022 ($ billion)
    • 4.2 Product Segment Analysis 2018 - 2022
      • Exhibit 19: Historic Market Size – Product Segment 2018 - 2022 ($ billion)
    • 4.3 Type Segment Analysis 2018 - 2022
      • Exhibit 20: Historic Market Size – Type Segment 2018 - 2022 ($ billion)
    • 4.4 Geography Segment Analysis 2018 - 2022
      • Exhibit 21: Historic Market Size – Geography Segment 2018 - 2022 ($ billion)
    • 4.5 Country Segment Analysis 2018 - 2022
      • Exhibit 22: Historic Market Size – Country Segment 2018 - 2022 ($ billion)

    5 Five Forces Analysis

    • 5.1 Five forces summary
      • Exhibit 23: Five forces analysis - Comparison between 2023 and 2028
    • 5.2 Bargaining power of buyers
      • Exhibit 24: Chart on Bargaining power of buyers – Impact of key factors 2023 and 2028
    • 5.3 Bargaining power of suppliers
      • Exhibit 25: Bargaining power of suppliers – Impact of key factors in 2023 and 2028
    • 5.4 Threat of new entrants
      • Exhibit 26: Threat of new entrants – Impact of key factors in 2023 and 2028
    • 5.5 Threat of substitutes
      • Exhibit 27: Threat of substitutes – Impact of key factors in 2023 and 2028
    • 5.6 Threat of rivalry
      • Exhibit 28: Threat of rivalry – Impact of key factors in 2023 and 2028
    • 5.7 Market condition
      • Exhibit 29: Chart on Market condition - Five forces 2023 and 2028

    6 Market Segmentation by Product

    • 6.1 Market segments
      • Exhibit 30: Chart on Product - Market share 2023-2028 (%)
      • Exhibit 31: Data Table on Product - Market share 2023-2028 (%)
    • 6.2 Comparison by Product
      • Exhibit 32: Chart on Comparison by Product
      • Exhibit 33: Data Table on Comparison by Product
    • 6.3 Aerosols - Market size and forecast 2023-2028
      • Exhibit 34: Chart on Aerosols - Market size and forecast 2023-2028 ($ billion)
      • Exhibit 35: Data Table on Aerosols - Market size and forecast 2023-2028 ($ billion)
      • Exhibit 36: Chart on Aerosols - Year-over-year growth 2023-2028 (%)
      • Exhibit 37: Data Table on Aerosols - Year-over-year growth 2023-2028 (%)
    • 6.4 Precision cleaning - Market size and forecast 2023-2028
      • Exhibit 38: Chart on Precision cleaning - Market size and forecast 2023-2028 ($ billion)
      • Exhibit 39: Data Table on Precision cleaning - Market size and forecast 2023-2028 ($ billion)
      • Exhibit 40: Chart on Precision cleaning - Year-over-year growth 2023-2028 (%)
      • Exhibit 41: Data Table on Precision cleaning - Year-over-year growth 2023-2028 (%)
    • 6.5 Coolants - Market size and forecast 2023-2028
      • Exhibit 42: Chart on Coolants - Market size and forecast 2023-2028 ($ billion)
      • Exhibit 43: Data Table on Coolants - Market size and forecast 2023-2028 ($ billion)
      • Exhibit 44: Chart on Coolants - Year-over-year growth 2023-2028 (%)
      • Exhibit 45: Data Table on Coolants - Year-over-year growth 2023-2028 (%)
    • 6.6 Carrier fluids - Market size and forecast 2023-2028
      • Exhibit 46: Chart on Carrier fluids - Market size and forecast 2023-2028 ($ billion)
      • Exhibit 47: Data Table on Carrier fluids - Market size and forecast 2023-2028 ($ billion)
      • Exhibit 48: Chart on Carrier fluids - Year-over-year growth 2023-2028 (%)
      • Exhibit 49: Data Table on Carrier fluids - Year-over-year growth 2023-2028 (%)
    • 6.7 Others - Market size and forecast 2023-2028
      • Exhibit 50: Chart on Others - Market size and forecast 2023-2028 ($ billion)
      • Exhibit 51: Data Table on Others - Market size and forecast 2023-2028 ($ billion)
      • Exhibit 52: Chart on Others - Year-over-year growth 2023-2028 (%)
      • Exhibit 53: Data Table on Others - Year-over-year growth 2023-2028 (%)
    • 6.8 Market opportunity by Product
      • Exhibit 54: Market opportunity by Product ($ billion)
      • Exhibit 55: Data Table on Market opportunity by Product ($ billion)

    7 Market Segmentation by Type

    • 7.1 Market segments
      • Exhibit 56: Chart on Type - Market share 2023-2028 (%)
      • Exhibit 57: Data Table on Type - Market share 2023-2028 (%)
    • 7.2 Comparison by Type
      • Exhibit 58: Chart on Comparison by Type
      • Exhibit 59: Data Table on Comparison by Type
    • 7.3 Hydrofluorocarbon (HFC) - Market size and forecast 2023-2028
      • Exhibit 60: Chart on Hydrofluorocarbon (HFC) - Market size and forecast 2023-2028 ($ billion)
      • Exhibit 61: Data Table on Hydrofluorocarbon (HFC) - Market size and forecast 2023-2028 ($ billion)
      • Exhibit 62: Chart on Hydrofluorocarbon (HFC) - Year-over-year growth 2023-2028 (%)
      • Exhibit 63: Data Table on Hydrofluorocarbon (HFC) - Year-over-year growth 2023-2028 (%)
    • 7.4 Hydrofluoroolefin (HFO) - Market size and forecast 2023-2028
      • Exhibit 64: Chart on Hydrofluoroolefin (HFO) - Market size and forecast 2023-2028 ($ billion)
      • Exhibit 65: Data Table on Hydrofluoroolefin (HFO) - Market size and forecast 2023-2028 ($ billion)
      • Exhibit 66: Chart on Hydrofluoroolefin (HFO) - Year-over-year growth 2023-2028 (%)
      • Exhibit 67: Data Table on Hydrofluoroolefin (HFO) - Year-over-year growth 2023-2028 (%)
    • 7.5 Polyethylene glycol - Market size and forecast 2023-2028
      • Exhibit 68: Chart on Polyethylene glycol - Market size and forecast 2023-2028 ($ billion)
      • Exhibit 69: Data Table on Polyethylene glycol - Market size and forecast 2023-2028 ($ billion)
      • Exhibit 70: Chart on Polyethylene glycol - Year-over-year growth 2023-2028 (%)
      • Exhibit 71: Data Table on Polyethylene glycol - Year-over-year growth 2023-2028 (%)
    • 7.6 Alcohol ethoxylates - Market size and forecast 2023-2028
      • Exhibit 72: Chart on Alcohol ethoxylates - Market size and forecast 2023-2028 ($ billion)
      • Exhibit 73: Data Table on Alcohol ethoxylates - Market size and forecast 2023-2028 ($ billion)
      • Exhibit 74: Chart on Alcohol ethoxylates - Year-over-year growth 2023-2028 (%)
      • Exhibit 75: Data Table on Alcohol ethoxylates - Year-over-year growth 2023-2028 (%)
    • 7.7 Market opportunity by Type
      • Exhibit 76: Market opportunity by Type ($ billion)
      • Exhibit 77: Data Table on Market opportunity by Type ($ billion)

    8 Customer Landscape

    • 8.1 Customer landscape overview
      • Exhibit 78: Analysis of price sensitivity, lifecycle, customer purchase basket, adoption rates, and purchase criteria

    9 Geographic Landscape

    • 9.1 Geographic segmentation
      • Exhibit 79: Chart on Market share by geography 2023-2028 (%)
      • Exhibit 80: Data Table on Market share by geography 2023-2028 (%)
    • 9.2 Geographic comparison
      • Exhibit 81: Chart on Geographic comparison
      • Exhibit 82: Data Table on Geographic comparison
    • 9.3 APAC - Market size and forecast 2023-2028
      • Exhibit 83: Chart on APAC - Market size and forecast 2023-2028 ($ billion)
      • Exhibit 84: Data Table on APAC - Market size and forecast 2023-2028 ($ billion)
      • Exhibit 85: Chart on APAC - Year-over-year growth 2023-2028 (%)
      • Exhibit 86: Data Table on APAC - Year-over-year growth 2023-2028 (%)
    • 9.4 North America - Market size and forecast 2023-2028
      • Exhibit 87: Chart on North America - Market size and forecast 2023-2028 ($ billion)
      • Exhibit 88: Data Table on North America - Market size and forecast 2023-2028 ($ billion)
      • Exhibit 89: Chart on North America - Year-over-year growth 2023-2028 (%)
      • Exhibit 90: Data Table on North America - Year-over-year growth 2023-2028 (%)
    • 9.5 Europe - Market size and forecast 2023-2028
      • Exhibit 91: Chart on Europe - Market size and forecast 2023-2028 ($ billion)
      • Exhibit 92: Data Table on Europe - Market size and forecast 2023-2028 ($ billion)
      • Exhibit 93: Chart on Europe - Year-over-year growth 2023-2028 (%)
      • Exhibit 94: Data Table on Europe - Year-over-year growth 2023-2028 (%)
    • 9.6 South America - Market size and forecast 2023-2028
      • Exhibit 95: Chart on South America - Market size and forecast 2023-2028 ($ billion)
      • Exhibit 96: Data Table on South America - Market size and forecast 2023-2028 ($ billion)
      • Exhibit 97: Chart on South America - Year-over-year growth 2023-2028 (%)
      • Exhibit 98: Data Table on South America - Year-over-year growth 2023-2028 (%)
    • 9.7 Middle East and Africa - Market size and forecast 2023-2028
      • Exhibit 99: Chart on Middle East and Africa - Market size and forecast 2023-2028 ($ billion)
      • Exhibit 100: Data Table on Middle East and Africa - Market size and forecast 2023-2028 ($ billion)
      • Exhibit 101: Chart on Middle East and Africa - Year-over-year growth 2023-2028 (%)
      • Exhibit 102: Data Table on Middle East and Africa - Year-over-year growth 2023-2028 (%)
    • 9.8 China - Market size and forecast 2023-2028
      • Exhibit 103: Chart on China - Market size and forecast 2023-2028 ($ billion)
      • Exhibit 104: Data Table on China - Market size and forecast 2023-2028 ($ billion)
      • Exhibit 105: Chart on China - Year-over-year growth 2023-2028 (%)
      • Exhibit 106: Data Table on China - Year-over-year growth 2023-2028 (%)
    • 9.9 US - Market size and forecast 2023-2028
      • Exhibit 107: Chart on US - Market size and forecast 2023-2028 ($ billion)
      • Exhibit 108: Data Table on US - Market size and forecast 2023-2028 ($ billion)
      • Exhibit 109: Chart on US - Year-over-year growth 2023-2028 (%)
      • Exhibit 110: Data Table on US - Year-over-year growth 2023-2028 (%)
    • 9.10 Germany - Market size and forecast 2023-2028
      • Exhibit 111: Chart on Germany - Market size and forecast 2023-2028 ($ billion)
      • Exhibit 112: Data Table on Germany - Market size and forecast 2023-2028 ($ billion)
      • Exhibit 113: Chart on Germany - Year-over-year growth 2023-2028 (%)
      • Exhibit 114: Data Table on Germany - Year-over-year growth 2023-2028 (%)
    • 9.11 Japan - Market size and forecast 2023-2028
      • Exhibit 115: Chart on Japan - Market size and forecast 2023-2028 ($ billion)
      • Exhibit 116: Data Table on Japan - Market size and forecast 2023-2028 ($ billion)
      • Exhibit 117: Chart on Japan - Year-over-year growth 2023-2028 (%)
      • Exhibit 118: Data Table on Japan - Year-over-year growth 2023-2028 (%)
    • 9.12 UK - Market size and forecast 2023-2028
      • Exhibit 119: Chart on UK - Market size and forecast 2023-2028 ($ billion)
      • Exhibit 120: Data Table on UK - Market size and forecast 2023-2028 ($ billion)
      • Exhibit 121: Chart on UK - Year-over-year growth 2023-2028 (%)
      • Exhibit 122: Data Table on UK - Year-over-year growth 2023-2028 (%)
    • 9.13 Market opportunity by geography
      • Exhibit 123: Market opportunity by geography ($ billion)
      • Exhibit 124: Data Tables on Market opportunity by geography ($ billion)

    10 Drivers, Challenges, and Trends

    • 10.1 Market drivers
      • 10.2 Market challenges
        • 10.3 Impact of drivers and challenges
          • Exhibit 125: Impact of drivers and challenges in 2023 and 2028
        • 10.4 Market trends

          11 Vendor Landscape

          • 11.1 Overview
            • 11.2 Vendor landscape
              • Exhibit 126: Overview on Criticality of inputs and Factors of differentiation
            • 11.3 Landscape disruption
              • Exhibit 127: Overview on factors of disruption
            • 11.4 Industry risks
              • Exhibit 128: Impact of key risks on business

            12 Vendor Analysis

            • 12.1 Vendors covered
              • Exhibit 129: Vendors covered
            • 12.2 Market positioning of vendors
              • Exhibit 130: Matrix on vendor position and classification
            • 12.3 Baker Hughes Co.
              • Exhibit 131: Baker Hughes Co. - Overview
              • Exhibit 132: Baker Hughes Co. - Business segments
              • Exhibit 133: Baker Hughes Co. - Key news
              • Exhibit 134: Baker Hughes Co. - Key offerings
              • Exhibit 135: Baker Hughes Co. - Segment focus
            • 12.4 Clariant International Ltd.
              • Exhibit 136: Clariant International Ltd. - Overview
              • Exhibit 137: Clariant International Ltd. - Business segments
              • Exhibit 138: Clariant International Ltd. - Key news
              • Exhibit 139: Clariant International Ltd. - Key offerings
              • Exhibit 140: Clariant International Ltd. - Segment focus
            • 12.5 Compagnie de Saint Gobain
              • Exhibit 141: Compagnie de Saint Gobain - Overview
              • Exhibit 142: Compagnie de Saint Gobain - Business segments
              • Exhibit 143: Compagnie de Saint Gobain - Key news
              • Exhibit 144: Compagnie de Saint Gobain - Key offerings
              • Exhibit 145: Compagnie de Saint Gobain - Segment focus
            • 12.6 ConocoPhillips Co.
              • Exhibit 146: ConocoPhillips Co. - Overview
              • Exhibit 147: ConocoPhillips Co. - Business segments
              • Exhibit 148: ConocoPhillips Co. - Key offerings
              • Exhibit 149: ConocoPhillips Co. - Segment focus
            • 12.7 DuPont de Nemours Inc.
              • Exhibit 150: DuPont de Nemours Inc. - Overview
              • Exhibit 151: DuPont de Nemours Inc. - Business segments
              • Exhibit 152: DuPont de Nemours Inc. - Key news
              • Exhibit 153: DuPont de Nemours Inc. - Key offerings
              • Exhibit 154: DuPont de Nemours Inc. - Segment focus
            • 12.8 Exxon Mobil Corp.
              • Exhibit 155: Exxon Mobil Corp. - Overview
              • Exhibit 156: Exxon Mobil Corp. - Business segments
              • Exhibit 157: Exxon Mobil Corp. - Key news
              • Exhibit 158: Exxon Mobil Corp. - Key offerings
              • Exhibit 159: Exxon Mobil Corp. - Segment focus
            • 12.9 Mitsubishi Chemical Group Corp.
              • Exhibit 160: Mitsubishi Chemical Group Corp. - Overview
              • Exhibit 161: Mitsubishi Chemical Group Corp. - Business segments
              • Exhibit 162: Mitsubishi Chemical Group Corp. - Key offerings
              • Exhibit 163: Mitsubishi Chemical Group Corp. - Segment focus
            • 12.10 Momentive Performance Materials Inc.
              • Exhibit 164: Momentive Performance Materials Inc. - Overview
              • Exhibit 165: Momentive Performance Materials Inc. - Product / Service
              • Exhibit 166: Momentive Performance Materials Inc. - Key offerings
            • 12.11 PTT Public Co. Ltd.
              • Exhibit 167: PTT Public Co. Ltd. - Overview
              • Exhibit 168: PTT Public Co. Ltd. - Business segments
              • Exhibit 169: PTT Public Co. Ltd. - Key offerings
              • Exhibit 170: PTT Public Co. Ltd. - Segment focus
            • 12.12 Quaker Chemical Corp.
              • Exhibit 171: Quaker Chemical Corp. - Overview
              • Exhibit 172: Quaker Chemical Corp. - Business segments
              • Exhibit 173: Quaker Chemical Corp. - Key offerings
              • Exhibit 174: Quaker Chemical Corp. - Segment focus
            • 12.13 Repsol SA
              • Exhibit 175: Repsol SA - Overview
              • Exhibit 176: Repsol SA - Product / Service
              • Exhibit 177: Repsol SA - Key offerings
            • 12.14 Solvay SA
              • Exhibit 178: Solvay SA - Overview
              • Exhibit 179: Solvay SA - Business segments
              • Exhibit 180: Solvay SA - Key news
              • Exhibit 181: Solvay SA - Key offerings
              • Exhibit 182: Solvay SA - Segment focus
            • 12.15 TETRA Technologies Inc.
              • Exhibit 183: TETRA Technologies Inc. - Overview
              • Exhibit 184: TETRA Technologies Inc. - Business segments
              • Exhibit 185: TETRA Technologies Inc. - Key offerings
              • Exhibit 186: TETRA Technologies Inc. - Segment focus
            • 12.16 The Chemours Co.
              • Exhibit 187: The Chemours Co. - Overview
              • Exhibit 188: The Chemours Co. - Business segments
              • Exhibit 189: The Chemours Co. - Key news
              • Exhibit 190: The Chemours Co. - Key offerings
              • Exhibit 191: The Chemours Co. - Segment focus
            • 12.17 Valvoline Inc.
              • Exhibit 192: Valvoline Inc. - Overview
              • Exhibit 193: Valvoline Inc. - Product / Service
              • Exhibit 194: Valvoline Inc. - Key offerings

            13 Appendix

            • 13.1 Scope of the report
              • 13.2 Inclusions and exclusions checklist
                • Exhibit 195: Inclusions checklist
                • Exhibit 196: Exclusions checklist
              • 13.3 Currency conversion rates for US$
                • Exhibit 197: Currency conversion rates for US$
              • 13.4 Research methodology
                • Exhibit 198: Research methodology
                • Exhibit 199: Validation techniques employed for market sizing
                • Exhibit 200: Information sources
              • 13.5 List of abbreviations
                • Exhibit 201: List of abbreviations

                Research Methodology

                Technavio presents a detailed picture of the market by way of study, synthesis, and summation of data from multiple sources. The analysts have presented the various facets of the market with a particular focus on identifying the key industry influencers. The data thus presented is comprehensive, reliable, and the result of extensive research, both primary and secondary.

                INFORMATION SOURCES

                Primary sources

                • Manufacturers and suppliers
                • Channel partners
                • Industry experts
                • Strategic decision makers

                Secondary sources

                • Industry journals and periodicals
                • Government data
                • Financial reports of key industry players
                • Historical data
                • Press releases

                DATA ANALYSIS

                Data Synthesis

                • Collation of data
                • Estimation of key figures
                • Analysis of derived insights

                Data Validation

                • Triangulation with data models
                • Reference against proprietary databases
                • Corroboration with industry experts

                REPORT WRITING

                Qualitative

                • Market drivers
                • Market challenges
                • Market trends
                • Five forces analysis

                Quantitative

                • Market size and forecast
                • Market segmentation
                • Geographical insights
                • Competitive landscape

                Interested in this report?

                Get your sample now to see our research methodology and insights!

                Download Now

                Frequently Asked Questions

                Specialty Fluids market growth will increase by $ 9.11 bn during 2024-2028.

                The Specialty Fluids market is expected to grow at a CAGR of 4.68% during 2024-2028.

                Specialty Fluids market is segmented by Product( Aerosols, Precision cleaning, Coolants, Carrier fluids, Others) Type( Hydrofluorocarbon (HFC), Hydrofluoroolefin (HFO), Polyethylene glycol, Alcohol ethoxylates, MEA)

                Baker Hughes Co., BASF SE, BP Plc, Clariant International Ltd., Compagnie de Saint Gobain, ConocoPhillips Co., DuPont de Nemours Inc., Exxon Mobil Corp., Kluber Lubrication Munchen SE and Co. KG, Mitsubishi Chemical Group Corp., Momentive Performance Materials Inc., PTT Public Co. Ltd., Quaker Chemical Corp., Repsol SA, Shell plc, Solvay SA, TETRA Technologies Inc., The Chemours Co., Valvoline Inc. are a few of the key vendors in the Specialty Fluids market.

                APAC will register the highest growth rate of 38% among the other regions. Therefore, the Specialty Fluids market in APAC is expected to garner significant business opportunities for the vendors during the forecast period.

                US, China, Japan, Germany, UK

                • Growing chemical industry in APACThe chemical industry is one of the major users of specialty fluids. Thus is the driving factor this market.
                • growth in the chemical industry will increase the demand for specialty fluids. The chemical industry in APAC contributes significantly to the economic growth of the region. In China and India is the driving factor this market.
                • the chemical industry has led to the growth of the manufacturing and agriculture sectors. It offers building blocks for various downstream industries such as paper is the driving factor this market.
                • textiles is the driving factor this market.
                • leather is the driving factor this market.
                • and paints. The chemical industry in APAC has registered rapid growth because of the increase in the number of M and A is the driving factor this market.
                • high demand for chemical and chemical products is the driving factor this market.
                • and increasing investments in the region. China is among the top producers of chemicals across the globe. The chemical industry in India is the second-largest industrial sector in the country. The growth of the chemical industry in APAC can be attributed to the abundant supply of feedstock and a favorable labor market. The high domestic consumption of chemicals drives the chemical industry in the region. Urbanization and industrialization have increased the demand for chemicals in adhesives is the driving factor this market.
                • paints is the driving factor this market.
                • construction is the driving factor this market.
                • and textile segments. The expanding manufacturing sector in the region has increased the demand for specialty fluids is the driving factor this market.
                • coatings is the driving factor this market.
                • and paints is the driving factor this market.
                • which has led to a rise in the consumption of specialty fluids. All such developments are expected to drive the growth of the global specialty fluids market during the forecast period. is the driving factor this market.

                The Specialty Fluids market vendors should focus on grabbing business opportunities from the Aerosols segment as it accounted for the largest market share in the base year.