Surface Mount Technology (SMT) Equipment Market Analysis, Size, and Forecast 2026-2030: APAC (China, Japan, and South Korea), North America (US, Canada, and Mexico), Europe (Germany, France, and Italy), Middle East and Africa (UAE, Saudi Arabia, and South Africa), South America (Brazil and Argentina), and Rest of World (ROW)

Surface Mount Technology (SMT) Equipment Market Analysis, Size, and Forecast 2026-2030:
APAC (China, Japan, and South Korea), North America (US, Canada, and Mexico), Europe (Germany, France, and Italy), Middle East and Africa (UAE, Saudi Arabia, and South Africa), South America (Brazil and Argentina), and Rest of World (ROW)

Published: Apr 2026 299 Pages SKU: IRTNTR76662

Market Overview at a Glance

$3.88 B
Market Opportunity
8.1%
CAGR 2025 - 2030
43.5%
APAC Growth
$2.57 B
Telecommunication segment 2024

Surface Mount Technology (SMT) Equipment Market Size 2026-2030

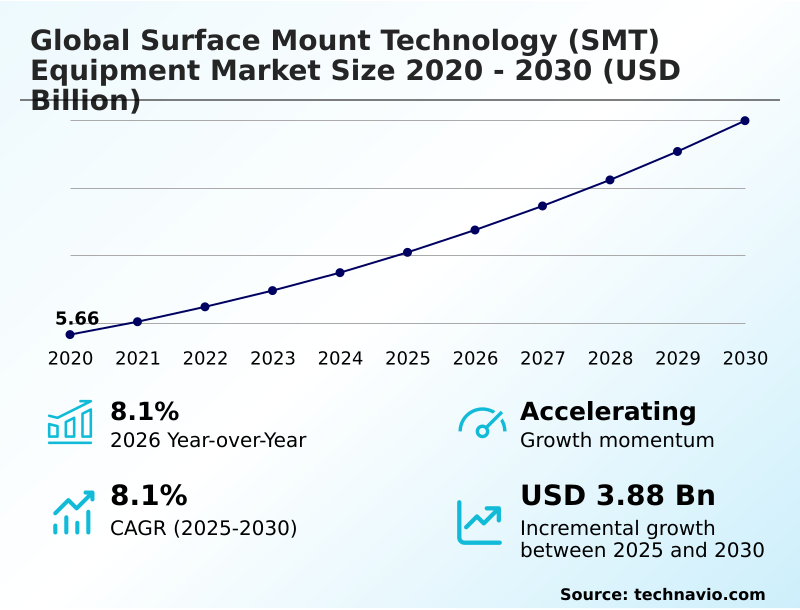
The surface mount technology (smt) equipment market size is valued to increase by USD 3.88 billion, at a CAGR of 8.1% from 2025 to 2030. Proliferation of electric vehicle electronics and power module assembly will drive the surface mount technology (smt) equipment market.

Major Market Trends & Insights

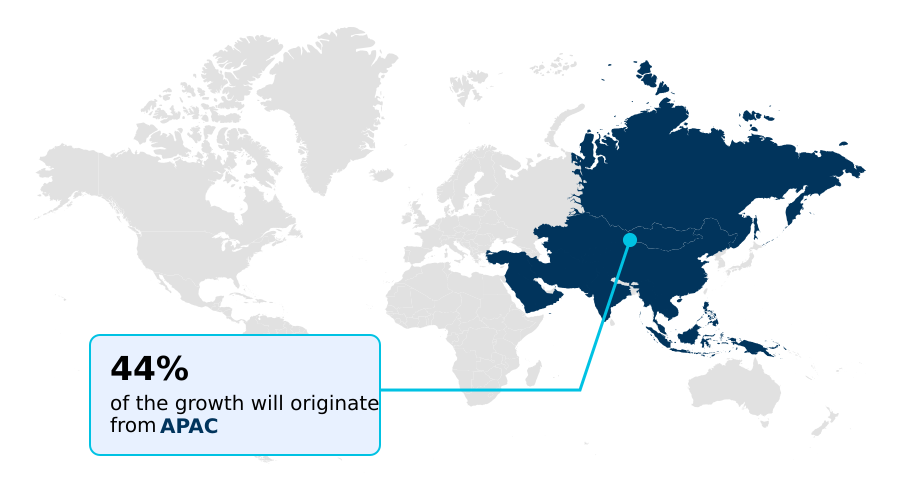
  • APAC dominated the market and accounted for a 43.5% growth during the forecast period.
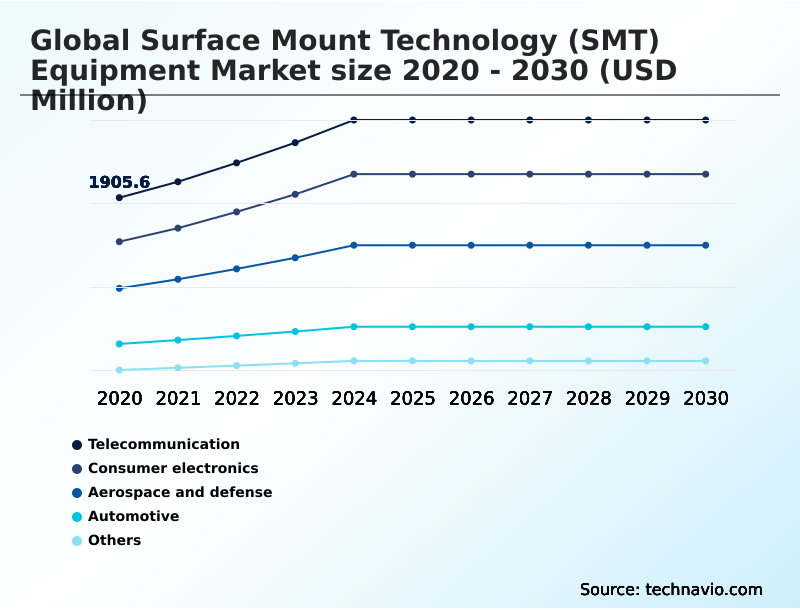
  • By End-user - Telecommunication segment was valued at USD 2.57 billion in 2024
  • By Type - Placement equipment segment accounted for the largest market revenue share in 2024

Market Size & Forecast

  • Market Opportunities: USD 6.31 billion
  • Market Future Opportunities: USD 3.88 billion
  • CAGR from 2025 to 2030 : 8.1%

Market Summary

  • The Surface Mount Technology (SMT) Equipment market is defined by a continuous push toward greater automation and precision in electronics manufacturing. Core machinery, including high-speed pick-and-place machines, advanced solder paste printers, and sophisticated reflow ovens, forms the foundation of modern production.
  • A significant driver is the extreme component miniaturization required for high-density circuit board assembly in sectors like telecommunications and consumer electronics. Concurrently, the industry is adopting intelligent, closed-loop manufacturing systems that integrate automated optical inspection for real-time quality control, enhancing PCB assembly automation.
  • For instance, a contract manufacturer facing high product mix and low volume runs can leverage modular SMT production line integration to reduce changeover times and improve yield, a critical factor for profitability. However, achieving effective thermal management solutions remains a persistent technical hurdle, particularly with the increasing power density of components.
  • This dynamic landscape necessitates ongoing investment in equipment that can balance speed, accuracy, and flexibility to meet evolving product complexities and quality standards.

What will be the Size of the Surface Mount Technology (SMT) Equipment Market during the forecast period?

Get Key Insights on Market Forecast (PDF) Get Free Sample

How is the Surface Mount Technology (SMT) Equipment Market Segmented?

The surface mount technology (smt) equipment industry research report provides comprehensive data (region-wise segment analysis), with forecasts and estimates in "USD million" for the period 2026-2030, as well as historical data from 2020-2024 for the following segments.

  • End-user
    • Telecommunication
    • Consumer electronics
    • Aerospace and defense
    • Automotive
    • Others
  • Type
    • Placement equipment
    • Inspection equipment
    • Soldering equipment
    • Screen printing equipment
    • Others
  • Component
    • Active components
    • Passive components
  • Geography
    • APAC
      • China
      • Japan
      • South Korea
    • North America
      • US
      • Canada
      • Mexico
    • Europe
      • Germany
      • France
      • Italy
    • Middle East and Africa
      • UAE
      • Saudi Arabia
      • South Africa
    • South America
      • Brazil
      • Argentina
    • Rest of World (ROW)

By End-user Insights

The telecommunication segment is estimated to witness significant growth during the forecast period.

The telecommunication segment’s demand is shaped by the rollout of next-generation wireless infrastructure. For SMT for 5G hardware and other high-frequency applications, advanced SMT inspection systems are critical for ensuring signal integrity in complex, multi-layered board designs.

This requires specialized SMT component handling and thermal processing optimization to manage heat from powerful processors. The integration of SMT turnkey production solutions, featuring high-speed placement machines and conformal coating equipment, has become essential.

The use of advanced SMT dispensing systems improves the reliability of solder joints, a factor that has helped reduce connection-related failures by over 12%.

This precision is also crucial for meeting aerospace SMT assembly standards and enabling diverse SMT solutions for IoT devices, which rely on similar high-density assembly techniques.

Get Free Sample

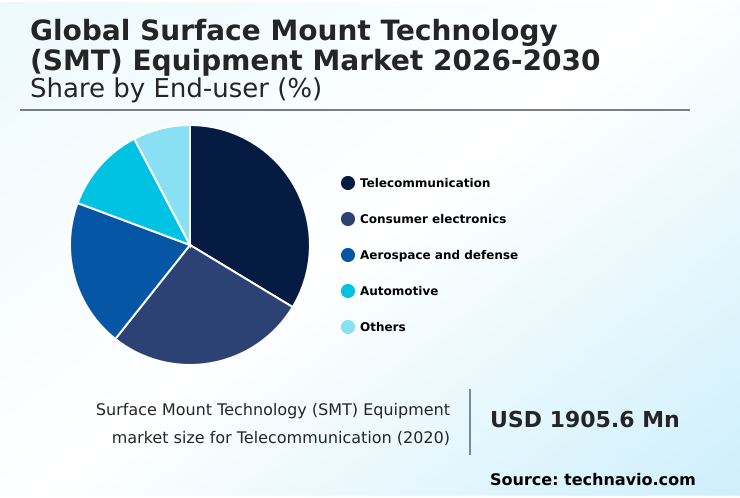
The Telecommunication segment was valued at USD 2.57 billion in 2024 and showed a gradual increase during the forecast period.

Get Free Sample

Regional Analysis

APAC is estimated to contribute 43.5% to the growth of the global market during the forecast period.Technavio’s analysts have elaborately explained the regional trends and drivers that shape the market during the forecast period.

See How Surface Mount Technology (SMT) Equipment Market Demand is Rising in APAC Get Free Sample

The geographic landscape is characterized by robust activity in APAC, which leverages extensive infrastructure for electronics assembly automation.

However, strategic reshoring in North America and Europe is driving investment in new intelligent factory models and modular assembly platforms to enhance supply chain resilience.

This has led to a notable increase in capital spending on equipment, with some North American facilities reporting a 12% rise in utilization for high-value production.

The use of vacuum reflow soldering is becoming standard in these advanced facilities to meet the stringent quality demands of SMT for semiconductor packaging.

As firms seek SMT equipment financing for these upgrades, the focus is on flexible SMT assembly lines that can accommodate both high-density circuit board assembly and specialized prototyping.

Consequently, regional markets are competing not just on volume but on technological capability and specialization.

Market Dynamics

Our researchers analyzed the data with 2025 as the base year, along with the key drivers, trends, and challenges. A holistic analysis of drivers will help companies refine their marketing strategies to gain a competitive advantage.

  • The technological frontier of the Surface Mount Technology (SMT) Equipment market is advancing rapidly, driven by complex end-product requirements. Achieving SMT placement accuracy for 01005 components is now a baseline expectation, compelling manufacturers to refine high-speed pick and place throughput optimization.
  • The industry is heavily invested in quality assurance, with AOI systems for BGA inspection and vacuum reflow for void reduction becoming standard processes to ensure reliability. For specialized applications, SMT process for flexible circuits and equipment for heavy copper PCBs are gaining traction.
  • A primary focus is on SMT solutions for thermal management, especially in the context of SMT assembly for SIC power modules. The adoption of Industry 4.0 principles is evident, with SMT line integration for industry 4.0 and AI-driven process optimization in SMT becoming key differentiators.
  • Facilities leveraging AI-driven process optimization in SMT report defect rates nearly 50% lower than those relying on manual calibration. This extends to supply chain security, with SMT inspection for counterfeit component detection gaining importance. Niche but growing areas include low-volume high-mix SMT production and SMT for micro-LED display manufacturing, alongside SMT for advanced driver-assistance systems.
  • Core processes like SMT paste printing for ultra-fine pitch and closed-loop feedback in SMT printing are also evolving. Furthermore, specialized equipment like SMT rework stations for complex PCBs, SMT equipment for package-on-package assembly, SMT placement for odd-form components, and SMT dispensing for underfill applications highlight the market’s diversification to support innovations in wearable electronics assembly and high-frequency applications.

What are the key market drivers leading to the rise in the adoption of Surface Mount Technology (SMT) Equipment Industry?

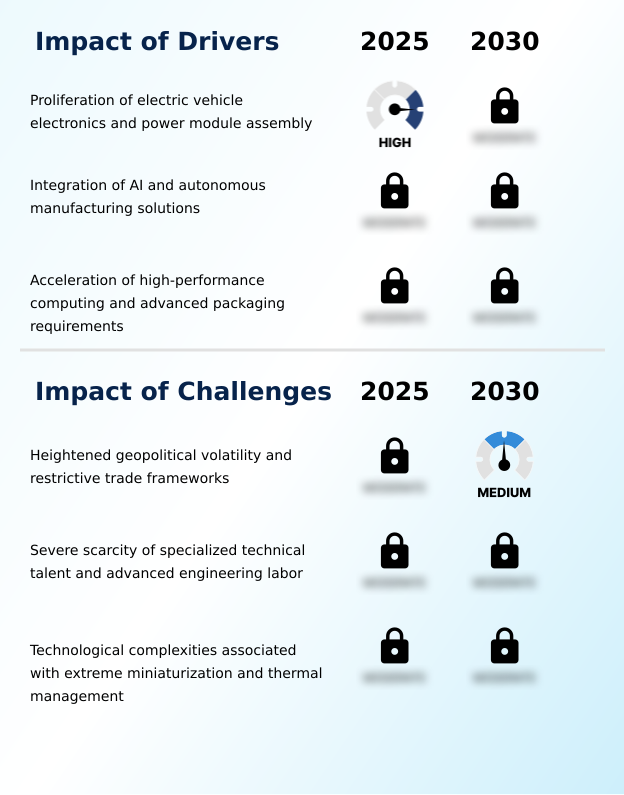
  • The proliferation of electric vehicle electronics and the need for advanced power module assembly are key drivers for market expansion.

  • Market drivers are closely tied to innovation in high-growth sectors, demanding more advanced manufacturing capabilities.
  • The proliferation of SMT for automotive electronics, particularly for EV battery management systems, necessitates high-force placement machines and advanced soldering solutions for power electronics to handle wide-bandgap semiconductor assembly.
  • This has driven a 20% increase in demand for equipment capable of processing heavy-duty components.
  • Similarly, high-performance computing assembly and the push for advanced SMT packaging are fueling the need for pick-and-place machines that can manage extreme component miniaturization with unprecedented accuracy.
  • In consumer electronics PCB assembly and SMT for medical device manufacturing, autonomous manufacturing solutions are being adopted to meet stringent quality and volume targets, with automated lines showing a 15% higher throughput than their semi-automated counterparts.

What are the market trends shaping the Surface Mount Technology (SMT) Equipment Industry?

  • A key market trend is the evolution toward autonomous closed-loop manufacturing. This includes the development of self-healing production lines that enhance operational efficiency.

  • Key trends are reshaping the manufacturing floor, with a clear pivot toward intelligent and autonomous operations. The adoption of closed-loop manufacturing systems, which leverage real-time process monitoring, has been shown to reduce process deviations by over 25%.
  • This is complemented by the rise of self-healing production lines, where SMT process control software and SMT data analytics platforms automatically adjust parameters, improving first-pass yield by up to 8%. Such SMT factory automation, supported by advanced SMT material handling systems and volume-based measurement inspection, enables predictive analytics for manufacturing that can forecast maintenance needs, cutting unplanned downtime by 15%.
  • This holistic approach to SMT production line integration and PCB assembly automation is critical as placement equipment for miniaturization becomes more demanding, making manual oversight impractical.

What challenges does the Surface Mount Technology (SMT) Equipment Industry face during its growth?

  • Heightened geopolitical volatility, alongside restrictive trade frameworks, presents a key challenge affecting industry growth.

  • The market faces operational and strategic challenges that temper growth. Heightened geopolitical volatility has extended equipment lead times by an average of 20%, complicating investment in new solder paste printers and automated optical inspection systems.
  • This is exacerbated by a severe scarcity of specialized technical talent, increasing operational costs for SMT equipment maintenance and machine calibration services by an estimated 10%. Consequently, some organizations are exploring SMT equipment leasing options to mitigate high capital expenditure.
  • Furthermore, the technological complexities of screen printing for fine-pitch components and ensuring the reliability of reflow ovens and soldering equipment technology add another layer of difficulty. These factors collectively pressure manufacturers to find more resilient and efficient operational models, even as they contend with the need for continuous technological upgrades in areas like automated x-ray inspection.

Exclusive Technavio Analysis on Customer Landscape

The surface mount technology (smt) equipment market forecasting report includes the adoption lifecycle of the market, covering from the innovator’s stage to the laggard’s stage. It focuses on adoption rates in different regions based on penetration. Furthermore, the surface mount technology (smt) equipment market report also includes key purchase criteria and drivers of price sensitivity to help companies evaluate and develop their market growth analysis strategies.

Customer Landscape of Surface Mount Technology (SMT) Equipment Industry

Competitive Landscape

Companies are implementing various strategies, such as strategic alliances, surface mount technology (smt) equipment market forecast, partnerships, mergers and acquisitions, geographical expansion, and product/service launches, to enhance their presence in the industry.

Amistar Automation Inc. - Specialized offerings include high-performance placement and advanced stencil printing systems, addressing critical needs in precision electronics assembly and SMT production line integration.

The industry research and growth report includes detailed analyses of the competitive landscape of the market and information about key companies, including:

  • Amistar Automation Inc.
  • ASMPT Ltd.
  • Autotronik SMT GmbH
  • Beijing Torch Co. Ltd.
  • DDM Novastar Inc.
  • Europlacer Ltd.
  • FRITSCH GmBH
  • FUJI Corp.
  • Hanwha Precision Machinery
  • Heller Industries Inc.
  • Juki Corp.
  • Koh Young Technology Inc.
  • Kulicke and Soffa Industries
  • Mirae Corp.
  • Mycronic AB
  • Nordson Corp.
  • Panasonic Connect Co. Ltd.
  • Universal Instruments Corp.
  • Versatec LLC
  • Yamaha Motor Co. Ltd.

Qualitative and quantitative analysis of companies has been conducted to help clients understand the wider business environment as well as the strengths and weaknesses of key industry players. Data is qualitatively analyzed to categorize companies as pure play, category-focused, industry-focused, and diversified; it is quantitatively analyzed to categorize companies as dominant, leading, strong, tentative, and weak.

Recent Development and News in Surface mount technology (smt) equipment market

  • In February, 2025, ASM Pacific Technology collaborated with a prominent manufacturer of power electronics in Shenzhen to deploy a series of advanced assembly solutions that facilitate the production of high-efficiency modules for the automotive sector.
  • In March, 2025, Panasonic Connect introduced a new line of modular mounters in Tokyo that utilize artificial intelligence to optimize the placement of ultra-miniaturized components on high-density circuit boards.
  • In April, 2025, Dixon Technologies expanded its production capacity by integrating a suite of high-precision surface mount systems from Yamaha Motor Robotics into its new facility in Noida.
  • In May, 2025, JUKI officially released its new RS-2 model placement machine, which boasts a placement speed of 50,000 components per hour while maintaining high accuracy for assembling complex circuit boards.

Dive into Technavio’s robust research methodology, blending expert interviews, extensive data synthesis, and validated models for unparalleled Surface Mount Technology (SMT) Equipment Market insights. See full methodology.

Market Scope
Page number 299
Base year 2025
Historic period 2020-2024
Forecast period 2026-2030
Growth momentum & CAGR Accelerate at a CAGR of 8.1%
Market growth 2026-2030 USD 3880.4 million
Market structure Fragmented
YoY growth 2025-2026(%) 8.1%
Key countries China, Japan, South Korea, India, Australia, Singapore, US, Canada, Mexico, Germany, France, Italy, UK, Russia, Spain, UAE, Saudi Arabia, South Africa, Egypt, Israel, Brazil, Argentina and Chile
Competitive landscape Leading Companies, Market Positioning of Companies, Competitive Strategies, and Industry Risks

Request Free Sample

Research Analyst Overview

  • The Surface Mount Technology (SMT) Equipment market is fundamentally centered on PCB assembly automation, leveraging a suite of sophisticated machinery. This includes high-speed pick-and-place machines, solder paste printers, and stencil printing equipment, complemented by advanced reflow ovens and soldering equipment technology.
  • To ensure quality, automated optical inspection and automated x-ray inspection systems are integral components of modern SMT production line integration. Key advancements are seen in autonomous manufacturing solutions and the adoption of intelligent factory models that utilize real-time process monitoring and predictive analytics for manufacturing.
  • The industry is also addressing extreme component miniaturization and advanced SMT packaging through technologies like heterogeneous integration packaging and die bonding systems. The integration of predictive analytics for manufacturing has demonstrated a reduction in unscheduled downtime by up to 25%.
  • Enhanced processes such as thermal processing optimization, vacuum reflow soldering, and the use of high-force placement machines are critical for handling wide-bandgap semiconductor assembly and ensuring reliability.
  • The move toward closed-loop manufacturing systems and self-healing production lines, supported by modular assembly platforms and specialized SMT dispensing systems, SMT rework and repair tools, and conformal coating equipment, defines the sector's trajectory toward higher efficiency and precision in high-density circuit board assembly and overall electronics assembly automation.

What are the Key Data Covered in this Surface Mount Technology (SMT) Equipment Market Research and Growth Report?

  • What is the expected growth of the Surface Mount Technology (SMT) Equipment Market between 2026 and 2030?

    • USD 3.88 billion, at a CAGR of 8.1%

  • What segmentation does the market report cover?

    • The report is segmented by End-user (Telecommunication, Consumer electronics, Aerospace and defense, Automotive, and Others), Type (Placement equipment, Inspection equipment, Soldering equipment, Screen printing equipment, and Others), Component (Active components, and Passive components) and Geography (APAC, North America, Europe, Middle East and Africa, South America)

  • Which regions are analyzed in the report?

    • APAC, North America, Europe, Middle East and Africa and South America

  • What are the key growth drivers and market challenges?

    • Proliferation of electric vehicle electronics and power module assembly, Heightened geopolitical volatility and restrictive trade frameworks

  • Who are the major players in the Surface Mount Technology (SMT) Equipment Market?

    • Amistar Automation Inc., ASMPT Ltd., Autotronik SMT GmbH, Beijing Torch Co. Ltd., DDM Novastar Inc., Europlacer Ltd., FRITSCH GmBH, FUJI Corp., Hanwha Precision Machinery, Heller Industries Inc., Juki Corp., Koh Young Technology Inc., Kulicke and Soffa Industries, Mirae Corp., Mycronic AB, Nordson Corp., Panasonic Connect Co. Ltd., Universal Instruments Corp., Versatec LLC and Yamaha Motor Co. Ltd.

Market Research Insights

  • Market dynamics are increasingly shaped by the sophisticated requirements of end-use sectors. For SMT for automotive electronics, the focus is on reliability, with assembly lines for EV battery management systems achieving a 10% higher first-pass yield than standard consumer lines. In the telecommunication infrastructure space, precision is paramount.
  • The integration of advanced SMT process control software has enabled a 15% improvement in placement accuracy for high-frequency components. Across consumer electronics PCB assembly, efficiency is key, as SMT lines for high-volume production are optimized to reduce cycle times by up to 20% compared to more flexible, lower-volume setups.
  • These advancements underscore a strategic shift toward application-specific optimization, where equipment capabilities are finely tuned to meet distinct performance, reliability, and cost objectives across different manufacturing environments.

We can help! Our analysts can customize this surface mount technology (smt) equipment market research report to meet your requirements.

Get in touch

1. Executive Summary

1.1 Market overview

Executive Summary - Chart on Market Overview
Executive Summary - Data Table on Market Overview
Executive Summary - Chart on Global Market Characteristics
Executive Summary - Chart on Market by Geography
Executive Summary - Chart on Market Segmentation by End-user
Executive Summary - Chart on Market Segmentation by Type
Executive Summary - Chart on Market Segmentation by Component
Executive Summary - Chart on Incremental Growth
Executive Summary - Data Table on Incremental Growth
Executive Summary - Chart on Company Market Positioning

2. Technavio Analysis

2.1 Analysis of price sensitivity, lifecycle, customer purchase basket, adoption rates, and purchase criteria

2.2 Criticality of inputs and Factors of differentiation

Chart on Overview on criticality of inputs and factors of differentiation

2.3 Factors of disruption

Chart on Overview on factors of disruption

2.4 Impact of drivers and challenges

Chart on Impact of drivers and challenges in 2025 and 2030

3. Market Landscape

3.1 Market ecosystem

Chart on Parent Market
Data Table on - Parent Market

3.2 Market characteristics

Chart on Market characteristics analysis

3.3 Value chain analysis

Chart on Value chain analysis

4. Market Sizing

4.1 Market definition

Data Table on Offerings of companies included in the market definition

4.2 Market segment analysis

Market segments

4.3 Market size 2025

4.4 Market outlook: Forecast for 2025-2030

Chart on Global - Market size and forecast 2025-2030 ($ million)
Data Table on Global - Market size and forecast 2025-2030 ($ million)
Chart on Global Market: Year-over-year growth 2025-2030 (%)
Data Table on Global Market: Year-over-year growth 2025-2030 (%)

5. Historic Market Size

5.1 Global Surface Mount Technology (SMT) Equipment Market 2020 - 2024

Historic Market Size - Data Table on Global Surface Mount Technology (SMT) Equipment Market 2020 - 2024 ($ million)

5.2 End-user segment analysis 2020 - 2024

Historic Market Size - End-user Segment 2020 - 2024 ($ million)

5.3 Type segment analysis 2020 - 2024

Historic Market Size - Type Segment 2020 - 2024 ($ million)

5.4 Component segment analysis 2020 - 2024

Historic Market Size - Component Segment 2020 - 2024 ($ million)

5.5 Geography segment analysis 2020 - 2024

Historic Market Size - Geography Segment 2020 - 2024 ($ million)

5.6 Country segment analysis 2020 - 2024

Historic Market Size - Country Segment 2020 - 2024 ($ million)

6. Qualitative Analysis

6.1 Impact of AI on Global Surface Mount Technology (SMT) Equipment Market

6.2 Impact of Geopolitical Conflicts on Global Surface Mount Technology (SMT) Equipment Market

7. Five Forces Analysis

7.1 Five forces summary

Five forces analysis - Comparison between 2025 and 2030

7.2 Bargaining power of buyers

Bargaining power of buyers - Impact of key factors 2025 and 2030

7.3 Bargaining power of suppliers

Bargaining power of suppliers - Impact of key factors in 2025 and 2030

7.4 Threat of new entrants

Threat of new entrants - Impact of key factors in 2025 and 2030

7.5 Threat of substitutes

Threat of substitutes - Impact of key factors in 2025 and 2030

7.6 Threat of rivalry

Threat of rivalry - Impact of key factors in 2025 and 2030

7.7 Market condition

Chart on Market condition - Five forces 2025 and 2030

8. Market Segmentation by End-user

8.1 Market segments

Chart on End-user - Market share 2025-2030 (%)
Data Table on End-user - Market share 2025-2030 (%)

8.2 Comparison by End-user

Chart on Comparison by End-user
Data Table on Comparison by End-user

8.3 Telecommunication - Market size and forecast 2025-2030

Chart on Telecommunication - Market size and forecast 2025-2030 ($ million)
Data Table on Telecommunication - Market size and forecast 2025-2030 ($ million)
Chart on Telecommunication - Year-over-year growth 2025-2030 (%)
Data Table on Telecommunication - Year-over-year growth 2025-2030 (%)

8.4 Consumer electronics - Market size and forecast 2025-2030

Chart on Consumer electronics - Market size and forecast 2025-2030 ($ million)
Data Table on Consumer electronics - Market size and forecast 2025-2030 ($ million)
Chart on Consumer electronics - Year-over-year growth 2025-2030 (%)
Data Table on Consumer electronics - Year-over-year growth 2025-2030 (%)

8.5 Aerospace and defense - Market size and forecast 2025-2030

Chart on Aerospace and defense - Market size and forecast 2025-2030 ($ million)
Data Table on Aerospace and defense - Market size and forecast 2025-2030 ($ million)
Chart on Aerospace and defense - Year-over-year growth 2025-2030 (%)
Data Table on Aerospace and defense - Year-over-year growth 2025-2030 (%)

8.6 Automotive - Market size and forecast 2025-2030

Chart on Automotive - Market size and forecast 2025-2030 ($ million)
Data Table on Automotive - Market size and forecast 2025-2030 ($ million)
Chart on Automotive - Year-over-year growth 2025-2030 (%)
Data Table on Automotive - Year-over-year growth 2025-2030 (%)

8.7 Others - Market size and forecast 2025-2030

Chart on Others - Market size and forecast 2025-2030 ($ million)
Data Table on Others - Market size and forecast 2025-2030 ($ million)
Chart on Others - Year-over-year growth 2025-2030 (%)
Data Table on Others - Year-over-year growth 2025-2030 (%)

8.8 Market opportunity by End-user

Market opportunity by End-user ($ million)
Data Table on Market opportunity by End-user ($ million)

9. Market Segmentation by Type

9.1 Market segments

Chart on Type - Market share 2025-2030 (%)
Data Table on Type - Market share 2025-2030 (%)

9.2 Comparison by Type

Chart on Comparison by Type
Data Table on Comparison by Type

9.3 Placement equipment - Market size and forecast 2025-2030

Chart on Placement equipment - Market size and forecast 2025-2030 ($ million)
Data Table on Placement equipment - Market size and forecast 2025-2030 ($ million)
Chart on Placement equipment - Year-over-year growth 2025-2030 (%)
Data Table on Placement equipment - Year-over-year growth 2025-2030 (%)

9.4 Inspection equipment - Market size and forecast 2025-2030

Chart on Inspection equipment - Market size and forecast 2025-2030 ($ million)
Data Table on Inspection equipment - Market size and forecast 2025-2030 ($ million)
Chart on Inspection equipment - Year-over-year growth 2025-2030 (%)
Data Table on Inspection equipment - Year-over-year growth 2025-2030 (%)

9.5 Soldering equipment - Market size and forecast 2025-2030

Chart on Soldering equipment - Market size and forecast 2025-2030 ($ million)
Data Table on Soldering equipment - Market size and forecast 2025-2030 ($ million)
Chart on Soldering equipment - Year-over-year growth 2025-2030 (%)
Data Table on Soldering equipment - Year-over-year growth 2025-2030 (%)

9.6 Screen printing equipment - Market size and forecast 2025-2030

Chart on Screen printing equipment - Market size and forecast 2025-2030 ($ million)
Data Table on Screen printing equipment - Market size and forecast 2025-2030 ($ million)
Chart on Screen printing equipment - Year-over-year growth 2025-2030 (%)
Data Table on Screen printing equipment - Year-over-year growth 2025-2030 (%)

9.7 Others - Market size and forecast 2025-2030

Chart on Others - Market size and forecast 2025-2030 ($ million)
Data Table on Others - Market size and forecast 2025-2030 ($ million)
Chart on Others - Year-over-year growth 2025-2030 (%)
Data Table on Others - Year-over-year growth 2025-2030 (%)

9.8 Market opportunity by Type

Market opportunity by Type ($ million)
Data Table on Market opportunity by Type ($ million)

10. Market Segmentation by Component

10.1 Market segments

Chart on Component - Market share 2025-2030 (%)
Data Table on Component - Market share 2025-2030 (%)

10.2 Comparison by Component

Chart on Comparison by Component
Data Table on Comparison by Component

10.3 Active components - Market size and forecast 2025-2030

Chart on Active components - Market size and forecast 2025-2030 ($ million)
Data Table on Active components - Market size and forecast 2025-2030 ($ million)
Chart on Active components - Year-over-year growth 2025-2030 (%)
Data Table on Active components - Year-over-year growth 2025-2030 (%)

10.4 Passive components - Market size and forecast 2025-2030

Chart on Passive components - Market size and forecast 2025-2030 ($ million)
Data Table on Passive components - Market size and forecast 2025-2030 ($ million)
Chart on Passive components - Year-over-year growth 2025-2030 (%)
Data Table on Passive components - Year-over-year growth 2025-2030 (%)

10.5 Market opportunity by Component

Market opportunity by Component ($ million)
Data Table on Market opportunity by Component ($ million)

11. Customer Landscape

11.1 Customer landscape overview

Analysis of price sensitivity, lifecycle, customer purchase basket, adoption rates, and purchase criteria

12. Geographic Landscape

12.1 Geographic segmentation

Chart on Market share by geography 2025-2030 (%)
Data Table on Market share by geography 2025-2030 (%)

12.2 Geographic comparison

Chart on Geographic comparison
Data Table on Geographic comparison

12.3 APAC - Market size and forecast 2025-2030

Chart on APAC - Market size and forecast 2025-2030 ($ million)
Data Table on APAC - Market size and forecast 2025-2030 ($ million)
Chart on APAC - Year-over-year growth 2025-2030 (%)
Data Table on APAC - Year-over-year growth 2025-2030 (%)
Chart on Regional Comparison - APAC
Data Table on Regional Comparison - APAC

12.3.1 China - Market size and forecast 2025-2030

Chart on China - Market size and forecast 2025-2030 ($ million)
Data Table on China - Market size and forecast 2025-2030 ($ million)
Chart on China - Year-over-year growth 2025-2030 (%)
Data Table on China - Year-over-year growth 2025-2030 (%)

12.3.2 Japan - Market size and forecast 2025-2030

Chart on Japan - Market size and forecast 2025-2030 ($ million)
Data Table on Japan - Market size and forecast 2025-2030 ($ million)
Chart on Japan - Year-over-year growth 2025-2030 (%)
Data Table on Japan - Year-over-year growth 2025-2030 (%)

12.3.3 South Korea - Market size and forecast 2025-2030

Chart on South Korea - Market size and forecast 2025-2030 ($ million)
Data Table on South Korea - Market size and forecast 2025-2030 ($ million)
Chart on South Korea - Year-over-year growth 2025-2030 (%)
Data Table on South Korea - Year-over-year growth 2025-2030 (%)

12.3.4 India - Market size and forecast 2025-2030

Chart on India - Market size and forecast 2025-2030 ($ million)
Data Table on India - Market size and forecast 2025-2030 ($ million)
Chart on India - Year-over-year growth 2025-2030 (%)
Data Table on India - Year-over-year growth 2025-2030 (%)

12.3.5 Australia - Market size and forecast 2025-2030

Chart on Australia - Market size and forecast 2025-2030 ($ million)
Data Table on Australia - Market size and forecast 2025-2030 ($ million)
Chart on Australia - Year-over-year growth 2025-2030 (%)
Data Table on Australia - Year-over-year growth 2025-2030 (%)

12.3.6 Singapore - Market size and forecast 2025-2030

Chart on Singapore - Market size and forecast 2025-2030 ($ million)
Data Table on Singapore - Market size and forecast 2025-2030 ($ million)
Chart on Singapore - Year-over-year growth 2025-2030 (%)
Data Table on Singapore - Year-over-year growth 2025-2030 (%)

12.4 North America - Market size and forecast 2025-2030

Chart on North America - Market size and forecast 2025-2030 ($ million)
Data Table on North America - Market size and forecast 2025-2030 ($ million)
Chart on North America - Year-over-year growth 2025-2030 (%)
Data Table on North America - Year-over-year growth 2025-2030 (%)
Chart on Regional Comparison - North America
Data Table on Regional Comparison - North America

12.4.1 US - Market size and forecast 2025-2030

Chart on US - Market size and forecast 2025-2030 ($ million)
Data Table on US - Market size and forecast 2025-2030 ($ million)
Chart on US - Year-over-year growth 2025-2030 (%)
Data Table on US - Year-over-year growth 2025-2030 (%)

12.4.2 Canada - Market size and forecast 2025-2030

Chart on Canada - Market size and forecast 2025-2030 ($ million)
Data Table on Canada - Market size and forecast 2025-2030 ($ million)
Chart on Canada - Year-over-year growth 2025-2030 (%)
Data Table on Canada - Year-over-year growth 2025-2030 (%)

12.4.3 Mexico - Market size and forecast 2025-2030

Chart on Mexico - Market size and forecast 2025-2030 ($ million)
Data Table on Mexico - Market size and forecast 2025-2030 ($ million)
Chart on Mexico - Year-over-year growth 2025-2030 (%)
Data Table on Mexico - Year-over-year growth 2025-2030 (%)

12.5 Europe - Market size and forecast 2025-2030

Chart on Europe - Market size and forecast 2025-2030 ($ million)
Data Table on Europe - Market size and forecast 2025-2030 ($ million)
Chart on Europe - Year-over-year growth 2025-2030 (%)
Data Table on Europe - Year-over-year growth 2025-2030 (%)
Chart on Regional Comparison - Europe
Data Table on Regional Comparison - Europe

12.5.1 Germany - Market size and forecast 2025-2030

Chart on Germany - Market size and forecast 2025-2030 ($ million)
Data Table on Germany - Market size and forecast 2025-2030 ($ million)
Chart on Germany - Year-over-year growth 2025-2030 (%)
Data Table on Germany - Year-over-year growth 2025-2030 (%)

12.5.2 France - Market size and forecast 2025-2030

Chart on France - Market size and forecast 2025-2030 ($ million)
Data Table on France - Market size and forecast 2025-2030 ($ million)
Chart on France - Year-over-year growth 2025-2030 (%)
Data Table on France - Year-over-year growth 2025-2030 (%)

12.5.3 Italy - Market size and forecast 2025-2030

Chart on Italy - Market size and forecast 2025-2030 ($ million)
Data Table on Italy - Market size and forecast 2025-2030 ($ million)
Chart on Italy - Year-over-year growth 2025-2030 (%)
Data Table on Italy - Year-over-year growth 2025-2030 (%)

12.5.4 UK - Market size and forecast 2025-2030

Chart on UK - Market size and forecast 2025-2030 ($ million)
Data Table on UK - Market size and forecast 2025-2030 ($ million)
Chart on UK - Year-over-year growth 2025-2030 (%)
Data Table on UK - Year-over-year growth 2025-2030 (%)

12.5.5 Russia - Market size and forecast 2025-2030

Chart on Russia - Market size and forecast 2025-2030 ($ million)
Data Table on Russia - Market size and forecast 2025-2030 ($ million)
Chart on Russia - Year-over-year growth 2025-2030 (%)
Data Table on Russia - Year-over-year growth 2025-2030 (%)

12.5.6 Spain - Market size and forecast 2025-2030

Chart on Spain - Market size and forecast 2025-2030 ($ million)
Data Table on Spain - Market size and forecast 2025-2030 ($ million)
Chart on Spain - Year-over-year growth 2025-2030 (%)
Data Table on Spain - Year-over-year growth 2025-2030 (%)

12.6 Middle East and Africa - Market size and forecast 2025-2030

Chart on Middle East and Africa - Market size and forecast 2025-2030 ($ million)
Data Table on Middle East and Africa - Market size and forecast 2025-2030 ($ million)
Chart on Middle East and Africa - Year-over-year growth 2025-2030 (%)
Data Table on Middle East and Africa - Year-over-year growth 2025-2030 (%)
Chart on Regional Comparison - Middle East and Africa
Data Table on Regional Comparison - Middle East and Africa

12.6.1 UAE - Market size and forecast 2025-2030

Chart on UAE - Market size and forecast 2025-2030 ($ million)
Data Table on UAE - Market size and forecast 2025-2030 ($ million)
Chart on UAE - Year-over-year growth 2025-2030 (%)
Data Table on UAE - Year-over-year growth 2025-2030 (%)

12.6.2 Saudi Arabia - Market size and forecast 2025-2030

Chart on Saudi Arabia - Market size and forecast 2025-2030 ($ million)
Data Table on Saudi Arabia - Market size and forecast 2025-2030 ($ million)
Chart on Saudi Arabia - Year-over-year growth 2025-2030 (%)
Data Table on Saudi Arabia - Year-over-year growth 2025-2030 (%)

12.6.3 South Africa - Market size and forecast 2025-2030

Chart on South Africa - Market size and forecast 2025-2030 ($ million)
Data Table on South Africa - Market size and forecast 2025-2030 ($ million)
Chart on South Africa - Year-over-year growth 2025-2030 (%)
Data Table on South Africa - Year-over-year growth 2025-2030 (%)

12.6.4 Egypt - Market size and forecast 2025-2030

Chart on Egypt - Market size and forecast 2025-2030 ($ million)
Data Table on Egypt - Market size and forecast 2025-2030 ($ million)
Chart on Egypt - Year-over-year growth 2025-2030 (%)
Data Table on Egypt - Year-over-year growth 2025-2030 (%)

12.6.5 Israel - Market size and forecast 2025-2030

Chart on Israel - Market size and forecast 2025-2030 ($ million)
Data Table on Israel - Market size and forecast 2025-2030 ($ million)
Chart on Israel - Year-over-year growth 2025-2030 (%)
Data Table on Israel - Year-over-year growth 2025-2030 (%)

12.7 South America - Market size and forecast 2025-2030

Chart on South America - Market size and forecast 2025-2030 ($ million)
Data Table on South America - Market size and forecast 2025-2030 ($ million)
Chart on South America - Year-over-year growth 2025-2030 (%)
Data Table on South America - Year-over-year growth 2025-2030 (%)
Chart on Regional Comparison - South America
Data Table on Regional Comparison - South America

12.7.1 Brazil - Market size and forecast 2025-2030

Chart on Brazil - Market size and forecast 2025-2030 ($ million)
Data Table on Brazil - Market size and forecast 2025-2030 ($ million)
Chart on Brazil - Year-over-year growth 2025-2030 (%)
Data Table on Brazil - Year-over-year growth 2025-2030 (%)

12.7.2 Argentina - Market size and forecast 2025-2030

Chart on Argentina - Market size and forecast 2025-2030 ($ million)
Data Table on Argentina - Market size and forecast 2025-2030 ($ million)
Chart on Argentina - Year-over-year growth 2025-2030 (%)
Data Table on Argentina - Year-over-year growth 2025-2030 (%)

12.7.3 Chile - Market size and forecast 2025-2030

Chart on Chile - Market size and forecast 2025-2030 ($ million)
Data Table on Chile - Market size and forecast 2025-2030 ($ million)
Chart on Chile - Year-over-year growth 2025-2030 (%)
Data Table on Chile - Year-over-year growth 2025-2030 (%)

12.8 Market opportunity by geography

Market opportunity by geography ($ million)
Data Tables on Market opportunity by geography ($ million)

13. Drivers, Challenges, and Opportunity

13.1 Market drivers

Proliferation of electric vehicle electronics and power module assembly
Integration of AI and autonomous manufacturing solutions
Acceleration of high-performance computing and advanced packaging requirements

13.2 Market challenges

Heightened geopolitical volatility and restrictive trade frameworks
Severe scarcity of specialized technical talent and advanced engineering labor
Technological complexities associated with extreme miniaturization and thermal management

13.3 Impact of drivers and challenges

Impact of drivers and challenges in 2025 and 2030

13.4 Market opportunities

Evolution of autonomous closed-loop manufacturing and self-healing production lines
Convergence of semiconductor packaging and SMT through heterogeneous integration
Optimization of thermal processing for next-generation power electronics

14. Competitive Landscape

14.1 Overview

14.2

Overview on criticality of inputs and factors of differentiation

14.3 Landscape disruption

Overview on factors of disruption

14.4 Industry risks

Impact of key risks on business

15. Competitive Analysis

15.1 Companies profiled

Companies covered

15.2 Company ranking index

15.3 Market positioning of companies

Matrix on companies position and classification

15.4 Amistar Automation Inc.

Amistar Automation Inc. - Overview
Amistar Automation Inc. - Product / Service
Amistar Automation Inc. - Key offerings
SWOT

15.5 ASMPT Ltd.

ASMPT Ltd. - Overview
ASMPT Ltd. - Business segments
ASMPT Ltd. - Key offerings
ASMPT Ltd. - Segment focus
SWOT

15.6 Autotronik SMT GmbH

Autotronik SMT GmbH - Overview
Autotronik SMT GmbH - Product / Service
Autotronik SMT GmbH - Key offerings
SWOT

15.7 DDM Novastar Inc.

DDM Novastar Inc. - Overview
DDM Novastar Inc. - Product / Service
DDM Novastar Inc. - Key offerings
SWOT

15.8 Europlacer Ltd.

Europlacer Ltd. - Overview
Europlacer Ltd. - Product / Service
Europlacer Ltd. - Key offerings
SWOT

15.9 FRITSCH GmBH

FRITSCH GmBH - Overview
FRITSCH GmBH - Product / Service
FRITSCH GmBH - Key offerings
SWOT

15.10 FUJI Corp.

FUJI Corp. - Overview
FUJI Corp. - Business segments
FUJI Corp. - Key offerings
FUJI Corp. - Segment focus
SWOT

15.11 Juki Corp.

Juki Corp. - Overview
Juki Corp. - Business segments
Juki Corp. - Key offerings
Juki Corp. - Segment focus
SWOT

15.12 Koh Young Technology Inc.

Koh Young Technology Inc. - Overview
Koh Young Technology Inc. - Product / Service
Koh Young Technology Inc. - Key offerings
SWOT

15.13 Kulicke and Soffa Industries

Kulicke and Soffa Industries - Overview
Kulicke and Soffa Industries - Business segments
Kulicke and Soffa Industries - Key offerings
Kulicke and Soffa Industries - Segment focus
SWOT

15.14 Mirae Corp.

Mirae Corp. - Overview
Mirae Corp. - Product / Service
Mirae Corp. - Key offerings
SWOT

15.15 Mycronic AB

Mycronic AB - Overview
Mycronic AB - Business segments
Mycronic AB - Key offerings
Mycronic AB - Segment focus
SWOT

15.16 Nordson Corp.

Nordson Corp. - Overview
Nordson Corp. - Business segments
Nordson Corp. - Key offerings
Nordson Corp. - Segment focus
SWOT

15.17 Panasonic Connect Co. Ltd.

Panasonic Connect Co. Ltd. - Overview
Panasonic Connect Co. Ltd. - Product / Service
Panasonic Connect Co. Ltd. - Key offerings
SWOT

15.18 Yamaha Motor Co. Ltd.

Yamaha Motor Co. Ltd. - Overview
Yamaha Motor Co. Ltd. - Business segments
Yamaha Motor Co. Ltd. - Key offerings
Yamaha Motor Co. Ltd. - Segment focus
SWOT

16. Appendix

16.1 Scope of the report

Market definition
Objectives
Notes and caveats

16.2 Inclusions and exclusions checklist

Inclusions checklist
Exclusions checklist

16.3 Currency conversion rates for US$

16.4 Research methodology

16.5 Data procurement

Information sources

16.6 Data validation

16.7 Validation techniques employed for market sizing

16.8 Data synthesis

16.9 360 degree market analysis

16.10 List of abbreviations

Research Methodology

Technavio presents a detailed picture of the market by way of study, synthesis, and summation of data from multiple sources. The analysts have presented the various facets of the market with a particular focus on identifying the key industry influencers. The data thus presented is comprehensive, reliable, and the result of extensive research, both primary and secondary.

INFORMATION SOURCES

Primary sources

  • Manufacturers and suppliers
  • Channel partners
  • Industry experts
  • Strategic decision makers

Secondary sources

  • Industry journals and periodicals
  • Government data
  • Financial reports of key industry players
  • Historical data
  • Press releases

DATA ANALYSIS

Data Synthesis

  • Collation of data
  • Estimation of key figures
  • Analysis of derived insights

Data Validation

  • Triangulation with data models
  • Reference against proprietary databases
  • Corroboration with industry experts

REPORT WRITING

Qualitative

  • Market drivers
  • Market challenges
  • Market trends
  • Five forces analysis

Quantitative

  • Market size and forecast
  • Market segmentation
  • Geographical insights
  • Competitive landscape

Interested in this report?

Get your sample now to see our research methodology and insights!

Download Now

Frequently Asked Questions

Surface Mount Technology (SMT) Equipment market growth will increase by USD 3880.4 million during 2026-2030.

The Surface Mount Technology (SMT) Equipment market is expected to grow at a CAGR of 8.1% during 2026-2030.

Surface Mount Technology (SMT) Equipment market is segmented by End-user (Telecommunication, Consumer electronics, Aerospace and defense, Automotive, Others) Type (Placement equipment, Inspection equipment, Soldering equipment, Screen printing equipment, Others) Component (Active components, Passive components)

Amistar Automation Inc., ASMPT Ltd., Autotronik SMT GmbH, Beijing Torch Co. Ltd., DDM Novastar Inc., Europlacer Ltd., FRITSCH GmBH, FUJI Corp., Hanwha Precision Machinery, Heller Industries Inc., Juki Corp., Koh Young Technology Inc., Kulicke and Soffa Industries, Mirae Corp., Mycronic AB, Nordson Corp., Panasonic Connect Co. Ltd., Universal Instruments Corp., Versatec LLC, Yamaha Motor Co. Ltd. are a few of the key vendors in the Surface Mount Technology (SMT) Equipment market.

APAC will register the highest growth rate of 43.5% among the other regions. Therefore, the Surface Mount Technology (SMT) Equipment market in APAC is expected to garner significant business opportunities for the vendors during the forecast period.

China, Japan, South Korea, India, Australia, Singapore, US, Canada, Mexico, Germany, France, Italy, UK, Russia, Spain, UAE, Saudi Arabia, South Africa, Egypt, Israel, Brazil, Argentina, Chile

  • Proliferation of electric vehicle electronics and power module assembly is the driving factor this market.

The Surface Mount Technology (SMT) Equipment market vendors should focus on grabbing business opportunities from the End-user segment as it accounted for the largest market share in the base year.
RIA - Research AI Assistant
Ask RIA