Swaging Machines Market Analysis APAC, Europe, North America, South America, Middle East and Africa - US, China, Japan, Germany, UK - Size and Forecast 2024-2028

Swaging Machines Market Analysis APAC, Europe, North America, South America, Middle East and Africa - US, China, Japan, Germany, UK - Size and Forecast 2024-2028

Published: Dec 2023 170 Pages SKU: IRTNTR77111

Market Overview at a Glance

$1.24 B
Market Opportunity
4.7%
CAGR
4.21
YoY growth 2023-2024(%)

Swaging Machines Market 2024-2028

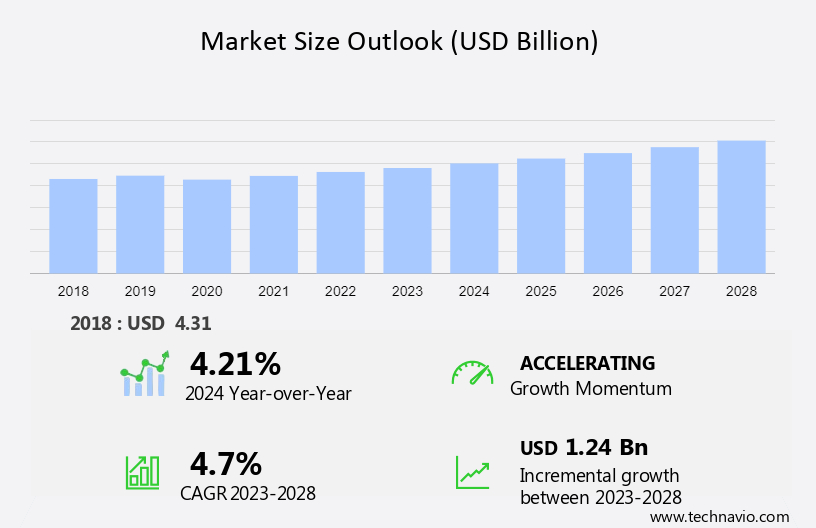
The swaging machines market size is forecast to increase by USD 1.24 billion, at a CAGR of 4.7% between 2023 and 2028. The growth rate of the market depends on several factors such as the increased demand for swaging machines for automobiles, the rising demand for swaging machines in aerospace, and the rise in construction activities in developing countries.

The report offers extensive research analysis on the Swaging Machines Market, with a categorization based on Product, including radial swaging machine, rotary swaging machine, hydraulic swaging machine, and others. It further segments the market by Application, encompassing automotive, machinery and equipment, chemical and materials, and others. Additionally, the report provides Region segmentation, covering APAC, Europe, North America, Middle East and Africa, and South America. Market size, historical data (2018-2022), and future projections are presented in terms of value (in USD billion) for all the mentioned segments.

Swaging Machines Market Forecasting

Swaging Machines Market Size

Swaging Machines Market Forecast 2023-2027

To learn more about this report,  Request Free Sample

Swaging Machines Market Dynamics

Our researchers studied the data for years, with 2023 as the base year and 2024 as the estimated year, and presented the key drivers, trends, and challenges for the market. Although there has been a disruption in the swaging machines market growth during the COVID-19 pandemic, a holistic analysis of drivers, trends, and challenges will help companies refine marketing strategies to gain a competitive advantage.    

Driver - Increased demand for swaging machines for automobiles

Swaging machines are increasingly used in the automobile industry to manufacture precision-formed components for various applications, including axles, drive shafts, and structural elements, contributing to enhanced performance and efficiency. In addition, the door beams, seat frames, side sills, and suspension arms are required to be shaped to a specific dimension, which is achieved with the use of swaging machines during the metal cutting stage.

Moreover, swaging machines in EVs are used to shape and form precision components crucial for the performance and efficiency of EVs. In addition, applications include manufacturing parts for the steering system, suspension components, drive shafts, fasteners, and other critical elements that contribute to the overall reliability and functionality of electric vehicles. Hence, such factors are driving the market growth during the forecast period.

Trends - Increasing use of swaging machines in furniture industry

The increasing use of swaging machines in the furniture industry is contributing to the expansion of the global swaging machines market. In addition, swaging machines are employed in the production of tubes and frames for furniture, ensuring precision and strength in the construction of chairs, tables, and other pieces.

Moreover, swaging is crucial for forming metal components used in furniture, enhancing the durability and structural integrity of items like chair legs and supports. In addition, swaging allows for diverse design options, enabling the creation of intricate patterns and shapes in metal furniture components, meeting the evolving demands of the furniture industry.  Furthermore, swaging contributes to efficient mass production in the furniture sector, optimizing material usage and manufacturing processes for increased productivity. Hence, such factors are driving the market growth during the forecast period.

Challenge - Lack of skilled labor to operate swaging machines

Swaging machines are essentially sophisticated pieces of equipment that require skilled operators to ensure precision and avoid errors. However, the lack of skilled labor can lead to suboptimal machine performance, increased downtime, and higher chances of defects in manufactured products. In addition, training workers to operate swaging machines proficiently involves costs for both time and resources.

Moreover, the shortage of skilled labor increases the training burden on companies, negatively impacting their ability to quickly scale up production or adapt to changing market demands. In addition, as swaging machine technology evolves, the demand for workers with up-to-date skills also increases. Furthermore, the shortage of skilled labor can slow down the adoption of advanced technologies in swaging machines, limiting the ability to stay competitive in the market. Hence, such factors are hindering the market growth during the forecast period.

Swaging Machines Market Segmentation by Product, Application, and Geography

Product Segment Analysis:

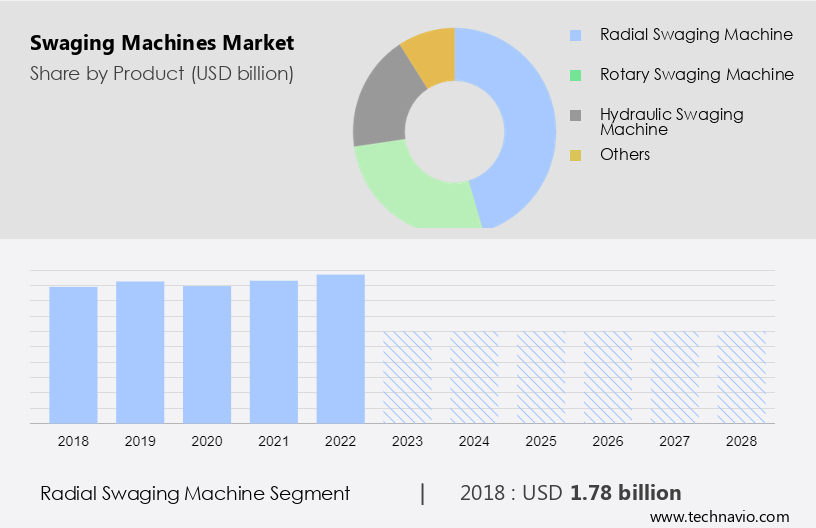
The radial swaging machine segment is estimated to witness significant growth during the forecast period. A radial swaging machine segment is essentially a metalworking tool designed for the precision deformation of cylindrical workpieces. In addition, it operates by using rotating dies to apply radial force, compressing and shaping the material. Furthermore, this process is particularly useful for reducing the diameter of tubes or rods, creating tapered shapes, or forming intricate patterns.

Swaging Machines Market Size

Customised Report as per your requirements!

The radial swaging machine segment was the largest segment and was valued at USD 1.78 billion in 2018. Moreover, radial swaging is commonly used on various metals, including aluminum, steel, copper, and alloys. It is suitable for forming tubes, pipes, and rods to achieve precise dimensions. In addition, radial swaging is employed in various industries, including aerospace, automotive, and manufacturing, to produce components with specific geometrical characteristics. Furthermore, common applications of radial swaging machines include the production of tapered components, flaring, reducing diameters, and forming intricate patterns. Hence, such factors are fuelling the growth of this segment which in turn drives the market growth during the forecast period.

Application Segment Analysis:

Based on the application, the segment is classified into automotive, machinery and equipment, chemical and materials, and others. The automotive segment will account for the largest share of this segment Swaging machines find various applications in the automotive industry, contributing to the manufacturing of various components. In addition, swaging is used in the production of components for the automotive steering system. Moreover, this includes shaping parts like tie rods and steering shafts with precision to ensure reliable and responsive steering. In addition, components of the suspension system, such as control arms and sway bars, may undergo swaging to achieve specific shapes and dimensions. As a result, this contributes to the overall stability and handling of vehicles. Hence, such factors are fuelling the growth of this segment which in turn drives the market growth during the forecast period.

Regional Analysis

Swaging Machines Market Share by Geography

For more insights on the market share of various regions Download Sample PDF now!

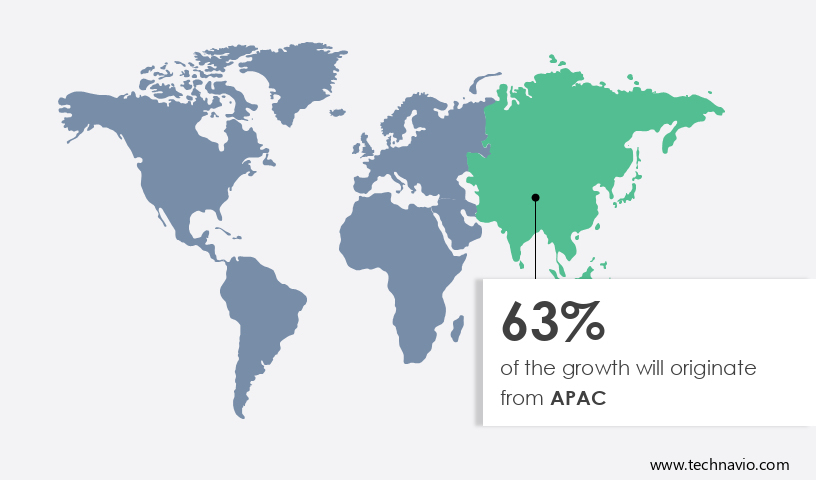
APAC is estimated to contribute 63% to the growth by 2028. Technavio’s analysts have elaborately explained the regional trends, drivers, and challenges that are expected to shape the swaging machines market growth analysis during the forecast period. Factors such as the rising number of industries in India, China, Vietnam, and Japan, especially the manufacturing base for consumer electronics and automotive, will fuel the demand for swaging machines in the region. In addition, the construction industry plays a vital role in the region in fuelling the market for swaging machines. Moreover, APAC includes developing economies like China, India, Japan, and Indonesia. Furthermore, a significant rate of urbanization is expected to play a vital role in the growth of the market in the region. Hence, such factors are driving the market growth in APAC during the forecast period.

Who are the Major Swaging Machines Market Companies?

Companies are implementing various strategies, such as strategic alliances, partnerships, mergers and acquisitions, geographical expansion, and product/service launches, to enhance their presence in the market.

CENTRAL WIRE INDUSTRIES: The company offers swaging machines such as Locoloc 1 P Pneumatic Swager, Locoloc 5 H Hydraulic.

We also have detailed analyses of the market’s competitive landscape and offer information on 20 market companies, including:

Chant Engineering Co. Inc., Deep Industrial Corp., FENN, Gold International Machinery Corp., Kuriyama of America Inc., Micro Hydro Technic Pvt. Ltd., Patson Machines Pvt. Ltd., RAS Reinhardt Maschinenbau GmbH, SAHM SPLICE GmbH, Scorpion Equipment, Shuz Tung Machinery Industrial Co. Ltd., Simpletec Automatics Pvt. Ltd., Talurit Group, The Weir Group Plc, Victory Machinery Corp., Yashwant Industries, SLS Machinery Co. Ltd., HOREN INDUSTRIAL Co. Ltd., and Fichter formtec GmbH.

Technavio swaging machines market research report provides an in-depth analysis of the market and its players through combined qualitative and quantitative data. The analysis classifies companies into categories based on their business approaches, including pure-play, category-focused, industry-focused, and diversified. Companies are specially categorized into dominant, leading, strong, tentative, and weak, based on their quantitative data analysis.  

Segment Overview

The swaging machines market analysis and the report forecasts market growth by revenue at global, regional & country levels and provides an analysis of the latest trends and growth opportunities from 2018 to 2028. 

  • Product Outlook
    • Radial swaging machine
    • Rotary swaging machine
    • Hydraulic swaging machine
    • Others
  • Application Outlook
    • Automotive
    • Machinery and equipment
    • Chemical and materials
    • Others
  • Geography Outlook
    • North America
      • The U.S.
      • Canada
    • Europe
      • The U.K.
      • Germany
      • France
      • Rest of Europe
    • APAC
      • China
      • India
    • South America
      • Chile
      • Argentina
      • Brazil
    • Middle East & Africa
      • Saudi Arabia
      • South Africa
      • Rest of the Middle East & Africa

Swaging Machines Market Scope

Report Coverage

Details

Page number

170

Base year

2023

Historic period

2018-2022

Forecast period

2024-2028

Growth momentum & CAGR

Accelerate at a CAGR of 4.7%

Market growth 2024-2028

USD 1.24 billion

Market structure

Fragmented

YoY growth 2023-2024(%)

4.21

Regional analysis

APAC, Europe, North America, South America, and Middle East and Africa

Performing market contribution

APAC at 63%

Key countries

US, China, Japan, Germany, and UK

Competitive landscape

Leading Companies, Market Positioning of Companies, Competitive Strategies, and Industry Risks

Key companies profiled

CENTRAL WIRE INDUSTRIES, Chant Engineering Co. Inc., Deep Industrial Corp., FENN, Gold International Machinery Corp., Kuriyama of America Inc., Micro Hydro Technic Pvt. Ltd., Patson Machines Pvt. Ltd., RAS Reinhardt Maschinenbau GmbH, SAHM SPLICE GmbH, Scorpion Equipment, Shuz Tung Machinery Industrial Co. Ltd., Simpletec Automatics Pvt. Ltd., Talurit Group, The Weir Group Plc, Victory Machinery Corp., Yashwant Industries, SLS Machinery Co. Ltd., HOREN INDUSTRIAL Co. Ltd., and Fichter formtec GmbH

Market dynamics

Parent market analysis, Market growth inducers and obstacles, Fast-growing and slow-growing segment analysis, COVID-19 impact and recovery analysis and future consumer dynamics, Market condition analysis for the forecast period

Customization purview

If our report has not included the data that you are looking for, you can reach out to our analysts and get segments customized.

Request Sample PDF 

What are the Key Data Covered in this Swaging Machines Market Research Report?

  • CAGR of the market during the forecast period
  • Detailed information on factors that will drive the growth of the swaging machines market between 2024 and 2028
  • Precise estimation of the swaging machines market growth and trends and its contribution to the market in focus on the parent market
  • Accurate predictions about upcoming swaging machines market trends and analysis and changes in consumer behavior
  • swaging machines market growth and forecasting across APAC, Europe, North America, South America, and Middle East and Africa
  • A thorough analysis of the market’s competitive landscape and detailed information about companies
  • Comprehensive analysis of factors that will challenge the growth of swaging machines market companies

We can help! Our analysts can customize this market research report to meet your requirements. Get in touch

1 Executive Summary

  • 1.1 Market overview
    • Exhibit 01: Executive Summary – Chart on Market Overview
    • Exhibit 02: Executive Summary – Data Table on Market Overview
    • Exhibit 03: Executive Summary – Chart on Global Market Characteristics
    • Exhibit 04: Executive Summary – Chart on Market by Geography
    • Exhibit 05: Executive Summary – Chart on Market Segmentation by Product
    • Exhibit 06: Executive Summary – Chart on Market Segmentation by Application
    • Exhibit 07: Executive Summary – Chart on Incremental Growth
    • Exhibit 08: Executive Summary – Data Table on Incremental Growth
    • Exhibit 09: Executive Summary – Chart on Vendor Market Positioning

2 Market Landscape

  • 2.1 Market ecosystem
    • Exhibit 10: Parent market
    • Exhibit 11: Market Characteristics

3 Market Sizing

  • 3.1 Market definition
    • Exhibit 12: Offerings of vendors included in the market definition
  • 3.2 Market segment analysis
    • Exhibit 13: Market segments
  • 3.3 Market size 2023
    • 3.4 Market outlook: Forecast for 2023-2028
      • Exhibit 14: Chart on Global - Market size and forecast 2023-2028 ($ billion)
      • Exhibit 15: Data Table on Global - Market size and forecast 2023-2028 ($ billion)
      • Exhibit 16: Chart on Global Market: Year-over-year growth 2023-2028 (%)
      • Exhibit 17: Data Table on Global Market: Year-over-year growth 2023-2028 (%)

    4 Historic Market Size

    • 4.1 Global swaging machines market 2018 - 2022
      • Exhibit 18: Historic Market Size – Data Table on global swaging machines market 2018 - 2022 ($ billion)
    • 4.2 Product Segment Analysis 2018 - 2022
      • Exhibit 19: Historic Market Size – Product Segment 2018 - 2022 ($ billion)
    • 4.3 Application Segment Analysis 2018 - 2022
      • Exhibit 20: Historic Market Size – Application Segment 2018 - 2022 ($ billion)
    • 4.4 Geography Segment Analysis 2018 - 2022
      • Exhibit 21: Historic Market Size – Geography Segment 2018 - 2022 ($ billion)
    • 4.5 Country Segment Analysis 2018 - 2022
      • Exhibit 22: Historic Market Size – Country Segment 2018 - 2022 ($ billion)

    5 Five Forces Analysis

    • 5.1 Five forces summary
      • Exhibit 23: Five forces analysis - Comparison between 2023 and 2028
    • 5.2 Bargaining power of buyers
      • Exhibit 24: Chart on Bargaining power of buyers – Impact of key factors 2023 and 2028
    • 5.3 Bargaining power of suppliers
      • Exhibit 25: Bargaining power of suppliers – Impact of key factors in 2023 and 2028
    • 5.4 Threat of new entrants
      • Exhibit 26: Threat of new entrants – Impact of key factors in 2023 and 2028
    • 5.5 Threat of substitutes
      • Exhibit 27: Threat of substitutes – Impact of key factors in 2023 and 2028
    • 5.6 Threat of rivalry
      • Exhibit 28: Threat of rivalry – Impact of key factors in 2023 and 2028
    • 5.7 Market condition
      • Exhibit 29: Chart on Market condition - Five forces 2023 and 2028

    6 Market Segmentation by Product

    • 6.1 Market segments
      • Exhibit 30: Chart on Product - Market share 2023-2028 (%)
      • Exhibit 31: Data Table on Product - Market share 2023-2028 (%)
    • 6.2 Comparison by Product
      • Exhibit 32: Chart on Comparison by Product
      • Exhibit 33: Data Table on Comparison by Product
    • 6.3 Radial swaging machine - Market size and forecast 2023-2028
      • Exhibit 34: Chart on Radial swaging machine - Market size and forecast 2023-2028 ($ billion)
      • Exhibit 35: Data Table on Radial swaging machine - Market size and forecast 2023-2028 ($ billion)
      • Exhibit 36: Chart on Radial swaging machine - Year-over-year growth 2023-2028 (%)
      • Exhibit 37: Data Table on Radial swaging machine - Year-over-year growth 2023-2028 (%)
    • 6.4 Rotary swaging machine - Market size and forecast 2023-2028
      • Exhibit 38: Chart on Rotary swaging machine - Market size and forecast 2023-2028 ($ billion)
      • Exhibit 39: Data Table on Rotary swaging machine - Market size and forecast 2023-2028 ($ billion)
      • Exhibit 40: Chart on Rotary swaging machine - Year-over-year growth 2023-2028 (%)
      • Exhibit 41: Data Table on Rotary swaging machine - Year-over-year growth 2023-2028 (%)
    • 6.5 Hydraulic swaging machine - Market size and forecast 2023-2028
      • Exhibit 42: Chart on Hydraulic swaging machine - Market size and forecast 2023-2028 ($ billion)
      • Exhibit 43: Data Table on Hydraulic swaging machine - Market size and forecast 2023-2028 ($ billion)
      • Exhibit 44: Chart on Hydraulic swaging machine - Year-over-year growth 2023-2028 (%)
      • Exhibit 45: Data Table on Hydraulic swaging machine - Year-over-year growth 2023-2028 (%)
    • 6.6 Others - Market size and forecast 2023-2028
      • Exhibit 46: Chart on Others - Market size and forecast 2023-2028 ($ billion)
      • Exhibit 47: Data Table on Others - Market size and forecast 2023-2028 ($ billion)
      • Exhibit 48: Chart on Others - Year-over-year growth 2023-2028 (%)
      • Exhibit 49: Data Table on Others - Year-over-year growth 2023-2028 (%)
    • 6.7 Market opportunity by Product
      • Exhibit 50: Market opportunity by Product ($ billion)
      • Exhibit 51: Data Table on Market opportunity by Product ($ billion)

    7 Market Segmentation by Application

    • 7.1 Market segments
      • Exhibit 52: Chart on Application - Market share 2023-2028 (%)
      • Exhibit 53: Data Table on Application - Market share 2023-2028 (%)
    • 7.2 Comparison by Application
      • Exhibit 54: Chart on Comparison by Application
      • Exhibit 55: Data Table on Comparison by Application
    • 7.3 Automotive - Market size and forecast 2023-2028
      • Exhibit 56: Chart on Automotive - Market size and forecast 2023-2028 ($ billion)
      • Exhibit 57: Data Table on Automotive - Market size and forecast 2023-2028 ($ billion)
      • Exhibit 58: Chart on Automotive - Year-over-year growth 2023-2028 (%)
      • Exhibit 59: Data Table on Automotive - Year-over-year growth 2023-2028 (%)
    • 7.4 Machinery and equipment - Market size and forecast 2023-2028
      • Exhibit 60: Chart on Machinery and equipment - Market size and forecast 2023-2028 ($ billion)
      • Exhibit 61: Data Table on Machinery and equipment - Market size and forecast 2023-2028 ($ billion)
      • Exhibit 62: Chart on Machinery and equipment - Year-over-year growth 2023-2028 (%)
      • Exhibit 63: Data Table on Machinery and equipment - Year-over-year growth 2023-2028 (%)
    • 7.5 Chemical and materials - Market size and forecast 2023-2028
      • Exhibit 64: Chart on Chemical and materials - Market size and forecast 2023-2028 ($ billion)
      • Exhibit 65: Data Table on Chemical and materials - Market size and forecast 2023-2028 ($ billion)
      • Exhibit 66: Chart on Chemical and materials - Year-over-year growth 2023-2028 (%)
      • Exhibit 67: Data Table on Chemical and materials - Year-over-year growth 2023-2028 (%)
    • 7.6 Others - Market size and forecast 2023-2028
      • Exhibit 68: Chart on Others - Market size and forecast 2023-2028 ($ billion)
      • Exhibit 69: Data Table on Others - Market size and forecast 2023-2028 ($ billion)
      • Exhibit 70: Chart on Others - Year-over-year growth 2023-2028 (%)
      • Exhibit 71: Data Table on Others - Year-over-year growth 2023-2028 (%)
    • 7.7 Market opportunity by Application
      • Exhibit 72: Market opportunity by Application ($ billion)
      • Exhibit 73: Data Table on Market opportunity by Application ($ billion)

    8 Customer Landscape

    • 8.1 Customer landscape overview
      • Exhibit 74: Analysis of price sensitivity, lifecycle, customer purchase basket, adoption rates, and purchase criteria

    9 Geographic Landscape

    • 9.1 Geographic segmentation
      • Exhibit 75: Chart on Market share by geography 2023-2028 (%)
      • Exhibit 76: Data Table on Market share by geography 2023-2028 (%)
    • 9.2 Geographic comparison
      • Exhibit 77: Chart on Geographic comparison
      • Exhibit 78: Data Table on Geographic comparison
    • 9.3 APAC - Market size and forecast 2023-2028
      • Exhibit 79: Chart on APAC - Market size and forecast 2023-2028 ($ billion)
      • Exhibit 80: Data Table on APAC - Market size and forecast 2023-2028 ($ billion)
      • Exhibit 81: Chart on APAC - Year-over-year growth 2023-2028 (%)
      • Exhibit 82: Data Table on APAC - Year-over-year growth 2023-2028 (%)
    • 9.4 Europe - Market size and forecast 2023-2028
      • Exhibit 83: Chart on Europe - Market size and forecast 2023-2028 ($ billion)
      • Exhibit 84: Data Table on Europe - Market size and forecast 2023-2028 ($ billion)
      • Exhibit 85: Chart on Europe - Year-over-year growth 2023-2028 (%)
      • Exhibit 86: Data Table on Europe - Year-over-year growth 2023-2028 (%)
    • 9.5 North America - Market size and forecast 2023-2028
      • Exhibit 87: Chart on North America - Market size and forecast 2023-2028 ($ billion)
      • Exhibit 88: Data Table on North America - Market size and forecast 2023-2028 ($ billion)
      • Exhibit 89: Chart on North America - Year-over-year growth 2023-2028 (%)
      • Exhibit 90: Data Table on North America - Year-over-year growth 2023-2028 (%)
    • 9.6 South America - Market size and forecast 2023-2028
      • Exhibit 91: Chart on South America - Market size and forecast 2023-2028 ($ billion)
      • Exhibit 92: Data Table on South America - Market size and forecast 2023-2028 ($ billion)
      • Exhibit 93: Chart on South America - Year-over-year growth 2023-2028 (%)
      • Exhibit 94: Data Table on South America - Year-over-year growth 2023-2028 (%)
    • 9.7 Middle East and Africa - Market size and forecast 2023-2028
      • Exhibit 95: Chart on Middle East and Africa - Market size and forecast 2023-2028 ($ billion)
      • Exhibit 96: Data Table on Middle East and Africa - Market size and forecast 2023-2028 ($ billion)
      • Exhibit 97: Chart on Middle East and Africa - Year-over-year growth 2023-2028 (%)
      • Exhibit 98: Data Table on Middle East and Africa - Year-over-year growth 2023-2028 (%)
    • 9.8 China - Market size and forecast 2023-2028
      • Exhibit 99: Chart on China - Market size and forecast 2023-2028 ($ billion)
      • Exhibit 100: Data Table on China - Market size and forecast 2023-2028 ($ billion)
      • Exhibit 101: Chart on China - Year-over-year growth 2023-2028 (%)
      • Exhibit 102: Data Table on China - Year-over-year growth 2023-2028 (%)
    • 9.9 US - Market size and forecast 2023-2028
      • Exhibit 103: Chart on US - Market size and forecast 2023-2028 ($ billion)
      • Exhibit 104: Data Table on US - Market size and forecast 2023-2028 ($ billion)
      • Exhibit 105: Chart on US - Year-over-year growth 2023-2028 (%)
      • Exhibit 106: Data Table on US - Year-over-year growth 2023-2028 (%)
    • 9.10 Japan - Market size and forecast 2023-2028
      • Exhibit 107: Chart on Japan - Market size and forecast 2023-2028 ($ billion)
      • Exhibit 108: Data Table on Japan - Market size and forecast 2023-2028 ($ billion)
      • Exhibit 109: Chart on Japan - Year-over-year growth 2023-2028 (%)
      • Exhibit 110: Data Table on Japan - Year-over-year growth 2023-2028 (%)
    • 9.11 Germany - Market size and forecast 2023-2028
      • Exhibit 111: Chart on Germany - Market size and forecast 2023-2028 ($ billion)
      • Exhibit 112: Data Table on Germany - Market size and forecast 2023-2028 ($ billion)
      • Exhibit 113: Chart on Germany - Year-over-year growth 2023-2028 (%)
      • Exhibit 114: Data Table on Germany - Year-over-year growth 2023-2028 (%)
    • 9.12 UK - Market size and forecast 2023-2028
      • Exhibit 115: Chart on UK - Market size and forecast 2023-2028 ($ billion)
      • Exhibit 116: Data Table on UK - Market size and forecast 2023-2028 ($ billion)
      • Exhibit 117: Chart on UK - Year-over-year growth 2023-2028 (%)
      • Exhibit 118: Data Table on UK - Year-over-year growth 2023-2028 (%)
    • 9.13 Market opportunity by geography
      • Exhibit 119: Market opportunity by geography ($ billion)
      • Exhibit 120: Data Tables on Market opportunity by geography ($ billion)

    10 Drivers, Challenges, and Trends

    • 10.1 Market drivers
      • 10.2 Market challenges
        • 10.3 Impact of drivers and challenges
          • Exhibit 121: Impact of drivers and challenges in 2023 and 2028
        • 10.4 Market trends

          11 Vendor Landscape

          • 11.1 Overview
            • 11.2 Vendor landscape
              • Exhibit 122: Overview on Criticality of inputs and Factors of differentiation
            • 11.3 Landscape disruption
              • Exhibit 123: Overview on factors of disruption
            • 11.4 Industry risks
              • Exhibit 124: Impact of key risks on business

            12 Vendor Analysis

            • 12.1 Vendors covered
              • Exhibit 125: Vendors covered
            • 12.2 Market positioning of vendors
              • Exhibit 126: Matrix on vendor position and classification
            • 12.3 CENTRAL WIRE INDUSTRIES
              • Exhibit 127: CENTRAL WIRE INDUSTRIES - Overview
              • Exhibit 128: CENTRAL WIRE INDUSTRIES - Product / Service
              • Exhibit 129: CENTRAL WIRE INDUSTRIES - Key offerings
            • 12.4 Chant Engineering Co. Inc.
              • Exhibit 130: Chant Engineering Co. Inc. - Overview
              • Exhibit 131: Chant Engineering Co. Inc. - Product / Service
              • Exhibit 132: Chant Engineering Co. Inc. - Key offerings
            • 12.5 Deep Industrial Corp.
              • Exhibit 133: Deep Industrial Corp. - Overview
              • Exhibit 134: Deep Industrial Corp. - Product / Service
              • Exhibit 135: Deep Industrial Corp. - Key offerings
            • 12.6 FENN
              • Exhibit 136: FENN - Overview
              • Exhibit 137: FENN - Product / Service
              • Exhibit 138: FENN - Key offerings
            • 12.7 Gold International Machinery Corp.
              • Exhibit 139: Gold International Machinery Corp. - Overview
              • Exhibit 140: Gold International Machinery Corp. - Product / Service
              • Exhibit 141: Gold International Machinery Corp. - Key offerings
            • 12.8 Kuriyama of America Inc.
              • Exhibit 142: Kuriyama of America Inc. - Overview
              • Exhibit 143: Kuriyama of America Inc. - Product / Service
              • Exhibit 144: Kuriyama of America Inc. - Key offerings
            • 12.9 Micro Hydro Technic Pvt. Ltd.
              • Exhibit 145: Micro Hydro Technic Pvt. Ltd. - Overview
              • Exhibit 146: Micro Hydro Technic Pvt. Ltd. - Product / Service
              • Exhibit 147: Micro Hydro Technic Pvt. Ltd. - Key offerings
            • 12.10 Patson Machines Pvt. Ltd.
              • Exhibit 148: Patson Machines Pvt. Ltd. - Overview
              • Exhibit 149: Patson Machines Pvt. Ltd. - Product / Service
              • Exhibit 150: Patson Machines Pvt. Ltd. - Key offerings
            • 12.11 RAS Reinhardt Maschinenbau GmbH
              • Exhibit 151: RAS Reinhardt Maschinenbau GmbH - Overview
              • Exhibit 152: RAS Reinhardt Maschinenbau GmbH - Product / Service
              • Exhibit 153: RAS Reinhardt Maschinenbau GmbH - Key offerings
            • 12.12 SAHM SPLICE GmbH
              • Exhibit 154: SAHM SPLICE GmbH - Overview
              • Exhibit 155: SAHM SPLICE GmbH - Product / Service
              • Exhibit 156: SAHM SPLICE GmbH - Key offerings
            • 12.13 Simpletec Automatics Pvt. Ltd.
              • Exhibit 157: Simpletec Automatics Pvt. Ltd. - Overview
              • Exhibit 158: Simpletec Automatics Pvt. Ltd. - Product / Service
              • Exhibit 159: Simpletec Automatics Pvt. Ltd. - Key offerings
            • 12.14 Talurit Group
              • Exhibit 160: Talurit Group - Overview
              • Exhibit 161: Talurit Group - Product / Service
              • Exhibit 162: Talurit Group - Key offerings
            • 12.15 The Weir Group Plc
              • Exhibit 163: The Weir Group Plc - Overview
              • Exhibit 164: The Weir Group Plc - Business segments
              • Exhibit 165: The Weir Group Plc - Key news
              • Exhibit 166: The Weir Group Plc - Key offerings
              • Exhibit 167: The Weir Group Plc - Segment focus
            • 12.16 Victory Machinery Corp.
              • Exhibit 168: Victory Machinery Corp. - Overview
              • Exhibit 169: Victory Machinery Corp. - Product / Service
              • Exhibit 170: Victory Machinery Corp. - Key offerings
            • 12.17 Yashwant Industries
              • Exhibit 171: Yashwant Industries - Overview
              • Exhibit 172: Yashwant Industries - Product / Service
              • Exhibit 173: Yashwant Industries - Key offerings

            13 Appendix

            • 13.1 Scope of the report
              • 13.2 Inclusions and exclusions checklist
                • Exhibit 174: Inclusions checklist
                • Exhibit 175: Exclusions checklist
              • 13.3 Currency conversion rates for US$
                • Exhibit 176: Currency conversion rates for US$
              • 13.4 Research methodology
                • Exhibit 177: Research methodology
                • Exhibit 178: Validation techniques employed for market sizing
                • Exhibit 179: Information sources
              • 13.5 List of abbreviations
                • Exhibit 180: List of abbreviations

              Research Methodology

              Technavio presents a detailed picture of the market by way of study, synthesis, and summation of data from multiple sources. The analysts have presented the various facets of the market with a particular focus on identifying the key industry influencers. The data thus presented is comprehensive, reliable, and the result of extensive research, both primary and secondary.

              INFORMATION SOURCES

              Primary sources

              • Manufacturers and suppliers
              • Channel partners
              • Industry experts
              • Strategic decision makers

              Secondary sources

              • Industry journals and periodicals
              • Government data
              • Financial reports of key industry players
              • Historical data
              • Press releases

              DATA ANALYSIS

              Data Synthesis

              • Collation of data
              • Estimation of key figures
              • Analysis of derived insights

              Data Validation

              • Triangulation with data models
              • Reference against proprietary databases
              • Corroboration with industry experts

              REPORT WRITING

              Qualitative

              • Market drivers
              • Market challenges
              • Market trends
              • Five forces analysis

              Quantitative

              • Market size and forecast
              • Market segmentation
              • Geographical insights
              • Competitive landscape

              Interested in this report?

              Get your sample now to see our research methodology and insights!

              Download Now

              Frequently Asked Questions

              Swaging Machines market growth will increase by $ 1.24 bn during 2024-2028.

              The Swaging Machines market is expected to grow at a CAGR of 4.7% during 2024-2028.

              Swaging Machines market is segmented by Product( Radial swaging machine, Rotary swaging machine, Hydraulic swaging machine, Others) Application( Automotive, Machinery and equipment, Chemical and materials, Others)

              CENTRAL WIRE INDUSTRIES, Chant Engineering Co. Inc., Deep Industrial Corp., FENN, Gold International Machinery Corp., Kuriyama of America Inc., Micro Hydro Technic Pvt. Ltd., Patson Machines Pvt. Ltd., RAS Reinhardt Maschinenbau GmbH, SAHM SPLICE GmbH, Scorpion Equipment, Shuz Tung Machinery Industrial Co. Ltd., Simpletec Automatics Pvt. Ltd., Talurit Group, The Weir Group Plc, Victory Machinery Corp., Yashwant Industries, SLS Machinery Co. Ltd., HOREN INDUSTRIAL Co. Ltd., Fichter formtec GmbH are a few of the key vendors in the Swaging Machines market.

              APAC will register the highest growth rate of 63% among the other regions. Therefore, the Swaging Machines market in APAC is expected to garner significant business opportunities for the vendors during the forecast period.

              US, China, Japan, Germany, UK

              • Increased demand for swaging machines for automobilesSwaging machines are used in the automobile industry to produce precision-formed components for various applications is the driving factor this market.
              • including axles is the driving factor this market.
              • drive shafts is the driving factor this market.
              • and structural elements is the driving factor this market.
              • contributing to enhanced performance and efficiency. The door beams is the driving factor this market.
              • seat frames is the driving factor this market.
              • side sills is the driving factor this market.
              • and suspension arms are required to be shaped to a specific dimension is the driving factor this market.
              • which is achieved with the use of swaging machines during the metal cutting stage. Swaging machines in EVs are used to shape and form precision components crucial for the performance and efficiency of EVs. Applications include manufacturing parts for the steering system is the driving factor this market.
              • suspension components is the driving factor this market.
              • drive shafts is the driving factor this market.
              • fasteners is the driving factor this market.
              • and other critical elements that contribute to the overall reliability and functionality of electric vehicles. Swaging ensures precise shaping and dimensional accuracy in components is the driving factor this market.
              • supporting the automotive industry shift toward electric mobility. Electric cars have been gaining popularity with technological innovations. The US is expected to be the global leader in next-generation vehicle technologies. With the support of financial incentives and R and D is the driving factor this market.
              • the country believes in lessening its dependence on petroleum products for transportation is the driving factor this market.
              • and the future of EVs seems promising. For example is the driving factor this market.
              • China has improved its air quality by adopting various measures is the driving factor this market.
              • such as the promotion of R and D in electric cars and investment in EV infrastructural development by increasing the number of charging stations. South Korea has increased its investment in electric cars. The country is reported to have made significant investments in compressed natural gas (CNG) buses for public transportation. Buses contribute a significant number of harmful pollutants. Therefore is the driving factor this market.
              • to reduce this issue is the driving factor this market.
              • South Korea has initiated an investment and development program for fuel-cell EVs and natural gas vehicles. Subsequently is the driving factor this market.
              • the government of South Korea is the driving factor this market.
              • in collaboration with Hyundai is the driving factor this market.
              • is planning to replace the buses with hybrid hydrogen- EVs by 2030. Such developments in the automotive sector are expected to continue through the forecast period and create demand for swaging machines and will drive the growth of the global swaging machines market during the forecast period. is the driving factor this market.

              The Swaging Machines market vendors should focus on grabbing business opportunities from the Radial swaging machine segment as it accounted for the largest market share in the base year.
              RIA - Research AI Assistant
              Ask RIA