Systemic Inflammatory Response Syndrome Treatment Market Analysis, Size, and Forecast 2026-2030: North America (US, Canada, and Mexico), Europe (Germany, UK, and France), APAC (China, India, and Japan), South America (Brazil), Middle East and Africa (South Africa, UAE, and Saudi Arabia), Asia, Rest of World (ROW)

Systemic Inflammatory Response Syndrome Treatment Market Analysis, Size, and Forecast 2026-2030:
North America (US, Canada, and Mexico), Europe (Germany, UK, and France), APAC (China, India, and Japan), South America (Brazil), Middle East and Africa (South Africa, UAE, and Saudi Arabia), Asia, Rest of World (ROW)

Published: Dec 2025 289 Pages SKU: IRTNTR81208

Market Overview at a Glance

$5.12 B
Market Opportunity
6.1%
CAGR 2025 - 2030
35.8%
North America Growth
$8.30 B
Intravenous segment 2024

Systemic Inflammatory Response Syndrome Treatment Market Size 2026-2030

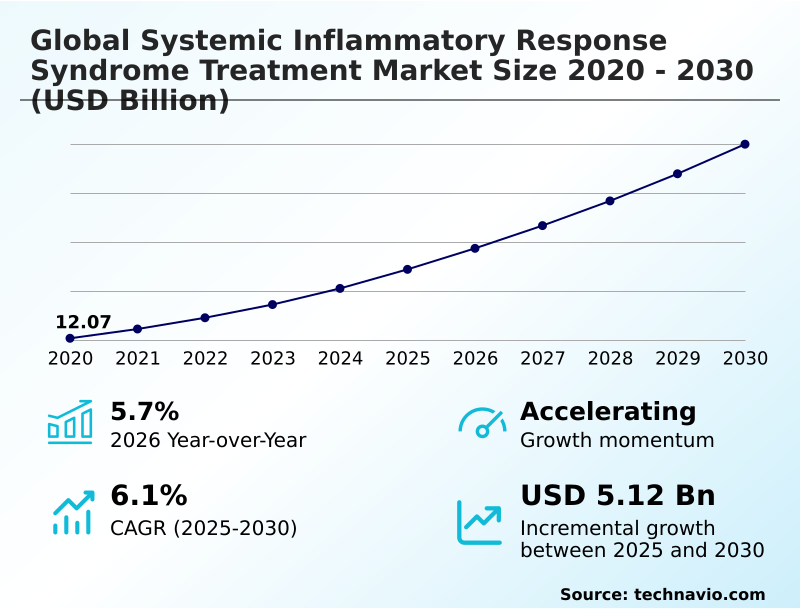
The systemic inflammatory response syndrome treatment market size is valued to increase by USD 5.12 billion, at a CAGR of 6.1% from 2025 to 2030. Increasing global incidence of sepsis and related inflammatory conditions will drive the systemic inflammatory response syndrome treatment market.

Major Market Trends & Insights

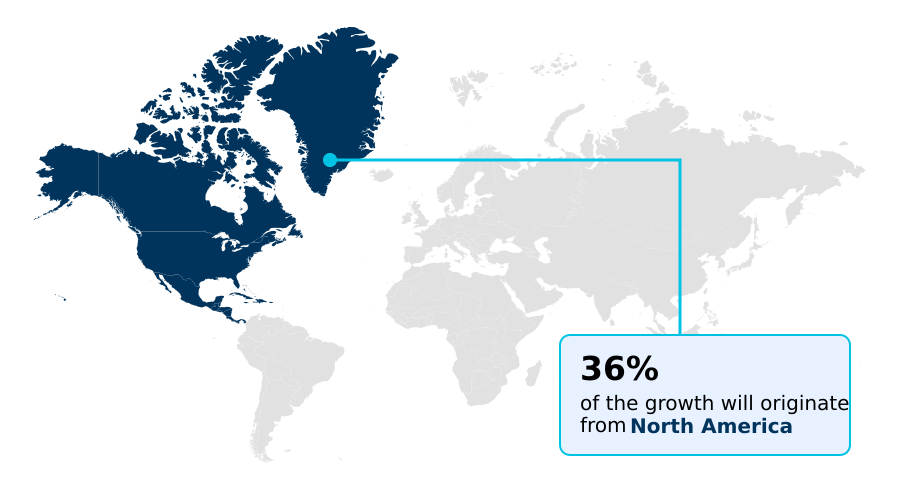
  • North America dominated the market and accounted for a 35.8% growth during the forecast period.
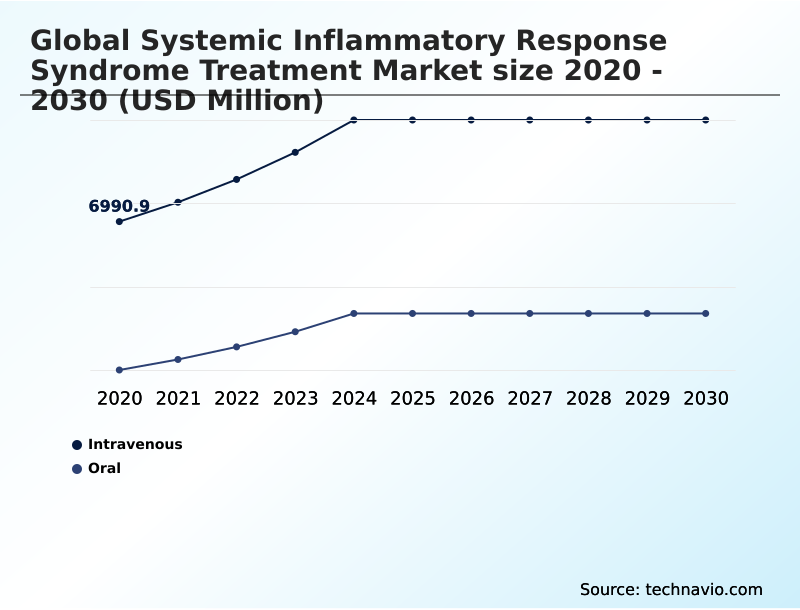
  • By Route of Administration - Intravenous segment was valued at USD 8.30 billion in 2024
  • By Distribution Channel - Offline segment accounted for the largest market revenue share in 2024

Market Size & Forecast

  • Market Opportunities: USD 7.94 billion
  • Market Future Opportunities: USD 5.12 billion
  • CAGR from 2025 to 2030 : 6.1%

Market Summary

What will be the Size of the Systemic Inflammatory Response Syndrome Treatment Market during the forecast period?

Get Key Insights on Market Forecast (PDF) Request Free Sample

How is the Systemic Inflammatory Response Syndrome Treatment Market Segmented?

The systemic inflammatory response syndrome treatment industry research report provides comprehensive data (region-wise segment analysis), with forecasts and estimates in "USD million" for the period 2026-2030, as well as historical data from 2020-2024 for the following segments.

  • Route of administration
    • Intravenous
    • Oral
  • Distribution channel
    • Offline
    • Online
  • End-user
    • Hospitals
    • Clinics
    • Others
  • Geography
    • North America
      • US
      • Canada
      • Mexico
    • Europe
      • Germany
      • UK
      • France
    • Asia
    • Rest of World (ROW)

By Route of Administration Insights

The intravenous segment is estimated to witness significant growth during the forecast period.

Request Free Sample

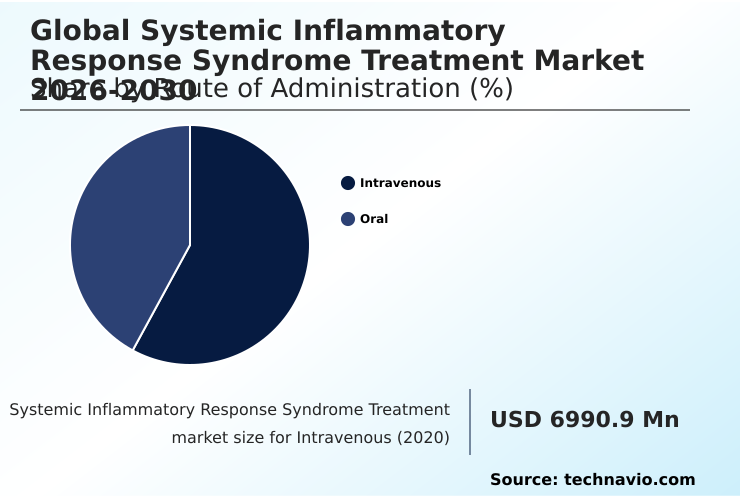
The Intravenous segment was valued at USD 8.30 billion in 2024 and showed a gradual increase during the forecast period.

Request Free Sample

Regional Analysis

North America is estimated to contribute 35.8% to the growth of the global market during the forecast period.Technavio’s analysts have elaborately explained the regional trends and drivers that shape the market during the forecast period.

See How Systemic Inflammatory Response Syndrome Treatment Market Demand is Rising in North America Request Free Sample

Market Dynamics

Our researchers analyzed the data with 2025 as the base year, along with the key drivers, trends, and challenges. A holistic analysis of drivers will help companies refine their marketing strategies to gain a competitive advantage.

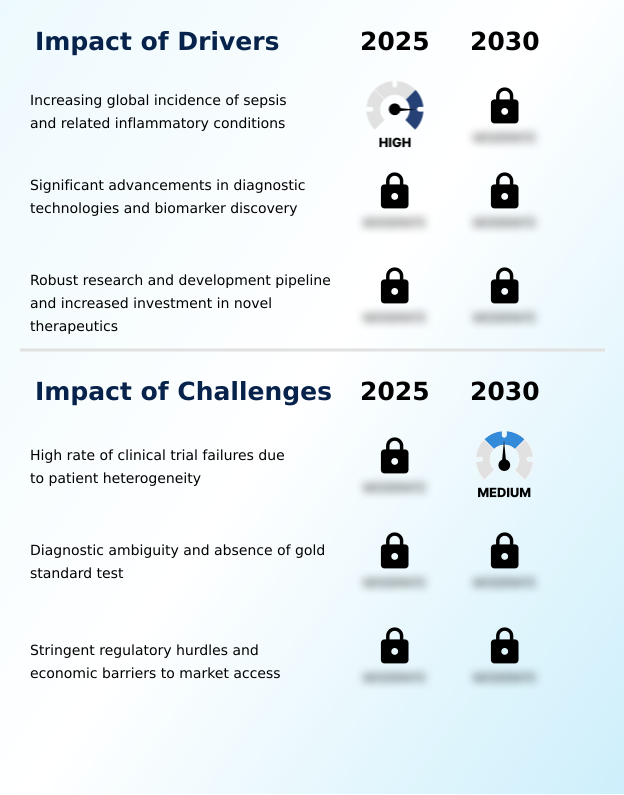
What are the key market drivers leading to the rise in the adoption of Systemic Inflammatory Response Syndrome Treatment Industry?

What are the market trends shaping the Systemic Inflammatory Response Syndrome Treatment Industry?

What challenges does the Systemic Inflammatory Response Syndrome Treatment Industry face during its growth?

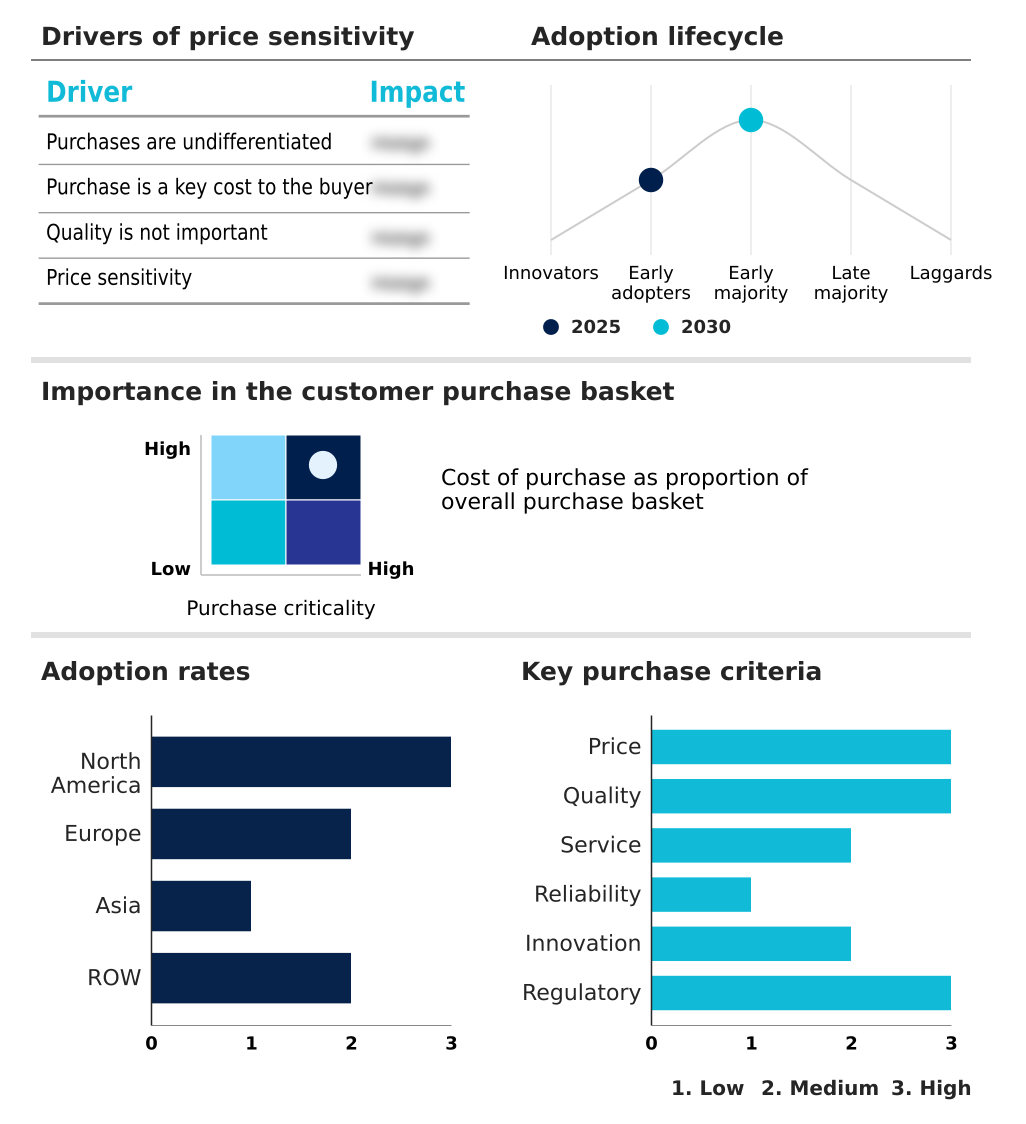
Exclusive Technavio Analysis on Customer Landscape

The systemic inflammatory response syndrome treatment market forecasting report includes the adoption lifecycle of the market, covering from the innovator’s stage to the laggard’s stage. It focuses on adoption rates in different regions based on penetration. Furthermore, the systemic inflammatory response syndrome treatment market report also includes key purchase criteria and drivers of price sensitivity to help companies evaluate and develop their market growth analysis strategies.

Customer Landscape of Systemic Inflammatory Response Syndrome Treatment Industry

Competitive Landscape

Companies are implementing various strategies, such as strategic alliances, systemic inflammatory response syndrome treatment market forecast, partnerships, mergers and acquisitions, geographical expansion, and product/service launches, to enhance their presence in the industry.

AbbVie Inc. -

The industry research and growth report includes detailed analyses of the competitive landscape of the market and information about key companies, including:

  • AbbVie Inc.
  • AstraZeneca Plc
  • B.Braun SE
  • Baxter International Inc.
  • Becton Dickinson and Co.
  • BioMerieux SA
  • Dragerwerk AG and Co. KGaA
  • Edwards Lifesciences Corp.
  • Eli Lilly and Co.
  • F. Hoffmann La Roche Ltd.
  • Fresenius Kabi AG
  • Getinge AB
  • GlaxoSmithKline Plc
  • Johnson and Johnson Services
  • Medtronic Plc
  • Merck and Co. Inc.
  • Novartis AG
  • Pfizer Inc.
  • Sanofi SA

Qualitative and quantitative analysis of companies has been conducted to help clients understand the wider business environment as well as the strengths and weaknesses of key industry players. Data is qualitatively analyzed to categorize companies as pure play, category-focused, industry-focused, and diversified; it is quantitatively analyzed to categorize companies as dominant, leading, strong, tentative, and weak.

Recent Development and News in Systemic inflammatory response syndrome treatment market

Dive into Technavio’s robust research methodology, blending expert interviews, extensive data synthesis, and validated models for unparalleled Systemic Inflammatory Response Syndrome Treatment Market insights. See full methodology.

Market Scope
Page number 289
Base year 2025
Historic period 2020-2024
Forecast period 2026-2030
Growth momentum & CAGR Accelerate at a CAGR of 6.1%
Market growth 2026-2030 USD 5117.0 million
Market structure Fragmented
YoY growth 2025-2026(%) 5.7%
Key countries US, Canada, Mexico, Germany, UK, France, Italy, The Netherlands, Spain, Russia, China, India, Japan, South Korea, Indonesia, Thailand, Singapore, Brazil, Australia, South Africa, UAE, Saudi Arabia and Turkey
Competitive landscape Leading Companies, Market Positioning of Companies, Competitive Strategies, and Industry Risks

Request Free Sample

Research Analyst Overview

What are the Key Data Covered in this Systemic Inflammatory Response Syndrome Treatment Market Research and Growth Report?

  • What is the expected growth of the Systemic Inflammatory Response Syndrome Treatment Market between 2026 and 2030?

    • USD 5.12 billion, at a CAGR of 6.1%

  • What segmentation does the market report cover?

    • The report is segmented by Route of Administration (Intravenous, and Oral), Distribution Channel (Offline, and Online), End-user (Hospitals, Clinics, and Others) and Geography (North America, Europe, Asia, Rest of World (ROW))

  • Which regions are analyzed in the report?

    • North America, Europe, Asia and Rest of World (ROW)

  • What are the key growth drivers and market challenges?

    • Increasing global incidence of sepsis and related inflammatory conditions, High rate of clinical trial failures due to patient heterogeneity

  • Who are the major players in the Systemic Inflammatory Response Syndrome Treatment Market?

    • AbbVie Inc., AstraZeneca Plc, B.Braun SE, Baxter International Inc., Becton Dickinson and Co., BioMerieux SA, Dragerwerk AG and Co. KGaA, Edwards Lifesciences Corp., Eli Lilly and Co., F. Hoffmann La Roche Ltd., Fresenius Kabi AG, Getinge AB, GlaxoSmithKline Plc, Johnson and Johnson Services, Medtronic Plc, Merck and Co. Inc., Novartis AG, Pfizer Inc. and Sanofi SA

Market Research Insights

We can help! Our analysts can customize this systemic inflammatory response syndrome treatment market research report to meet your requirements.

Get in touch

1. Executive Summary

1.1 Market overview

Executive Summary - Chart on Market Overview
Executive Summary - Data Table on Market Overview
Executive Summary - Chart on Global Market Characteristics
Executive Summary - Chart on Market by Geography
Executive Summary - Chart on Market Segmentation by Route of Administration
Executive Summary - Chart on Market Segmentation by Distribution Channel
Executive Summary - Chart on Market Segmentation by End-user
Executive Summary - Chart on Incremental Growth
Executive Summary - Data Table on Incremental Growth
Executive Summary - Chart on Company Market Positioning

2. Technavio Analysis

2.1 Analysis of price sensitivity, lifecycle, customer purchase basket, adoption rates, and purchase criteria

2.2 Criticality of inputs and Factors of differentiation

Chart on Overview on criticality of inputs and factors of differentiation

2.3 Factors of disruption

Chart on Overview on factors of disruption

2.4 Impact of drivers and challenges

Chart on Impact of drivers and challenges in 2025 and 2030

3. Market Landscape

3.1 Market ecosystem

Chart on Parent Market
Data Table on - Parent Market

3.2 Market characteristics

Chart on Market characteristics analysis

3.3 Value chain analysis

Chart on Value chain analysis

4. Market Sizing

4.1 Market definition

Data Table on Offerings of companies included in the market definition

4.2 Market segment analysis

Market segments

4.3 Market size 2025

4.4 Market outlook: Forecast for 2025-2030

Chart on Global - Market size and forecast 2025-2030 ($ million)
Data Table on Global - Market size and forecast 2025-2030 ($ million)
Chart on Global Market: Year-over-year growth 2025-2030 (%)
Data Table on Global Market: Year-over-year growth 2025-2030 (%)

5. Historic Market Size

5.1 Global Systemic Inflammatory Response Syndrome Treatment Market 2020 - 2024

Historic Market Size - Data Table on Global Systemic Inflammatory Response Syndrome Treatment Market 2020 - 2024 ($ million)

5.2 Route of Administration segment analysis 2020 - 2024

Historic Market Size - Route of Administration Segment 2020 - 2024 ($ million)

5.3 Distribution Channel segment analysis 2020 - 2024

Historic Market Size - Distribution Channel Segment 2020 - 2024 ($ million)

5.4 End-user segment analysis 2020 - 2024

Historic Market Size - End-user Segment 2020 - 2024 ($ million)

5.5 Geography segment analysis 2020 - 2024

Historic Market Size - Geography Segment 2020 - 2024 ($ million)

5.6 Country segment analysis 2020 - 2024

Historic Market Size - Country Segment 2020 - 2024 ($ million)

6. Qualitative Analysis

6.1 Impact of AI on the Global Systemic Inflammatory Response Syndrome Treatment Market

7. Five Forces Analysis

7.1 Five forces summary

Five forces analysis - Comparison between 2025 and 2030

7.2 Bargaining power of buyers

Bargaining power of buyers - Impact of key factors 2025 and 2030

7.3 Bargaining power of suppliers

Bargaining power of suppliers - Impact of key factors in 2025 and 2030

7.4 Threat of new entrants

Threat of new entrants - Impact of key factors in 2025 and 2030

7.5 Threat of substitutes

Threat of substitutes - Impact of key factors in 2025 and 2030

7.6 Threat of rivalry

Threat of rivalry - Impact of key factors in 2025 and 2030

7.7 Market condition

Chart on Market condition - Five forces 2025 and 2030

8. Market Segmentation by Route of Administration

8.1 Market segments

Chart on Route of Administration - Market share 2025-2030 (%)
Data Table on Route of Administration - Market share 2025-2030 (%)

8.2 Comparison by Route of Administration

Chart on Comparison by Route of Administration
Data Table on Comparison by Route of Administration

8.3 Intravenous - Market size and forecast 2025-2030

Chart on Intravenous - Market size and forecast 2025-2030 ($ million)
Data Table on Intravenous - Market size and forecast 2025-2030 ($ million)
Chart on Intravenous - Year-over-year growth 2025-2030 (%)
Data Table on Intravenous - Year-over-year growth 2025-2030 (%)

8.4 Oral - Market size and forecast 2025-2030

Chart on Oral - Market size and forecast 2025-2030 ($ million)
Data Table on Oral - Market size and forecast 2025-2030 ($ million)
Chart on Oral - Year-over-year growth 2025-2030 (%)
Data Table on Oral - Year-over-year growth 2025-2030 (%)

8.5 Market opportunity by Route of Administration

Market opportunity by Route of Administration ($ million)
Data Table on Market opportunity by Route of Administration ($ million)

9. Market Segmentation by Distribution Channel

9.1 Market segments

Chart on Distribution Channel - Market share 2025-2030 (%)
Data Table on Distribution Channel - Market share 2025-2030 (%)

9.2 Comparison by Distribution Channel

Chart on Comparison by Distribution Channel
Data Table on Comparison by Distribution Channel

9.3 Offline - Market size and forecast 2025-2030

Chart on Offline - Market size and forecast 2025-2030 ($ million)
Data Table on Offline - Market size and forecast 2025-2030 ($ million)
Chart on Offline - Year-over-year growth 2025-2030 (%)
Data Table on Offline - Year-over-year growth 2025-2030 (%)

9.4 Online - Market size and forecast 2025-2030

Chart on Online - Market size and forecast 2025-2030 ($ million)
Data Table on Online - Market size and forecast 2025-2030 ($ million)
Chart on Online - Year-over-year growth 2025-2030 (%)
Data Table on Online - Year-over-year growth 2025-2030 (%)

9.5 Market opportunity by Distribution Channel

Market opportunity by Distribution Channel ($ million)
Data Table on Market opportunity by Distribution Channel ($ million)

10. Market Segmentation by End-user

10.1 Market segments

Chart on End-user - Market share 2025-2030 (%)
Data Table on End-user - Market share 2025-2030 (%)

10.2 Comparison by End-user

Chart on Comparison by End-user
Data Table on Comparison by End-user

10.3 Hospitals - Market size and forecast 2025-2030

Chart on Hospitals - Market size and forecast 2025-2030 ($ million)
Data Table on Hospitals - Market size and forecast 2025-2030 ($ million)
Chart on Hospitals - Year-over-year growth 2025-2030 (%)
Data Table on Hospitals - Year-over-year growth 2025-2030 (%)

10.4 Clinics - Market size and forecast 2025-2030

Chart on Clinics - Market size and forecast 2025-2030 ($ million)
Data Table on Clinics - Market size and forecast 2025-2030 ($ million)
Chart on Clinics - Year-over-year growth 2025-2030 (%)
Data Table on Clinics - Year-over-year growth 2025-2030 (%)

10.5 Others - Market size and forecast 2025-2030

Chart on Others - Market size and forecast 2025-2030 ($ million)
Data Table on Others - Market size and forecast 2025-2030 ($ million)
Chart on Others - Year-over-year growth 2025-2030 (%)
Data Table on Others - Year-over-year growth 2025-2030 (%)

10.6 Market opportunity by End-user

Market opportunity by End-user ($ million)
Data Table on Market opportunity by End-user ($ million)

11. Customer Landscape

11.1 Customer landscape overview

Analysis of price sensitivity, lifecycle, customer purchase basket, adoption rates, and purchase criteria

12. Geographic Landscape

12.1 Geographic segmentation

Chart on Market share by geography 2025-2030 (%)
Data Table on Market share by geography 2025-2030 (%)

12.2 Geographic comparison

Chart on Geographic comparison
Data Table on Geographic comparison

12.3 North America - Market size and forecast 2025-2030

Chart on North America - Market size and forecast 2025-2030 ($ million)
Data Table on North America - Market size and forecast 2025-2030 ($ million)
Chart on North America - Year-over-year growth 2025-2030 (%)
Data Table on North America - Year-over-year growth 2025-2030 (%)
Chart on Regional Comparison - North America
Data Table on Regional Comparison - North America

12.3.1 US - Market size and forecast 2025-2030

Chart on US - Market size and forecast 2025-2030 ($ million)
Data Table on US - Market size and forecast 2025-2030 ($ million)
Chart on US - Year-over-year growth 2025-2030 (%)
Data Table on US - Year-over-year growth 2025-2030 (%)

12.3.2 Canada - Market size and forecast 2025-2030

Chart on Canada - Market size and forecast 2025-2030 ($ million)
Data Table on Canada - Market size and forecast 2025-2030 ($ million)
Chart on Canada - Year-over-year growth 2025-2030 (%)
Data Table on Canada - Year-over-year growth 2025-2030 (%)

12.3.3 Mexico - Market size and forecast 2025-2030

Chart on Mexico - Market size and forecast 2025-2030 ($ million)
Data Table on Mexico - Market size and forecast 2025-2030 ($ million)
Chart on Mexico - Year-over-year growth 2025-2030 (%)
Data Table on Mexico - Year-over-year growth 2025-2030 (%)

12.4 Europe - Market size and forecast 2025-2030

Chart on Europe - Market size and forecast 2025-2030 ($ million)
Data Table on Europe - Market size and forecast 2025-2030 ($ million)
Chart on Europe - Year-over-year growth 2025-2030 (%)
Data Table on Europe - Year-over-year growth 2025-2030 (%)
Chart on Regional Comparison - Europe
Data Table on Regional Comparison - Europe

12.4.1 Germany - Market size and forecast 2025-2030

Chart on Germany - Market size and forecast 2025-2030 ($ million)
Data Table on Germany - Market size and forecast 2025-2030 ($ million)
Chart on Germany - Year-over-year growth 2025-2030 (%)
Data Table on Germany - Year-over-year growth 2025-2030 (%)

12.4.2 UK - Market size and forecast 2025-2030

Chart on UK - Market size and forecast 2025-2030 ($ million)
Data Table on UK - Market size and forecast 2025-2030 ($ million)
Chart on UK - Year-over-year growth 2025-2030 (%)
Data Table on UK - Year-over-year growth 2025-2030 (%)

12.4.3 France - Market size and forecast 2025-2030

Chart on France - Market size and forecast 2025-2030 ($ million)
Data Table on France - Market size and forecast 2025-2030 ($ million)
Chart on France - Year-over-year growth 2025-2030 (%)
Data Table on France - Year-over-year growth 2025-2030 (%)

12.4.4 Italy - Market size and forecast 2025-2030

Chart on Italy - Market size and forecast 2025-2030 ($ million)
Data Table on Italy - Market size and forecast 2025-2030 ($ million)
Chart on Italy - Year-over-year growth 2025-2030 (%)
Data Table on Italy - Year-over-year growth 2025-2030 (%)

12.4.5 The Netherlands - Market size and forecast 2025-2030

Chart on The Netherlands - Market size and forecast 2025-2030 ($ million)
Data Table on The Netherlands - Market size and forecast 2025-2030 ($ million)
Chart on The Netherlands - Year-over-year growth 2025-2030 (%)
Data Table on The Netherlands - Year-over-year growth 2025-2030 (%)

12.4.6 Spain - Market size and forecast 2025-2030

Chart on Spain - Market size and forecast 2025-2030 ($ million)
Data Table on Spain - Market size and forecast 2025-2030 ($ million)
Chart on Spain - Year-over-year growth 2025-2030 (%)
Data Table on Spain - Year-over-year growth 2025-2030 (%)

12.4.7 Russia - Market size and forecast 2025-2030

Chart on Russia - Market size and forecast 2025-2030 ($ million)
Data Table on Russia - Market size and forecast 2025-2030 ($ million)
Chart on Russia - Year-over-year growth 2025-2030 (%)
Data Table on Russia - Year-over-year growth 2025-2030 (%)

12.5 Asia - Market size and forecast 2025-2030

Chart on Asia - Market size and forecast 2025-2030 ($ million)
Data Table on Asia - Market size and forecast 2025-2030 ($ million)
Chart on Asia - Year-over-year growth 2025-2030 (%)
Data Table on Asia - Year-over-year growth 2025-2030 (%)
Chart on Regional Comparison - Asia
Data Table on Regional Comparison - Asia

12.5.1 China - Market size and forecast 2025-2030

Chart on China - Market size and forecast 2025-2030 ($ million)
Data Table on China - Market size and forecast 2025-2030 ($ million)
Chart on China - Year-over-year growth 2025-2030 (%)
Data Table on China - Year-over-year growth 2025-2030 (%)

12.5.2 India - Market size and forecast 2025-2030

Chart on India - Market size and forecast 2025-2030 ($ million)
Data Table on India - Market size and forecast 2025-2030 ($ million)
Chart on India - Year-over-year growth 2025-2030 (%)
Data Table on India - Year-over-year growth 2025-2030 (%)

12.5.3 Japan - Market size and forecast 2025-2030

Chart on Japan - Market size and forecast 2025-2030 ($ million)
Data Table on Japan - Market size and forecast 2025-2030 ($ million)
Chart on Japan - Year-over-year growth 2025-2030 (%)
Data Table on Japan - Year-over-year growth 2025-2030 (%)

12.5.4 South Korea - Market size and forecast 2025-2030

Chart on South Korea - Market size and forecast 2025-2030 ($ million)
Data Table on South Korea - Market size and forecast 2025-2030 ($ million)
Chart on South Korea - Year-over-year growth 2025-2030 (%)
Data Table on South Korea - Year-over-year growth 2025-2030 (%)

12.5.5 Indonesia - Market size and forecast 2025-2030

Chart on Indonesia - Market size and forecast 2025-2030 ($ million)
Data Table on Indonesia - Market size and forecast 2025-2030 ($ million)
Chart on Indonesia - Year-over-year growth 2025-2030 (%)
Data Table on Indonesia - Year-over-year growth 2025-2030 (%)

12.5.6 Thailand - Market size and forecast 2025-2030

Chart on Thailand - Market size and forecast 2025-2030 ($ million)
Data Table on Thailand - Market size and forecast 2025-2030 ($ million)
Chart on Thailand - Year-over-year growth 2025-2030 (%)
Data Table on Thailand - Year-over-year growth 2025-2030 (%)

12.5.7 Singapore - Market size and forecast 2025-2030

Chart on Singapore - Market size and forecast 2025-2030 ($ million)
Data Table on Singapore - Market size and forecast 2025-2030 ($ million)
Chart on Singapore - Year-over-year growth 2025-2030 (%)
Data Table on Singapore - Year-over-year growth 2025-2030 (%)

12.6 Rest of World (ROW) - Market size and forecast 2025-2030

Chart on Rest of World (ROW) - Market size and forecast 2025-2030 ($ million)
Data Table on Rest of World (ROW) - Market size and forecast 2025-2030 ($ million)
Chart on Rest of World (ROW) - Year-over-year growth 2025-2030 (%)
Data Table on Rest of World (ROW) - Year-over-year growth 2025-2030 (%)
Chart on Regional Comparison - Rest of World (ROW)
Data Table on Regional Comparison - Rest of World (ROW)

12.6.1 Brazil - Market size and forecast 2025-2030

Chart on Brazil - Market size and forecast 2025-2030 ($ million)
Data Table on Brazil - Market size and forecast 2025-2030 ($ million)
Chart on Brazil - Year-over-year growth 2025-2030 (%)
Data Table on Brazil - Year-over-year growth 2025-2030 (%)

12.6.2 Australia - Market size and forecast 2025-2030

Chart on Australia - Market size and forecast 2025-2030 ($ million)
Data Table on Australia - Market size and forecast 2025-2030 ($ million)
Chart on Australia - Year-over-year growth 2025-2030 (%)
Data Table on Australia - Year-over-year growth 2025-2030 (%)

12.6.3 South Africa - Market size and forecast 2025-2030

Chart on South Africa - Market size and forecast 2025-2030 ($ million)
Data Table on South Africa - Market size and forecast 2025-2030 ($ million)
Chart on South Africa - Year-over-year growth 2025-2030 (%)
Data Table on South Africa - Year-over-year growth 2025-2030 (%)

12.6.4 UAE - Market size and forecast 2025-2030

Chart on UAE - Market size and forecast 2025-2030 ($ million)
Data Table on UAE - Market size and forecast 2025-2030 ($ million)
Chart on UAE - Year-over-year growth 2025-2030 (%)
Data Table on UAE - Year-over-year growth 2025-2030 (%)

12.6.5 Saudi Arabia - Market size and forecast 2025-2030

Chart on Saudi Arabia - Market size and forecast 2025-2030 ($ million)
Data Table on Saudi Arabia - Market size and forecast 2025-2030 ($ million)
Chart on Saudi Arabia - Year-over-year growth 2025-2030 (%)
Data Table on Saudi Arabia - Year-over-year growth 2025-2030 (%)

12.6.6 Turkey - Market size and forecast 2025-2030

Chart on Turkey - Market size and forecast 2025-2030 ($ million)
Data Table on Turkey - Market size and forecast 2025-2030 ($ million)
Chart on Turkey - Year-over-year growth 2025-2030 (%)
Data Table on Turkey - Year-over-year growth 2025-2030 (%)

12.7 Market opportunity by geography

Market opportunity by geography ($ million)
Data Tables on Market opportunity by geography ($ million)

13. Drivers, Challenges, and Opportunity

13.1 Market drivers

Increasing global incidence of sepsis and related inflammatory conditions
Significant advancements in diagnostic technologies and biomarker discovery
Robust research and development pipeline and increased investment in novel therapeutics

13.2 Market challenges

High rate of clinical trial failures due to patient heterogeneity
Diagnostic ambiguity and absence of gold standard test
Stringent regulatory hurdles and economic barriers to market access

13.3 Impact of drivers and challenges

Impact of drivers and challenges in 2025 and 2030

13.4 Market opportunities

Ascendancy of precision medicine and biomarker-driven stratification
Emergence of advanced immunomodulatory and cytokine-targeted therapeutics
Integration of artificial intelligence and digital health in clinical workflows

14. Competitive Landscape

14.1 Overview

14.2

Overview on criticality of inputs and factors of differentiation

14.3 Landscape disruption

Overview on factors of disruption

14.4 Industry risks

Impact of key risks on business

15. Competitive Analysis

15.1 Companies profiled

Companies covered

15.2 Company ranking index

15.3 Market positioning of companies

Matrix on companies position and classification

15.4 AstraZeneca Plc

AstraZeneca Plc - Overview
AstraZeneca Plc - Product / Service
AstraZeneca Plc - Key news
AstraZeneca Plc - Key offerings
SWOT

15.5 B.Braun SE

B.Braun SE - Overview
B.Braun SE - Product / Service
B.Braun SE - Key news
B.Braun SE - Key offerings
SWOT

15.6 Baxter International Inc.

Baxter International Inc. - Overview
Baxter International Inc. - Business segments
Baxter International Inc. - Key news
Baxter International Inc. - Key offerings
Baxter International Inc. - Segment focus
SWOT

15.7 BioMerieux SA

BioMerieux SA - Overview
BioMerieux SA - Business segments
BioMerieux SA - Key news
BioMerieux SA - Key offerings
BioMerieux SA - Segment focus
SWOT

15.8 Edwards Lifesciences Corp.

Edwards Lifesciences Corp. - Overview
Edwards Lifesciences Corp. - Business segments
Edwards Lifesciences Corp. - Key news
Edwards Lifesciences Corp. - Key offerings
Edwards Lifesciences Corp. - Segment focus
SWOT

15.9 Eli Lilly and Co.

Eli Lilly and Co. - Overview
Eli Lilly and Co. - Product / Service
Eli Lilly and Co. - Key offerings
SWOT

15.10 F. Hoffmann La Roche Ltd.

F. Hoffmann La Roche Ltd. - Overview
F. Hoffmann La Roche Ltd. - Business segments
F. Hoffmann La Roche Ltd. - Key news
F. Hoffmann La Roche Ltd. - Key offerings
F. Hoffmann La Roche Ltd. - Segment focus
SWOT

15.11 Fresenius Kabi AG

Fresenius Kabi AG - Overview
Fresenius Kabi AG - Product / Service
Fresenius Kabi AG - Key offerings
SWOT

15.12 GlaxoSmithKline Plc

GlaxoSmithKline Plc - Overview
GlaxoSmithKline Plc - Business segments
GlaxoSmithKline Plc - Key news
GlaxoSmithKline Plc - Key offerings
GlaxoSmithKline Plc - Segment focus
SWOT

15.13 Johnson and Johnson Services

Johnson and Johnson Services - Overview
Johnson and Johnson Services - Business segments
Johnson and Johnson Services - Key news
Johnson and Johnson Services - Key offerings
Johnson and Johnson Services - Segment focus
SWOT

15.14 Medtronic Plc

Medtronic Plc - Overview
Medtronic Plc - Business segments
Medtronic Plc - Key news
Medtronic Plc - Key offerings
Medtronic Plc - Segment focus
SWOT

15.15 Merck and Co. Inc.

Merck and Co. Inc. - Overview
Merck and Co. Inc. - Business segments
Merck and Co. Inc. - Key news
Merck and Co. Inc. - Key offerings
Merck and Co. Inc. - Segment focus
SWOT

15.16 Novartis AG

Novartis AG - Overview
Novartis AG - Business segments
Novartis AG - Key news
Novartis AG - Key offerings
Novartis AG - Segment focus
SWOT

15.17 Pfizer Inc.

Pfizer Inc. - Overview
Pfizer Inc. - Product / Service
Pfizer Inc. - Key news
Pfizer Inc. - Key offerings
SWOT

15.18 Sanofi SA

Sanofi SA - Overview
Sanofi SA - Business segments
Sanofi SA - Key news
Sanofi SA - Key offerings
Sanofi SA - Segment focus
SWOT

16. Appendix

16.1 Scope of the report

Market definition
Objectives
Notes and caveats

16.2 Inclusions and exclusions checklist

Inclusions checklist
Exclusions checklist

16.3 Currency conversion rates for US$

16.4 Research methodology

16.5 Data procurement

Information sources

16.6 Data validation

16.7 Validation techniques employed for market sizing

16.8 Data synthesis

16.9 360 degree market analysis

16.10 List of abbreviations

Research Methodology

Technavio presents a detailed picture of the market by way of study, synthesis, and summation of data from multiple sources. The analysts have presented the various facets of the market with a particular focus on identifying the key industry influencers. The data thus presented is comprehensive, reliable, and the result of extensive research, both primary and secondary.

INFORMATION SOURCES

Primary sources

  • Manufacturers and suppliers
  • Channel partners
  • Industry experts
  • Strategic decision makers

Secondary sources

  • Industry journals and periodicals
  • Government data
  • Financial reports of key industry players
  • Historical data
  • Press releases

DATA ANALYSIS

Data Synthesis

  • Collation of data
  • Estimation of key figures
  • Analysis of derived insights

Data Validation

  • Triangulation with data models
  • Reference against proprietary databases
  • Corroboration with industry experts

REPORT WRITING

Qualitative

  • Market drivers
  • Market challenges
  • Market trends
  • Five forces analysis

Quantitative

  • Market size and forecast
  • Market segmentation
  • Geographical insights
  • Competitive landscape

Interested in this report?

Get your sample now to see our research methodology and insights!

Download Now

Frequently Asked Questions

Systemic Inflammatory Response Syndrome Treatment market growth will increase by USD 5117.0 million during 2026-2030 .

The Systemic Inflammatory Response Syndrome Treatment market is expected to grow at a CAGR of 6.1% during 2026-2030 .

Systemic Inflammatory Response Syndrome Treatment market is segmented by Route of administration (Intravenous, Oral) Distribution channel (Offline, Online) End-user (Hospitals, Clinics, Others)

AbbVie Inc., AstraZeneca Plc, B.Braun SE, Baxter International Inc., Becton Dickinson and Co., BioMerieux SA, Dragerwerk AG and Co. KGaA, Edwards Lifesciences Corp., Eli Lilly and Co., F. Hoffmann La Roche Ltd., Fresenius Kabi AG, Getinge AB, GlaxoSmithKline Plc, Johnson and Johnson Services, Medtronic Plc, Merck and Co. Inc., Novartis AG, Pfizer Inc., Sanofi SA are a few of the key vendors in the Systemic Inflammatory Response Syndrome Treatment market.

North America will register the highest growth rate of 35.8% among the other regions. Therefore, the Systemic Inflammatory Response Syndrome Treatment market in North America is expected to garner significant business opportunities for the vendors during the forecast period.

US, Canada, Mexico, Germany, UK, France, Italy, The Netherlands, Spain, Russia, China, India, Japan, South Korea, Indonesia, Thailand, Singapore, Brazil, Australia, South Africa, UAE, Saudi Arabia, Turkey

  • Increasing global incidence of sepsis and related inflammatory conditions is the driving factor this market.

The Systemic Inflammatory Response Syndrome Treatment market vendors should focus on grabbing business opportunities from the Route of administration segment as it accounted for the largest market share in the base year.