Table Linen Market Analysis, Size, and Forecast 2025-2029: North America (US, Canada, and Mexico), Europe (Germany, UK, and France), APAC (China, Japan, and India), South America (Brazil and Argentina), Middle East and Africa (Saudi Arabia, UAE, and South Africa), and Rest of World (ROW)

Table Linen Market Analysis, Size, and Forecast 2025-2029:
North America (US, Canada, and Mexico), Europe (Germany, UK, and France), APAC (China, Japan, and India), South America (Brazil and Argentina), Middle East and Africa (Saudi Arabia, UAE, and South Africa), and Rest of World (ROW)

Published: Dec 2025 288 Pages SKU: IRTNTR74459

Market Overview at a Glance

$2.20 B
Market Opportunity
3.8%
CAGR 2024 - 2029
48.7%
North America Growth
$7.74 B
Residential segment 2023

Table Linen Market Size 2025-2029

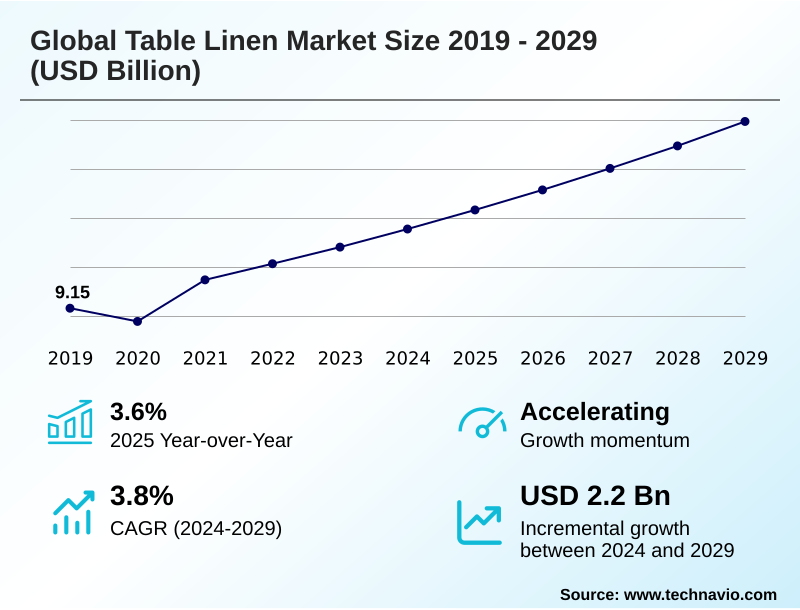
The table linen market size is valued to increase by USD 2.20 billion, at a CAGR of 3.8% from 2024 to 2029. Resurgent global hospitality sector and experiential dining trends will drive the table linen market.

Major Market Trends & Insights

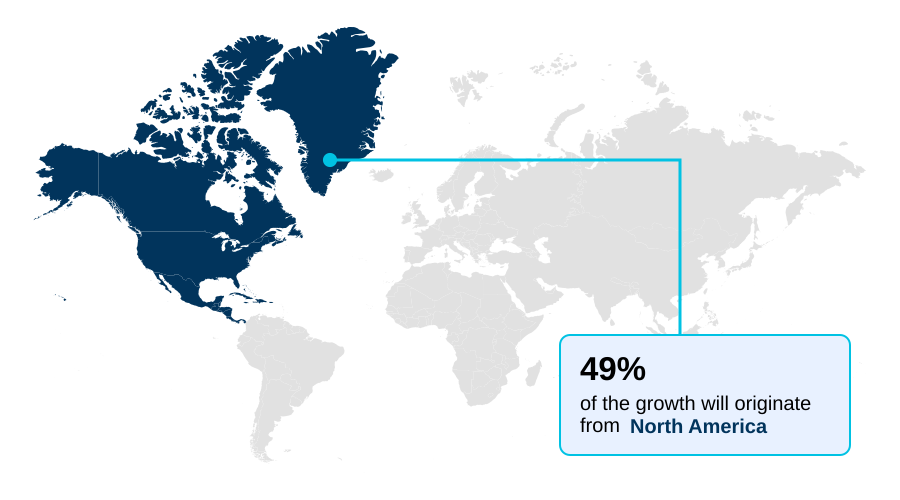
  • North America dominated the market and accounted for a 48.7% growth during the forecast period.
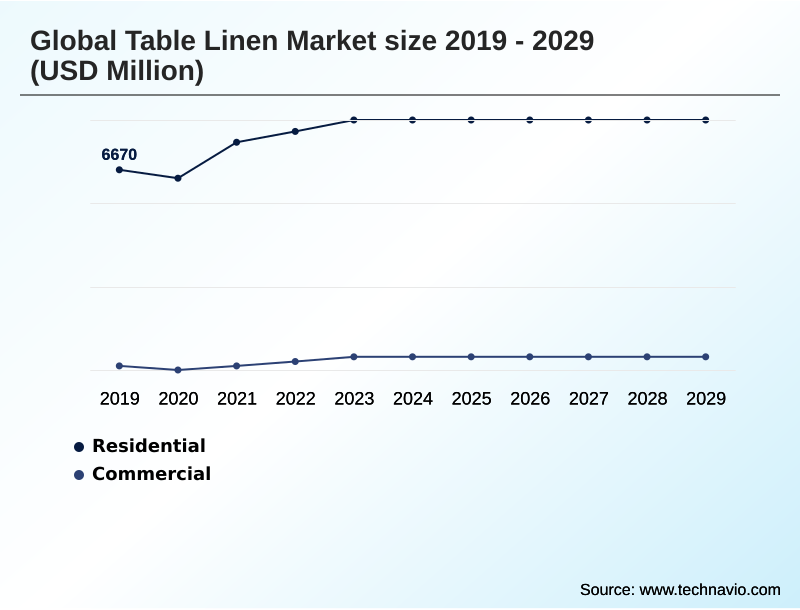
  • By End-user - Residential segment was valued at USD 7.74 billion in 2023
  • By Distribution Channel - Hypermarket or supermarket segment accounted for the largest market revenue share in 2023

Market Size & Forecast

  • Market Opportunities: USD 3.83 billion
  • Market Future Opportunities: USD 2.20 billion
  • CAGR from 2024 to 2029 : 3.8%

Market Summary

  • The table linen market is undergoing a significant transformation, propelled by the recovering hospitality sector and a shift in residential consumer behavior. Demand is increasingly driven by the pursuit of experiential dining, where high-quality linens are crucial for creating ambiance and reinforcing brand identity in commercial settings.
  • Simultaneously, in the residential space, table textiles are viewed as key interior design elements, with a growing preference for sustainable materials and unique designs. This has spurred innovation in sustainable textile production and the adoption of circular economy principles.
  • A key business scenario involves manufacturers optimizing their supply chains to manage the volatility of raw material costs, such as for GOTS certified cotton, by using advanced analytics to forecast demand and secure long-term contracts for flax-based textiles.
  • This strategic sourcing, combined with investments in waterless dyeing technology and efficient industrial laundering solutions for commercial-grade durability, allows companies to maintain margins while meeting stringent environmental standards and consumer expectations for both aesthetic appeal and ethical production in the table linen market.

What will be the Size of the Table Linen Market during the forecast period?

Get Key Insights on Market Forecast (PDF) Request Free Sample

How is the Table Linen Market Segmented?

The table linen industry research report provides comprehensive data (region-wise segment analysis), with forecasts and estimates in "USD million" for the period 2025-2029, as well as historical data from 2019-2023 for the following segments.

  • End-user
    • Residential
    • Commercial
  • Distribution channel
    • Hypermarket or supermarket
    • Online
    • Specialty stores
  • Product type
    • Tablecloths
    • Table napkins
    • Placemats
    • Others
  • Geography
    • North America
      • US
      • Canada
      • Mexico
    • Europe
      • Germany
      • UK
      • France
    • APAC
      • China
      • Japan
      • India
    • South America
      • Brazil
      • Argentina
    • Middle East and Africa
      • Saudi Arabia
      • UAE
      • South Africa
    • Rest of World (ROW)

By End-user Insights

The residential segment is estimated to witness significant growth during the forecast period.

The residential segment is shaped by discerning consumers who view table linens as integral to personal expression and home ambiance.

Purchasing decisions prioritize design, material quality, and alignment with values like sustainability over the wrinkle-free properties or durability emphasized in commercial settings.

The rise of the direct-to-consumer brand has empowered consumers with more choices, from jacquard patterns to customized table linen with personalized monograms. This segment exhibits strong demand for high-value items, including textiles with a high thread count and unique finishes.

The adoption of digital platforms has been a key enabler, with social media influencing trends in seasonal table decor and driving sales through visually compelling content, transforming how households engage with and purchase these products.

Request Free Sample

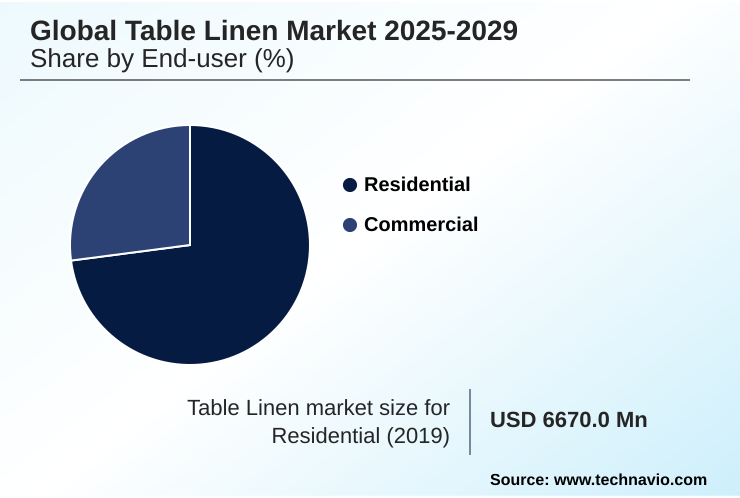
The Residential segment was valued at USD 7.74 billion in 2023 and showed a gradual increase during the forecast period.

Request Free Sample

Regional Analysis

North America is estimated to contribute 48.7% to the growth of the global market during the forecast period.Technavio’s analysts have elaborately explained the regional trends and drivers that shape the market during the forecast period.

See How Table Linen Market Demand is Rising in North America Request Free Sample

The geographic landscape is characterized by mature demand in North America and Europe and rapid growth in APAC.

North America, which accounts for 48.7% of the market's incremental growth, is driven by a strong hospitality sector and high consumer spending on interior design elements.

European markets emphasize sustainable textile production, with strong adherence to the OEKO-TEX standard and a preference for flax-based textiles.

In contrast, APAC's growth is fueled by urbanization and an expanding middle class seeking products that offer both function and style, including woven linen tablecloths.

The demand for surface protection and aesthetic quality is universal, but regional preferences for materials like mercerized cotton vary, influencing global supply chain strategies and product localization.

Market Dynamics

Our researchers analyzed the data with 2024 as the base year, along with the key drivers, trends, and challenges. A holistic analysis of drivers will help companies refine their marketing strategies to gain a competitive advantage.

  • The strategic direction of the global table linen market 2025-2029 is increasingly influenced by nuanced consumer and commercial demands.
  • Understanding the impact of raw material volatility on linen pricing is critical for maintaining profitability, with some manufacturers mitigating risk by shifting a portion of their portfolio to synthetic blends, a move that can stabilize costs by up to 15% compared to relying solely on natural fibers.
  • Concurrently, the benefits of circular economy in textile manufacturing are becoming a central competitive advantage. Companies that offer take-back or leasing programs are not only enhancing their sustainability credentials but also building long-term client relationships.
  • The demand for custom linen solutions for the hospitality industry continues to grow as hotels and restaurants seek to create unique brand experiences through bespoke textiles. In the residential market, the debate between stain-resistant vs. untreated natural fiber tablecloths highlights a key consumer trade-off between convenience and authenticity.
  • Ultimately, the segment for sustainable table linen for eco-conscious consumers is expanding rapidly, pushing the entire industry toward greater transparency and more responsible production practices, from sourcing to finishing.

What are the key market drivers leading to the rise in the adoption of Table Linen Industry?

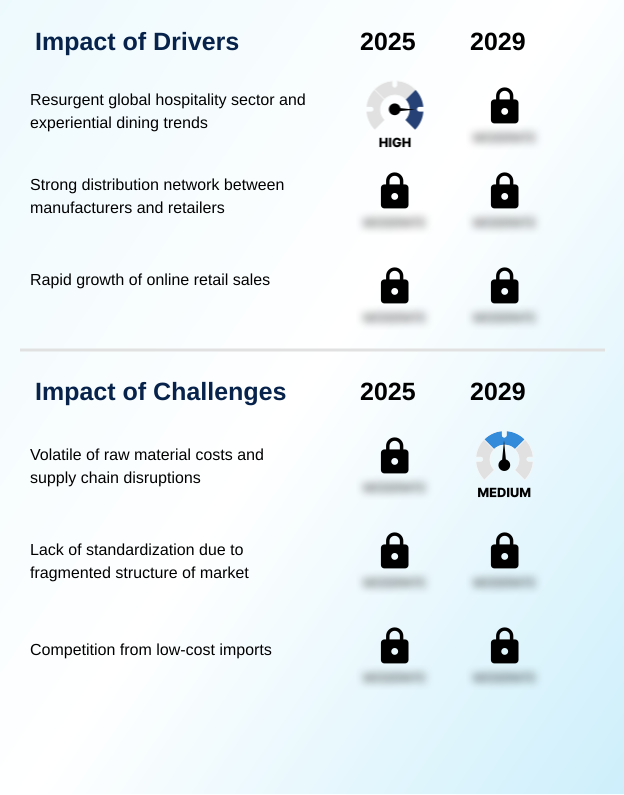
  • The resurgent global hospitality sector, coupled with evolving experiential dining trends, serves as a primary driver for market growth.

  • The resurgent hospitality sector is a major driver, with establishments investing in experiential dining ambiance to attract and retain customers. This has boosted demand for premium textile quality linens capable of withstanding frequent industrial laundering.
  • For example, high-end restaurants using linens with superior tactile fabric properties report a 15% increase in positive customer experience feedback.
  • The call for aesthetic enhancement has led to innovations in digital textile printing, allowing for bespoke linen design that aligns with a venue's brand identity.
  • This focus on creating unique environments for fine dining aesthetics and banquet table settings underpins consistent growth in the commercial sector, where product performance and visual appeal are paramount.

What are the market trends shaping the Table Linen Industry?

  • The accelerated integration of sustainability and circular economy principles is a transformative trend. It is reshaping the entire product lifecycle from material sourcing to end-of-life management.

  • A primary trend is the deep integration of sustainability, where circular economy principles are redefining the product lifecycle. Manufacturers are adopting waterless dyeing technology and prioritizing GOTS certified cotton, with some achieving a 20% reduction in water usage. This shift supports the growing demand for luxury home textiles and aligns with corporate mandates for supply chain transparency.
  • The development of a textile-as-a-service model, particularly for commercial clients, is gaining traction. This model optimizes the use of linens with high commercial-grade durability. The emphasis on ethical sourcing has become a key differentiator, influencing consumer choice in both residential and commercial segments. This movement toward transparent and responsible manufacturing is a defining characteristic of the market's evolution.

What challenges does the Table Linen Industry face during its growth?

  • The volatility of raw material costs and persistent supply chain disruptions present a significant challenge to industry growth and profitability.

  • Navigating raw material cost volatility remains a primary challenge, impacting the production of goods from natural fibers to cotton-polyester blends. For instance, unpredictable cotton prices can increase production costs by up to 30% in a single quarter, squeezing margins for manufacturers of private label textiles.
  • This forces companies to innovate with materials that offer a stain-resistant finish and superior color-fastness at a stable cost. Another challenge is meeting the demand for specialized features like fire retardant fabric without compromising on feel or sustainability.
  • Balancing these technical requirements with the aesthetic demands of residential home decor and the need for an effective omnichannel retail strategy complicates product development for many players.

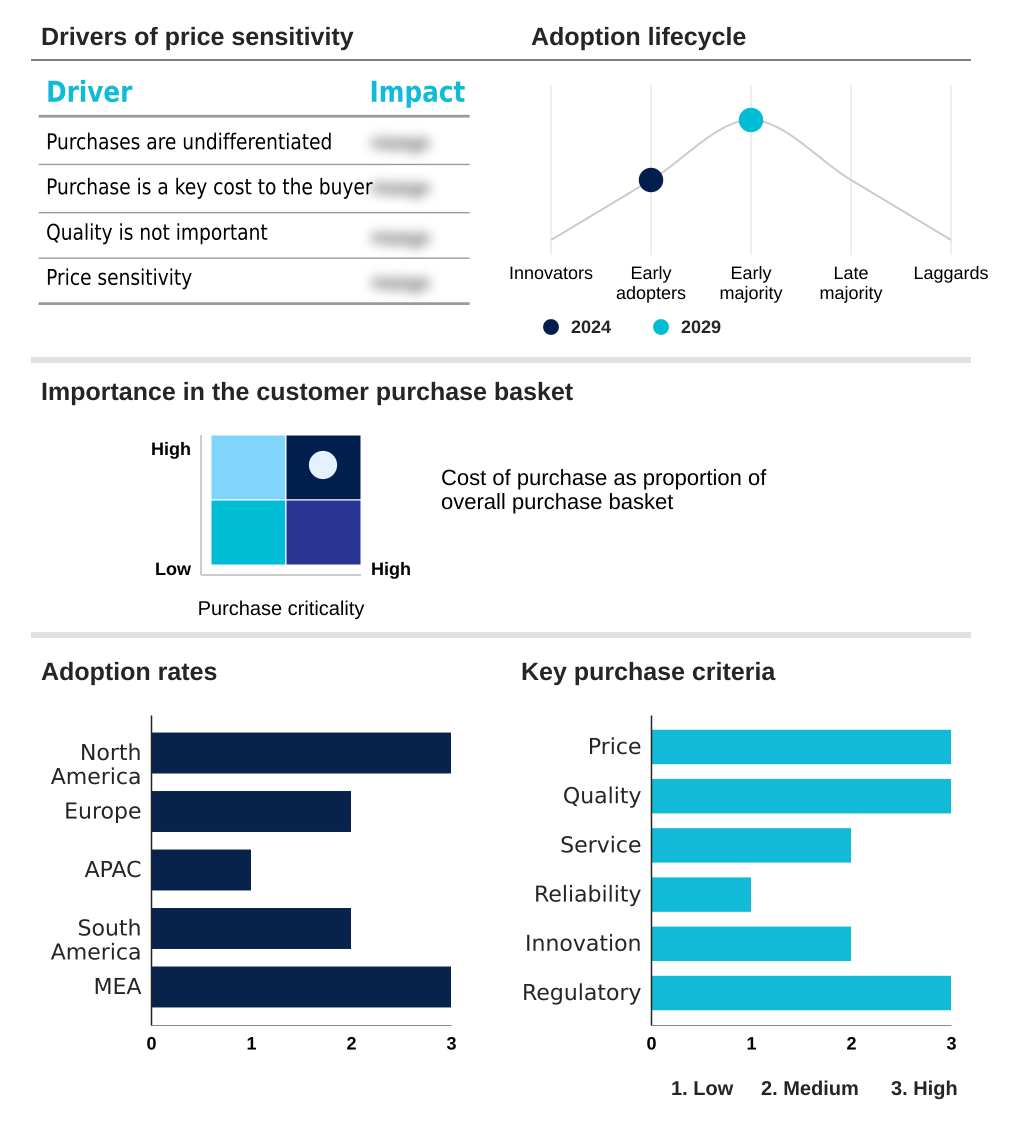
Exclusive Technavio Analysis on Customer Landscape

The table linen market forecasting report includes the adoption lifecycle of the market, covering from the innovator’s stage to the laggard’s stage. It focuses on adoption rates in different regions based on penetration. Furthermore, the table linen market report also includes key purchase criteria and drivers of price sensitivity to help companies evaluate and develop their market growth analysis strategies.

Customer Landscape of Table Linen Industry

Competitive Landscape

Companies are implementing various strategies, such as strategic alliances, table linen market forecast, partnerships, mergers and acquisitions, geographical expansion, and product/service launches, to enhance their presence in the industry.

AB Siulas - Expertise lies in crafting woven linen tablecloths and napkins from premium flax fabrics, serving both discerning residential and commercial clients with a focus on quality and tradition.

The industry research and growth report includes detailed analyses of the competitive landscape of the market and information about key companies, including:

  • AB Siulas
  • Amoda Comfort Linen
  • Balavigna Mills Pvt. Ltd.
  • BBJ La Tavola
  • Belinor Textile Ltd.
  • Beltrami Linen Srl
  • Binlin Linen Manufacturers
  • Dileep Essentials Pvt Ltd
  • Fabrica Maria SA de CV
  • H Concept
  • Jomar Table Linens
  • Natural Fabrics SL
  • Once Milano SRL
  • Paradigm International
  • Prestige Linens
  • Royal Linen
  • Silver Arcade Linen LLC
  • Star Linen USA
  • UAB Baltic Flax
  • Volga Linen

Qualitative and quantitative analysis of companies has been conducted to help clients understand the wider business environment as well as the strengths and weaknesses of key industry players. Data is qualitatively analyzed to categorize companies as pure play, category-focused, industry-focused, and diversified; it is quantitatively analyzed to categorize companies as dominant, leading, strong, tentative, and weak.

Recent Development and News in Table linen market

  • In September 2024, BBJ La Tavola announced a strategic partnership with a leading sustainable textile innovator to develop a new line of table linens made from 100% recycled materials, targeting the eco-conscious event industry.
  • In November 2024, Prestige Linens completed its acquisition of a regional specialty linen provider, expanding its distribution network and market share in the commercial hospitality sector by 15%.
  • In February 2025, UAB Baltic Flax launched a direct-to-consumer e-commerce platform featuring AI-powered customization tools, allowing residential customers to design bespoke, stonewashed table linen sets.
  • In April 2025, Amoda Comfort Linen received Bluesign certification for its entire production line, verifying its commitment to sustainable manufacturing processes and resource efficiency.

Dive into Technavio’s robust research methodology, blending expert interviews, extensive data synthesis, and validated models for unparalleled Table Linen Market insights. See full methodology.

Market Scope
Page number 288
Base year 2024
Historic period 2019-2023
Forecast period 2025-2029
Growth momentum & CAGR Accelerate at a CAGR of 3.8%
Market growth 2025-2029 USD 2201.0 million
Market structure Fragmented
YoY growth 2024-2025(%) 3.6%
Key countries US, Canada, Mexico, Germany, UK, France, Italy, Spain, The Netherlands, China, Japan, India, South Korea, Indonesia, Australia, Brazil, Argentina, Chile, Saudi Arabia, UAE, South Africa, Egypt and Nigeria
Competitive landscape Leading Companies, Market Positioning of Companies, Competitive Strategies, and Industry Risks

Request Free Sample

Research Analyst Overview

  • The table linen market is evolving beyond functionality, becoming integral to brand storytelling and customer experience. A significant boardroom-level focus is the alignment of product portfolios with circular economy principles, moving toward a textile-as-a-service model, particularly in the commercial sector. This involves strategic investments in commercial-grade durability and fabrics suitable for intensive industrial laundering.
  • Innovations in digital textile printing and bespoke linen design are enabling mass customization. For instance, manufacturers adopting on-demand production have reduced inventory holding costs by over 25%. The push for sustainability is evident in the widespread adoption of GOTS certified cotton and OEKO-TEX standards.
  • Firms are leveraging everything from flax-based textiles and woven linen tablecloths to high thread count damask weave and mercerized cotton, often with a stain-resistant finish or fire retardant fabric treatment, to meet diverse client needs.
  • This requires navigating complex supply chains for materials like jacquard patterns while ensuring color-fastness and wrinkle-free properties, all underpinned by sustainable textile production methods such as waterless dyeing technology and adherence to Bluesign certification. The result is a highly competitive environment where mildew-resistant treatment and premium quality define market leaders.

What are the Key Data Covered in this Table Linen Market Research and Growth Report?

  • What is the expected growth of the Table Linen Market between 2025 and 2029?

    • USD 2.20 billion, at a CAGR of 3.8%

  • What segmentation does the market report cover?

    • The report is segmented by End-user (Residential, Commercial), Distribution Channel (Hypermarket or supermarket, Online, Specialty stores), Product Type (Tablecloths, Table napkins, Placemats. Others (Table runners and Table skirting)) and Geography (North America, Europe, APAC, South America, Middle East and Africa)

  • Which regions are analyzed in the report?

    • North America, Europe, APAC, South America and Middle East and Africa

  • What are the key growth drivers and market challenges?

    • Resurgent global hospitality sector and experiential dining trends, Volatile of raw material costs and supply chain disruptions

  • Who are the major players in the Table Linen Market?

    • AB Siulas, Amoda Comfort Linen, Balavigna Mills Pvt. Ltd., BBJ La Tavola, Belinor Textile Ltd., Beltrami Linen Srl, Binlin Linen Manufacturers, Dileep Essentials Pvt Ltd, Fabrica Maria SA de CV, H Concept, Jomar Table Linens, Natural Fabrics SL, Once Milano SRL, Paradigm International, Prestige Linens, Royal Linen, Silver Arcade Linen LLC, Star Linen USA, UAB Baltic Flax and Volga Linen

Market Research Insights

  • The market is defined by a dynamic interplay between commercial and residential demand, with an increasing focus on product innovation and sustainability. Businesses leveraging an omnichannel retail strategy report customer engagement rates up to 80% higher than those with single-channel operations.
  • The adoption of direct-to-consumer brand models has enabled niche players to capture market share, with some achieving a 25% lower customer acquisition cost compared to traditional wholesale models. Furthermore, the emphasis on supply chain transparency is a key differentiator; firms providing full traceability for ethically sourced materials can command a price premium.
  • This shift toward value-added features like aesthetic enhancement and surface protection is redefining competitive dynamics across the industry.

We can help! Our analysts can customize this table linen market research report to meet your requirements.

Get in touch

1. Executive Summary

1.1 Market overview

Executive Summary - Chart on Market Overview
Executive Summary - Data Table on Market Overview
Executive Summary - Chart on Global Market Characteristics
Executive Summary - Chart on Market by Geography
Executive Summary - Chart on Market Segmentation by End-user
Executive Summary - Chart on Market Segmentation by Distribution Channel
Executive Summary - Chart on Market Segmentation by Product Type
Executive Summary - Chart on Incremental Growth
Executive Summary - Data Table on Incremental Growth
Executive Summary - Chart on Company Market Positioning

2. Technavio Analysis

2.1 Analysis of price sensitivity, lifecycle, customer purchase basket, adoption rates, and purchase criteria

2.2 Criticality of inputs and Factors of differentiation

Chart on Overview on criticality of inputs and factors of differentiation

2.3 Factors of disruption

Chart on Overview on factors of disruption

2.4 Impact of drivers and challenges

Chart on Impact of drivers and challenges in 2024 and 2029

3. Market Landscape

3.1 Market ecosystem

Chart on Parent Market
Data Table on - Parent Market

3.2 Market characteristics

Chart on Market characteristics analysis

3.3 Value chain analysis

Chart on Value chain analysis

4. Market Sizing

4.1 Market definition

Data Table on Offerings of companies included in the market definition

4.2 Market segment analysis

Market segments

4.3 Market size 2024

4.4 Market outlook: Forecast for 2024-2029

Chart on Global - Market size and forecast 2024-2029 ($ million)
Data Table on Global - Market size and forecast 2024-2029 ($ million)
Chart on Global Market: Year-over-year growth 2024-2029 (%)
Data Table on Global Market: Year-over-year growth 2024-2029 (%)

5. Historic Market Size

5.1 Global Table Linen Market 2019 - 2023

Historic Market Size - Data Table on Global Table Linen Market 2019 - 2023 ($ million)

5.2 End-user segment analysis 2019 - 2023

Historic Market Size - End-user Segment 2019 - 2023 ($ million)

5.3 Distribution Channel segment analysis 2019 - 2023

Historic Market Size - Distribution Channel Segment 2019 - 2023 ($ million)

5.4 Product Type segment analysis 2019 - 2023

Historic Market Size - Product Type Segment 2019 - 2023 ($ million)

5.5 Geography segment analysis 2019 - 2023

Historic Market Size - Geography Segment 2019 - 2023 ($ million)

5.6 Country segment analysis 2019 - 2023

Historic Market Size - Country Segment 2019 - 2023 ($ million)

6. Qualitative Analysis

6.1 Impact of AI on Global Table Linen Market

7. Five Forces Analysis

7.1 Five forces summary

Five forces analysis - Comparison between 2024 and 2029

7.2 Bargaining power of buyers

Bargaining power of buyers - Impact of key factors 2024 and 2029

7.3 Bargaining power of suppliers

Bargaining power of suppliers - Impact of key factors in 2024 and 2029

7.4 Threat of new entrants

Threat of new entrants - Impact of key factors in 2024 and 2029

7.5 Threat of substitutes

Threat of substitutes - Impact of key factors in 2024 and 2029

7.6 Threat of rivalry

Threat of rivalry - Impact of key factors in 2024 and 2029

7.7 Market condition

Chart on Market condition - Five forces 2024 and 2029

8. Market Segmentation by End-user

8.1 Market segments

Chart on End-user - Market share 2024-2029 (%)
Data Table on End-user - Market share 2024-2029 (%)

8.2 Comparison by End-user

Chart on Comparison by End-user
Data Table on Comparison by End-user

8.3 Residential - Market size and forecast 2024-2029

Chart on Residential - Market size and forecast 2024-2029 ($ million)
Data Table on Residential - Market size and forecast 2024-2029 ($ million)
Chart on Residential - Year-over-year growth 2024-2029 (%)
Data Table on Residential - Year-over-year growth 2024-2029 (%)

8.4 Commercial - Market size and forecast 2024-2029

Chart on Commercial - Market size and forecast 2024-2029 ($ million)
Data Table on Commercial - Market size and forecast 2024-2029 ($ million)
Chart on Commercial - Year-over-year growth 2024-2029 (%)
Data Table on Commercial - Year-over-year growth 2024-2029 (%)

8.5 Market opportunity by End-user

Market opportunity by End-user ($ million)
Data Table on Market opportunity by End-user ($ million)

9. Market Segmentation by Distribution Channel

9.1 Market segments

Chart on Distribution Channel - Market share 2024-2029 (%)
Data Table on Distribution Channel - Market share 2024-2029 (%)

9.2 Comparison by Distribution Channel

Chart on Comparison by Distribution Channel
Data Table on Comparison by Distribution Channel

9.3 Hypermarket or supermarket - Market size and forecast 2024-2029

Chart on Hypermarket or supermarket - Market size and forecast 2024-2029 ($ million)
Data Table on Hypermarket or supermarket - Market size and forecast 2024-2029 ($ million)
Chart on Hypermarket or supermarket - Year-over-year growth 2024-2029 (%)
Data Table on Hypermarket or supermarket - Year-over-year growth 2024-2029 (%)

9.4 Online - Market size and forecast 2024-2029

Chart on Online - Market size and forecast 2024-2029 ($ million)
Data Table on Online - Market size and forecast 2024-2029 ($ million)
Chart on Online - Year-over-year growth 2024-2029 (%)
Data Table on Online - Year-over-year growth 2024-2029 (%)

9.5 Specialty stores - Market size and forecast 2024-2029

Chart on Specialty stores - Market size and forecast 2024-2029 ($ million)
Data Table on Specialty stores - Market size and forecast 2024-2029 ($ million)
Chart on Specialty stores - Year-over-year growth 2024-2029 (%)
Data Table on Specialty stores - Year-over-year growth 2024-2029 (%)

9.6 Market opportunity by Distribution Channel

Market opportunity by Distribution Channel ($ million)
Data Table on Market opportunity by Distribution Channel ($ million)

10. Market Segmentation by Product Type

10.1 Market segments

Chart on Product Type - Market share 2024-2029 (%)
Data Table on Product Type - Market share 2024-2029 (%)

10.2 Comparison by Product Type

Chart on Comparison by Product Type
Data Table on Comparison by Product Type

10.3 Tablecloths - Market size and forecast 2024-2029

Chart on Tablecloths - Market size and forecast 2024-2029 ($ million)
Data Table on Tablecloths - Market size and forecast 2024-2029 ($ million)
Chart on Tablecloths - Year-over-year growth 2024-2029 (%)
Data Table on Tablecloths - Year-over-year growth 2024-2029 (%)

10.4 Table napkins - Market size and forecast 2024-2029

Chart on Table napkins - Market size and forecast 2024-2029 ($ million)
Data Table on Table napkins - Market size and forecast 2024-2029 ($ million)
Chart on Table napkins - Year-over-year growth 2024-2029 (%)
Data Table on Table napkins - Year-over-year growth 2024-2029 (%)

10.5 Placemats - Market size and forecast 2024-2029

Chart on Placemats - Market size and forecast 2024-2029 ($ million)
Data Table on Placemats - Market size and forecast 2024-2029 ($ million)
Chart on Placemats - Year-over-year growth 2024-2029 (%)
Data Table on Placemats - Year-over-year growth 2024-2029 (%)

10.6 Others - Market size and forecast 2024-2029

Chart on Others - Market size and forecast 2024-2029 ($ million)
Data Table on Others - Market size and forecast 2024-2029 ($ million)
Chart on Others - Year-over-year growth 2024-2029 (%)
Data Table on Others - Year-over-year growth 2024-2029 (%)

10.7 Market opportunity by Product Type

Market opportunity by Product Type ($ million)
Data Table on Market opportunity by Product Type ($ million)

11. Customer Landscape

11.1 Customer landscape overview

Analysis of price sensitivity, lifecycle, customer purchase basket, adoption rates, and purchase criteria

12. Geographic Landscape

12.1 Geographic segmentation

Chart on Market share by geography 2024-2029 (%)
Data Table on Market share by geography 2024-2029 (%)

12.2 Geographic comparison

Chart on Geographic comparison
Data Table on Geographic comparison

12.3 North America - Market size and forecast 2024-2029

Chart on North America - Market size and forecast 2024-2029 ($ million)
Data Table on North America - Market size and forecast 2024-2029 ($ million)
Chart on North America - Year-over-year growth 2024-2029 (%)
Data Table on North America - Year-over-year growth 2024-2029 (%)
Chart on Regional Comparison - North America
Data Table on Regional Comparison - North America

12.3.1 US - Market size and forecast 2024-2029

Chart on US - Market size and forecast 2024-2029 ($ million)
Data Table on US - Market size and forecast 2024-2029 ($ million)
Chart on US - Year-over-year growth 2024-2029 (%)
Data Table on US - Year-over-year growth 2024-2029 (%)

12.3.2 Canada - Market size and forecast 2024-2029

Chart on Canada - Market size and forecast 2024-2029 ($ million)
Data Table on Canada - Market size and forecast 2024-2029 ($ million)
Chart on Canada - Year-over-year growth 2024-2029 (%)
Data Table on Canada - Year-over-year growth 2024-2029 (%)

12.3.3 Mexico - Market size and forecast 2024-2029

Chart on Mexico - Market size and forecast 2024-2029 ($ million)
Data Table on Mexico - Market size and forecast 2024-2029 ($ million)
Chart on Mexico - Year-over-year growth 2024-2029 (%)
Data Table on Mexico - Year-over-year growth 2024-2029 (%)

12.4 Europe - Market size and forecast 2024-2029

Chart on Europe - Market size and forecast 2024-2029 ($ million)
Data Table on Europe - Market size and forecast 2024-2029 ($ million)
Chart on Europe - Year-over-year growth 2024-2029 (%)
Data Table on Europe - Year-over-year growth 2024-2029 (%)
Chart on Regional Comparison - Europe
Data Table on Regional Comparison - Europe

12.4.1 Germany - Market size and forecast 2024-2029

Chart on Germany - Market size and forecast 2024-2029 ($ million)
Data Table on Germany - Market size and forecast 2024-2029 ($ million)
Chart on Germany - Year-over-year growth 2024-2029 (%)
Data Table on Germany - Year-over-year growth 2024-2029 (%)

12.4.2 UK - Market size and forecast 2024-2029

Chart on UK - Market size and forecast 2024-2029 ($ million)
Data Table on UK - Market size and forecast 2024-2029 ($ million)
Chart on UK - Year-over-year growth 2024-2029 (%)
Data Table on UK - Year-over-year growth 2024-2029 (%)

12.4.3 France - Market size and forecast 2024-2029

Chart on France - Market size and forecast 2024-2029 ($ million)
Data Table on France - Market size and forecast 2024-2029 ($ million)
Chart on France - Year-over-year growth 2024-2029 (%)
Data Table on France - Year-over-year growth 2024-2029 (%)

12.4.4 Italy - Market size and forecast 2024-2029

Chart on Italy - Market size and forecast 2024-2029 ($ million)
Data Table on Italy - Market size and forecast 2024-2029 ($ million)
Chart on Italy - Year-over-year growth 2024-2029 (%)
Data Table on Italy - Year-over-year growth 2024-2029 (%)

12.4.5 Spain - Market size and forecast 2024-2029

Chart on Spain - Market size and forecast 2024-2029 ($ million)
Data Table on Spain - Market size and forecast 2024-2029 ($ million)
Chart on Spain - Year-over-year growth 2024-2029 (%)
Data Table on Spain - Year-over-year growth 2024-2029 (%)

12.4.6 The Netherlands - Market size and forecast 2024-2029

Chart on The Netherlands - Market size and forecast 2024-2029 ($ million)
Data Table on The Netherlands - Market size and forecast 2024-2029 ($ million)
Chart on The Netherlands - Year-over-year growth 2024-2029 (%)
Data Table on The Netherlands - Year-over-year growth 2024-2029 (%)

12.5 APAC - Market size and forecast 2024-2029

Chart on APAC - Market size and forecast 2024-2029 ($ million)
Data Table on APAC - Market size and forecast 2024-2029 ($ million)
Chart on APAC - Year-over-year growth 2024-2029 (%)
Data Table on APAC - Year-over-year growth 2024-2029 (%)
Chart on Regional Comparison - APAC
Data Table on Regional Comparison - APAC

12.5.1 China - Market size and forecast 2024-2029

Chart on China - Market size and forecast 2024-2029 ($ million)
Data Table on China - Market size and forecast 2024-2029 ($ million)
Chart on China - Year-over-year growth 2024-2029 (%)
Data Table on China - Year-over-year growth 2024-2029 (%)

12.5.2 Japan - Market size and forecast 2024-2029

Chart on Japan - Market size and forecast 2024-2029 ($ million)
Data Table on Japan - Market size and forecast 2024-2029 ($ million)
Chart on Japan - Year-over-year growth 2024-2029 (%)
Data Table on Japan - Year-over-year growth 2024-2029 (%)

12.5.3 India - Market size and forecast 2024-2029

Chart on India - Market size and forecast 2024-2029 ($ million)
Data Table on India - Market size and forecast 2024-2029 ($ million)
Chart on India - Year-over-year growth 2024-2029 (%)
Data Table on India - Year-over-year growth 2024-2029 (%)

12.5.4 South Korea - Market size and forecast 2024-2029

Chart on South Korea - Market size and forecast 2024-2029 ($ million)
Data Table on South Korea - Market size and forecast 2024-2029 ($ million)
Chart on South Korea - Year-over-year growth 2024-2029 (%)
Data Table on South Korea - Year-over-year growth 2024-2029 (%)

12.5.5 Indonesia - Market size and forecast 2024-2029

Chart on Indonesia - Market size and forecast 2024-2029 ($ million)
Data Table on Indonesia - Market size and forecast 2024-2029 ($ million)
Chart on Indonesia - Year-over-year growth 2024-2029 (%)
Data Table on Indonesia - Year-over-year growth 2024-2029 (%)

12.5.6 Australia - Market size and forecast 2024-2029

Chart on Australia - Market size and forecast 2024-2029 ($ million)
Data Table on Australia - Market size and forecast 2024-2029 ($ million)
Chart on Australia - Year-over-year growth 2024-2029 (%)
Data Table on Australia - Year-over-year growth 2024-2029 (%)

12.6 South America - Market size and forecast 2024-2029

Chart on South America - Market size and forecast 2024-2029 ($ million)
Data Table on South America - Market size and forecast 2024-2029 ($ million)
Chart on South America - Year-over-year growth 2024-2029 (%)
Data Table on South America - Year-over-year growth 2024-2029 (%)
Chart on Regional Comparison - South America
Data Table on Regional Comparison - South America

12.6.1 Brazil - Market size and forecast 2024-2029

Chart on Brazil - Market size and forecast 2024-2029 ($ million)
Data Table on Brazil - Market size and forecast 2024-2029 ($ million)
Chart on Brazil - Year-over-year growth 2024-2029 (%)
Data Table on Brazil - Year-over-year growth 2024-2029 (%)

12.6.2 Argentina - Market size and forecast 2024-2029

Chart on Argentina - Market size and forecast 2024-2029 ($ million)
Data Table on Argentina - Market size and forecast 2024-2029 ($ million)
Chart on Argentina - Year-over-year growth 2024-2029 (%)
Data Table on Argentina - Year-over-year growth 2024-2029 (%)

12.6.3 Chile - Market size and forecast 2024-2029

Chart on Chile - Market size and forecast 2024-2029 ($ million)
Data Table on Chile - Market size and forecast 2024-2029 ($ million)
Chart on Chile - Year-over-year growth 2024-2029 (%)
Data Table on Chile - Year-over-year growth 2024-2029 (%)

12.7 Middle East and Africa - Market size and forecast 2024-2029

Chart on Middle East and Africa - Market size and forecast 2024-2029 ($ million)
Data Table on Middle East and Africa - Market size and forecast 2024-2029 ($ million)
Chart on Middle East and Africa - Year-over-year growth 2024-2029 (%)
Data Table on Middle East and Africa - Year-over-year growth 2024-2029 (%)
Chart on Regional Comparison - Middle East and Africa
Data Table on Regional Comparison - Middle East and Africa

12.7.1 Saudi Arabia - Market size and forecast 2024-2029

Chart on Saudi Arabia - Market size and forecast 2024-2029 ($ million)
Data Table on Saudi Arabia - Market size and forecast 2024-2029 ($ million)
Chart on Saudi Arabia - Year-over-year growth 2024-2029 (%)
Data Table on Saudi Arabia - Year-over-year growth 2024-2029 (%)

12.7.2 UAE - Market size and forecast 2024-2029

Chart on UAE - Market size and forecast 2024-2029 ($ million)
Data Table on UAE - Market size and forecast 2024-2029 ($ million)
Chart on UAE - Year-over-year growth 2024-2029 (%)
Data Table on UAE - Year-over-year growth 2024-2029 (%)

12.7.3 South Africa - Market size and forecast 2024-2029

Chart on South Africa - Market size and forecast 2024-2029 ($ million)
Data Table on South Africa - Market size and forecast 2024-2029 ($ million)
Chart on South Africa - Year-over-year growth 2024-2029 (%)
Data Table on South Africa - Year-over-year growth 2024-2029 (%)

12.7.4 Egypt - Market size and forecast 2024-2029

Chart on Egypt - Market size and forecast 2024-2029 ($ million)
Data Table on Egypt - Market size and forecast 2024-2029 ($ million)
Chart on Egypt - Year-over-year growth 2024-2029 (%)
Data Table on Egypt - Year-over-year growth 2024-2029 (%)

12.7.5 Nigeria - Market size and forecast 2024-2029

Chart on Nigeria - Market size and forecast 2024-2029 ($ million)
Data Table on Nigeria - Market size and forecast 2024-2029 ($ million)
Chart on Nigeria - Year-over-year growth 2024-2029 (%)
Data Table on Nigeria - Year-over-year growth 2024-2029 (%)

12.8 Market opportunity by geography

Market opportunity by geography ($ million)
Data Tables on Market opportunity by geography ($ million)

13. Drivers, Challenges, and Opportunity

13.1 Market drivers

Resurgent global hospitality sector and experiential dining trends
Strong distribution network between manufacturers and retailers
Rapid growth of online retail sales

13.2 Market challenges

Volatile of raw material costs and supply chain disruptions
Lack of standardization due to fragmented structure of market
Competition from low-cost imports

13.3 Impact of drivers and challenges

Impact of drivers and challenges in 2024 and 2029

13.4 Market opportunities

Accelerated integration of sustainability and circular economy principles
Growing use of omnichannel strategy by market vendors
Increasing government initiatives to promote textile industry in emerging markets

14. Competitive Landscape

14.1 Overview

14.2

Overview on criticality of inputs and factors of differentiation

14.3 Landscape disruption

Overview on factors of disruption

14.4 Industry risks

Impact of key risks on business

15. Competitive Analysis

15.1 Companies profiled

Companies covered

15.2 Company ranking index

15.3 Market positioning of companies

Matrix on companies position and classification

15.4 AB Siulas

AB Siulas - Overview
AB Siulas - Product / Service
AB Siulas - Key offerings
SWOT

15.5 Amoda Comfort Linen

Amoda Comfort Linen - Overview
Amoda Comfort Linen - Product / Service
Amoda Comfort Linen - Key offerings
SWOT

15.6 Balavigna Mills Pvt. Ltd.

Balavigna Mills Pvt. Ltd. - Overview
Balavigna Mills Pvt. Ltd. - Product / Service
Balavigna Mills Pvt. Ltd. - Key offerings
SWOT

15.7 BBJ La Tavola

BBJ La Tavola - Overview
BBJ La Tavola - Product / Service
BBJ La Tavola - Key offerings
SWOT

15.8 Belinor Textile Ltd.

Belinor Textile Ltd. - Overview
Belinor Textile Ltd. - Product / Service
Belinor Textile Ltd. - Key offerings
SWOT

15.9 Beltrami Linen Srl

Beltrami Linen Srl - Overview
Beltrami Linen Srl - Product / Service
Beltrami Linen Srl - Key offerings
SWOT

15.10 Dileep Essentials Pvt Ltd

Dileep Essentials Pvt Ltd - Overview
Dileep Essentials Pvt Ltd - Product / Service
Dileep Essentials Pvt Ltd - Key offerings
SWOT

15.11 Fabrica Maria SA de CV

Fabrica Maria SA de CV - Overview
Fabrica Maria SA de CV - Product / Service
Fabrica Maria SA de CV - Key offerings
SWOT

15.12 Jomar Table Linens

Jomar Table Linens - Overview
Jomar Table Linens - Product / Service
Jomar Table Linens - Key offerings
SWOT

15.13 Natural Fabrics SL

Natural Fabrics SL - Overview
Natural Fabrics SL - Product / Service
Natural Fabrics SL - Key offerings
SWOT

15.14 Once Milano SRL

Once Milano SRL - Overview
Once Milano SRL - Product / Service
Once Milano SRL - Key offerings
SWOT

15.15 Prestige Linens

Prestige Linens - Overview
Prestige Linens - Product / Service
Prestige Linens - Key offerings
SWOT

15.16 Star Linen USA

Star Linen USA - Overview
Star Linen USA - Product / Service
Star Linen USA - Key offerings
SWOT

15.17 UAB Baltic Flax

UAB Baltic Flax - Overview
UAB Baltic Flax - Product / Service
UAB Baltic Flax - Key offerings
SWOT

15.18 Volga Linen

Volga Linen - Overview
Volga Linen - Product / Service
Volga Linen - Key offerings
SWOT

16. Appendix

16.1 Scope of the report

Market definition
Objectives
Notes and caveats

16.2 Inclusions and exclusions checklist

Inclusions checklist
Exclusions checklist

16.3 Currency conversion rates for US$

16.4 Research methodology

16.5 Data procurement

Information sources

16.6 Data validation

16.7 Validation techniques employed for market sizing

16.8 Data synthesis

16.9 360 degree market analysis

16.10 List of abbreviations

Research Methodology

Technavio presents a detailed picture of the market by way of study, synthesis, and summation of data from multiple sources. The analysts have presented the various facets of the market with a particular focus on identifying the key industry influencers. The data thus presented is comprehensive, reliable, and the result of extensive research, both primary and secondary.

INFORMATION SOURCES

Primary sources

  • Manufacturers and suppliers
  • Channel partners
  • Industry experts
  • Strategic decision makers

Secondary sources

  • Industry journals and periodicals
  • Government data
  • Financial reports of key industry players
  • Historical data
  • Press releases

DATA ANALYSIS

Data Synthesis

  • Collation of data
  • Estimation of key figures
  • Analysis of derived insights

Data Validation

  • Triangulation with data models
  • Reference against proprietary databases
  • Corroboration with industry experts

REPORT WRITING

Qualitative

  • Market drivers
  • Market challenges
  • Market trends
  • Five forces analysis

Quantitative

  • Market size and forecast
  • Market segmentation
  • Geographical insights
  • Competitive landscape

Interested in this report?

Get your sample now to see our research methodology and insights!

Download Now

Frequently Asked Questions

Table Linen market growth will increase by USD 2201.0 million during 2025-2029 .

The Table Linen market is expected to grow at a CAGR of 3.8% during 2025-2029 .

Table Linen market is segmented by End-user (Residential, Commercial) Distribution channel (Hypermarket or supermarket, Online, Specialty stores) Product type (Tablecloths, Table napkins, Placemats, Others)

AB Siulas, Amoda Comfort Linen, Balavigna Mills Pvt. Ltd., BBJ La Tavola, Belinor Textile Ltd., Beltrami Linen Srl, Binlin Linen Manufacturers, Dileep Essentials Pvt Ltd, Fabrica Maria SA de CV, H Concept, Jomar Table Linens, Natural Fabrics SL, Once Milano SRL, Paradigm International, Prestige Linens, Royal Linen, Silver Arcade Linen LLC, Star Linen USA, UAB Baltic Flax, Volga Linen are a few of the key vendors in the Table Linen market.

North America will register the highest growth rate of 48.7% among the other regions. Therefore, the Table Linen market in North America is expected to garner significant business opportunities for the vendors during the forecast period.

US, Canada, Mexico, Germany, UK, France, Italy, Spain, The Netherlands, China, Japan, India, South Korea, Indonesia, Australia, Brazil, Argentina, Chile, Saudi Arabia, UAE, South Africa, Egypt, Nigeria

  • Resurgent global hospitality sector and experiential dining trends is the driving factor this market.

The Table Linen market vendors should focus on grabbing business opportunities from the End-user segment as it accounted for the largest market share in the base year.