Enjoy complimentary customisation on priority with our Enterprise License!
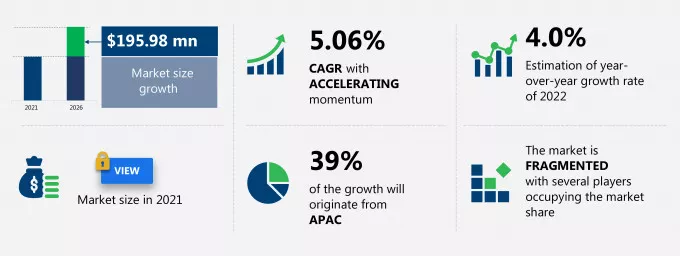
Based on Technavio's market sizing methodology, the tank container shipping market size is predicted to surge by USD 195.98 million from 2021 to 2026 at a CAGR of 5.06%. The post COVID-19 impact analysis on the market captured in this report will help players evaluate their business approaches. The tank container shipping market report also offers information on several market vendors, including Bertschi AG, Bulkhaul Ltd., Den Hartogh Holding BV, Eagletainer Logistics Pte Ltd, Gruber GmbH & Co. KG, HOYER GmbH, Intermodal Tank Transport Inc., NewPort Tank, Stolt-Nielsen Ltd., and Suttons Transport Group Ltd among others. Furthermore,This tank container shipping market research report extensively covers market segmentation by the following:
Download the Free Report Sample to Unlock the Tank Container Shipping Market Size for the Forecast Period and Other Important Statistics
Based on our research output, there has been a negative impact on the market growth during and post COVID-19 era. The growing seaborne trade is notably driving the tank container shipping market growth, although factors such as increased use of alternate energy sources may impede the market growth. Our research analysts have studied the historical data and deduced the key market drivers and the COVID-19 pandemic impact on the tank container shipping industry. The holistic analysis of the drivers will help in deducing end goals and refining marketing strategies to gain a competitive edge.
Key Tank Container Shipping Market Driver
Key Tank Container Shipping Market Trend
Key Tank Container Shipping Market Challenge
This tank container shipping market analysis report also provides detailed information on other upcoming trends and challenges that will have a far-reaching effect on the market growth. The actionable insights on the trends and challenges will help companies evaluate and develop growth strategies for 2022-2026.
Technavio categorizes the global air freight and logistics market as a part of the global air freight and logistics market. Our research report has extensively covered external factors influencing the parent market growth potential in the coming years, which will determine the levels of growth of the tank container shipping market during the forecast period.
The report analyzes the market's competitive landscape and offers information on several market vendors, including:
This statistical study of the tank container shipping market encompasses successful business strategies deployed by the key vendors. The tank container shipping market is fragmented and the vendors are deploying growth strategies such as joint ventures and partnerships to compete in the market.
Bertschi AG - The company offers tank container shipping such as liquids and dry bulk.
Bertschi AG - The liquids segment specializes in national and international transportation, storage, handling, and other logistics services for dry bulk and liquid products.
To make the most of the opportunities and recover from post COVID-19 impact, market vendors should focus more on the growth prospects in the fast-growing segments, while maintaining their positions in the slow-growing segments.
The tank container shipping market forecast report offers in-depth insights into key vendor profiles. The profiles include information on the production, sustainability, and prospects of the leading companies.
Our report provides extensive information on the value chain analysis for the tank container shipping market, which vendors can leverage to gain a competitive advantage during the forecast period. The end-to-end understanding of the value chain is essential in profit margin optimization and evaluation of business strategies. The data available in our value chain analysis segment can help vendors drive costs and enhance customer services during the forecast period.
For more insights on the market share of various regions Request for a FREE sample now!
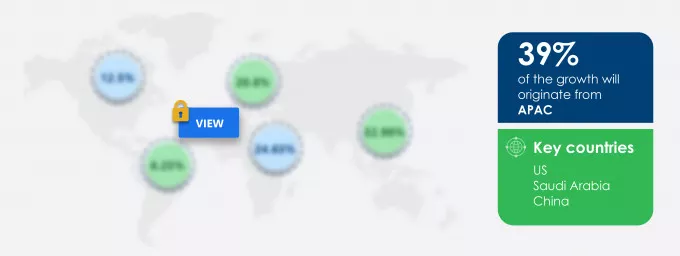
39% of the market's growth will originate from APAC during the forecast period. China is the key market for tank container shipping in APAC. Market growth in this region will be faster than the growth of the market in other regions.
An increase in international trade and the presence of growing economies such as China and India will facilitate the tank container shipping market growth in APAC over the forecast period. This market research report entails detailed information on the competitive intelligence, marketing gaps, and regional opportunities in store for vendors, which will assist in creating efficient business plans.
COVID Impact and Recovery Analysis
The outbreak of COVID-19 had a negative impact on the regional tank container shipping market in 2020. The pandemic resulted in numerous deaths in China and other nations, which prompted governments across the region to implement stringent nationwide lockdowns. However, in 2021, due to the availability of COVID-19 vaccines and the large-scale vaccination drives carried out by the governments of countries in APAC, activities in end-user industries gradually returned to normal. Therefore, the demand for tank container shipping increased, which will lead to the growth of the regional market during the forecast period.
To gain further insights on the market contribution of various segments Request for a FREE sample
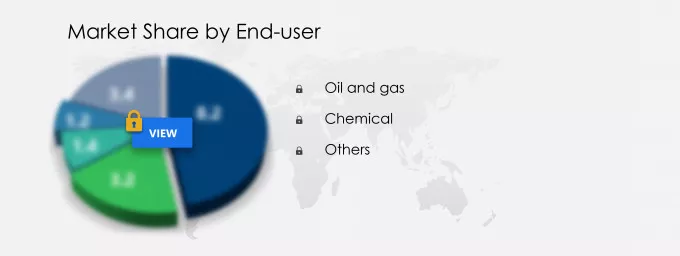
The tank container shipping market share growth by the oil and gas segment will be significant during the forecast period. The fall in crude oil prices results in an increased demand for various products manufactured from crude oil, which will drive the growth of the segment in the coming years. For instance, the demand for petrochemicals and polymer resins has witnessed a rise owing to the decrease in crude oil prices.
This report provides an accurate prediction of the contribution of all the segments to the growth of the tank container shipping market size and actionable market insights on post COVID-19 impact on each segment.
|
Tank Container Shipping Market Scope |
|
|
Report Coverage |
Details |
|
Page number |
120 |
|
Base year |
2021 |
|
Forecast period |
2022-2026 |
|
Growth momentum & CAGR |
Accelerate at a CAGR of 5.06% |
|
Market growth 2022-2026 |
195.98 million |
|
Market structure |
Fragmented |
|
YoY growth (%) |
4.0 |
|
Regional analysis |
Europe, APAC, North America, MEA, and South America |
|
Performing market contribution |
APAC at 39% |
|
Key consumer countries |
US, UK, China, Saudi Arabia, France, and India |
|
Competitive landscape |
Leading companies, Competitive strategies, Consumer engagement scope |
|
Key companies profiled |
Bertschi AG, Bulkhaul Ltd., Den Hartogh Holding BV, Eagletainer Logistics Pte Ltd, Gruber GmbH & Co. KG, HOYER GmbH, Intermodal Tank Transport Inc., NewPort Tank, Stolt-Nielsen Ltd., and Suttons Transport Group Ltd |
|
Market dynamics |
Parent market analysis, Market growth inducers and obstacles, Fast-growing and slow-growing segment analysis, COVID 19 impact and recovery analysis and future consumer dynamics, Market condition analysis for the forecast period |
|
Customization purview |
If our report has not included the data that you are looking for, you can reach out to our analysts and get segments customized. |
We can help! Our analysts can customize this report to meet your requirements. Get in touch
***1. Executive Summary
**1.1 Market overview
*Exhibit 01: Executive Summary – Chart on Market Overview
*Exhibit 02: Executive Summary – Data Table on Market Overview
*Exhibit 03: Executive Summary – Chart on Global Market Characteristics
*Exhibit 04: Executive Summary – Chart on Market by Geography
*Exhibit 05: Executive Summary – Chart on Market Segmentation by End-user
*Exhibit 06: Executive Summary – Chart on Incremental Growth
*Exhibit 07: Executive Summary – Data Table on Incremental Growth
*Exhibit 08: Executive Summary – Chart on Vendor Market Positioning
***2. Market Landscape
**2.1 Market ecosystem
*Exhibit 09: Parent market
*Exhibit 10: Market Characteristics
***3. Market Sizing
**3.1 Market definition
*Exhibit 11: Offerings of vendors included in the market definition
**3.2 Market segment analysis
*Exhibit 12: Market segments
**3.3 Market size 2021
**3.4 Market outlook: Forecast for 2021-2026
*Exhibit 13: Chart on Global - Market size and forecast 2021-2026 ($ million)
*Exhibit 14: Data Table on Global - Market size and forecast 2021-2026 ($ million)
*Exhibit 15: Chart on Global Market: Year-over-year growth 2021-2026 (%)
*Exhibit 16: Data Table on Global Market: Year-over-year growth 2021-2026 (%)
***4. Five Forces Analysis
**4.1 Five Forces Summary
*Exhibit 17: Five forces analysis - Comparison between2021 and 2026
**4.2 Bargaining power of buyers
*Exhibit 18: Chart on Bargaining power of buyers – Impact of key factors 2021 and 2026
**4.3 Bargaining power of suppliers
*Exhibit 19: Bargaining power of suppliers – Impact of key factors in 2021 and 2026
**4.4 Threat of new entrants
*Exhibit 20: Threat of new entrants – Impact of key factors in 2021 and 2026
**4.5 Threat of substitutes
*Exhibit 21: Threat of substitutes – Impact of key factors in 2021 and 2026
**4.6 Threat of rivalry
*Exhibit 22: Threat of rivalry – Impact of key factors in 2021 and 2026
**4.7 Market condition
*Exhibit 23: Chart on Market condition - Five forces 2021 and 2026
***5 Market Segmentation by End-user
**5.1 Market segments
*Exhibit 24: Chart on End-user - Market share 2021-2026 (%)
*Exhibit 25: Data Table on End-user - Market share 2021-2026 (%)
**5.2 Comparison by End-user
*Exhibit 26: Chart on Comparison by End-user
*Exhibit 27: Data Table on Comparison by End-user
**5.3 Oil and gas - Market size and forecast 2021-2026
*Exhibit 28: Chart on Oil and gas - Market size and forecast 2021-2026 ($ million)
*Exhibit 29: Data Table on Oil and gas - Market size and forecast 2021-2026 ($ million)
*Exhibit 30: Chart on Oil and gas - Year-over-year growth 2021-2026 (%)
*Exhibit 31: Data Table on Oil and gas - Year-over-year growth 2021-2026 (%)
**5.4 Chemical - Market size and forecast 2021-2026
*Exhibit 32: Chart on Chemical - Market size and forecast 2021-2026 ($ million)
*Exhibit 33: Data Table on Chemical - Market size and forecast 2021-2026 ($ million)
*Exhibit 34: Chart on Chemical - Year-over-year growth 2021-2026 (%)
*Exhibit 35: Data Table on Chemical - Year-over-year growth 2021-2026 (%)
**5.5 Others - Market size and forecast 2021-2026
*Exhibit 36: Chart on Others - Market size and forecast 2021-2026 ($ million)
*Exhibit 37: Data Table on Others - Market size and forecast 2021-2026 ($ million)
*Exhibit 38: Chart on Others - Year-over-year growth 2021-2026 (%)
*Exhibit 39: Data Table on Others - Year-over-year growth 2021-2026 (%)
**5.6 Market opportunity by End-user
*Exhibit 40: Market opportunity by End-user ($ million)
***6. Customer landscape
*Technavio’s customer landscape matrix comparing Drivers or price sensitivity, Adoption lifecycle, importance in customer price basket, Adoption rate and Key purchase criteria
**6.1 Customer landscape overview
*Exhibit 41: Analysis of price sensitivity, lifecycle, customer purchase basket, adoption rates, and purchase criteria
***7 Geographic Landscape
**7.1 Geographic segmentation
*Exhibit 42: Chart on Market share by geography 2021-2026 (%)
*Exhibit 43: Data Table on Market share by geography 2021-2026 (%)
**7.2 Geographic comparison
*Exhibit 44: Chart on Geographic comparison
*Exhibit 45: Data Table on Geographic comparison
**7.3 APAC - Market size and forecast 2021-2026
*Exhibit 46: Chart on APAC - Market size and forecast 2021-2026 ($ million)
*Exhibit 47: Data Table on APAC - Market size and forecast 2021-2026 ($ million)
*Exhibit 48: Chart on APAC - Year-over-year growth 2021-2026 (%)
*Exhibit 49: Data Table on APAC - Year-over-year growth 2021-2026 (%)
**7.4 Europe - Market size and forecast 2021-2026
*Exhibit 50: Chart on Europe - Market size and forecast 2021-2026 ($ million)
*Exhibit 51: Data Table on Europe - Market size and forecast 2021-2026 ($ million)
*Exhibit 52: Chart on Europe - Year-over-year growth 2021-2026 (%)
*Exhibit 53: Data Table on Europe - Year-over-year growth 2021-2026 (%)
**7.5 North America - Market size and forecast 2021-2026
*Exhibit 54: Chart on North America - Market size and forecast 2021-2026 ($ million)
*Exhibit 55: Data Table on North America - Market size and forecast 2021-2026 ($ million)
*Exhibit 56: Chart on North America - Year-over-year growth 2021-2026 (%)
*Exhibit 57: Data Table on North America - Year-over-year growth 2021-2026 (%)
**7.6 Middle East and Africa - Market size and forecast 2021-2026
*Exhibit 58: Chart on Middle East and Africa - Market size and forecast 2021-2026 ($ million)
*Exhibit 59: Data Table on Middle East and Africa - Market size and forecast 2021-2026 ($ million)
*Exhibit 60: Chart on Middle East and Africa - Year-over-year growth 2021-2026 (%)
*Exhibit 61: Data Table on Middle East and Africa - Year-over-year growth 2021-2026 (%)
**7.7 South America - Market size and forecast 2021-2026
*Exhibit 62: Chart on South America - Market size and forecast 2021-2026 ($ million)
*Exhibit 63: Data Table on South America - Market size and forecast 2021-2026 ($ million)
*Exhibit 64: Chart on South America - Year-over-year growth 2021-2026 (%)
*Exhibit 65: Data Table on South America - Year-over-year growth 2021-2026 (%)
**7.8 US - Market size and forecast 2021-2026
*Exhibit 66: Chart on US - Market size and forecast 2021-2026 ($ million)
*Exhibit 67: Data Table on US - Market size and forecast 2021-2026 ($ million)
*Exhibit 68: Chart on US - Year-over-year growth 2021-2026 (%)
*Exhibit 69: Data Table on US - Year-over-year growth 2021-2026 (%)
**7.9 UK - Market size and forecast 2021-2026
*Exhibit 70: Chart on UK - Market size and forecast 2021-2026 ($ million)
*Exhibit 71: Data Table on UK - Market size and forecast 2021-2026 ($ million)
*Exhibit 72: Chart on UK - Year-over-year growth 2021-2026 (%)
*Exhibit 73: Data Table on UK - Year-over-year growth 2021-2026 (%)
**7.10 China - Market size and forecast 2021-2026
*Exhibit 74: Chart on China - Market size and forecast 2021-2026 ($ million)
*Exhibit 75: Data Table on China - Market size and forecast 2021-2026 ($ million)
*Exhibit 76: Chart on China - Year-over-year growth 2021-2026 (%)
*Exhibit 77: Data Table on China - Year-over-year growth 2021-2026 (%)
**7.11 Saudi Arabia - Market size and forecast 2021-2026
*Exhibit 78: Chart on Saudi Arabia - Market size and forecast 2021-2026 ($ million)
*Exhibit 79: Data Table on Saudi Arabia - Market size and forecast 2021-2026 ($ million)
*Exhibit 80: Chart on Saudi Arabia - Year-over-year growth 2021-2026 (%)
*Exhibit 81: Data Table on Saudi Arabia - Year-over-year growth 2021-2026 (%)
**7.12 France - Market size and forecast 2021-2026
*Exhibit 82: Chart on France - Market size and forecast 2021-2026 ($ million)
*Exhibit 83: Data Table on France - Market size and forecast 2021-2026 ($ million)
*Exhibit 84: Chart on France - Year-over-year growth 2021-2026 (%)
*Exhibit 85: Data Table on France - Year-over-year growth 2021-2026 (%)
**7.13 India - Market size and forecast 2021-2026
*Exhibit 86: Chart on India - Market size and forecast 2021-2026 ($ million)
*Exhibit 87: Data Table on India - Market size and forecast 2021-2026 ($ million)
*Exhibit 88: Chart on India - Year-over-year growth 2021-2026 (%)
*Exhibit 89: Data Table on India - Year-over-year growth 2021-2026 (%)
**7.13 Market opportunity by geography
*Exhibit 90: Market opportunity by geography ($ million)
***8. Drivers, Challenges, and Trends
**8.1 Market drivers
*8.1.1 Growing seaborne trade
*8.1.2 New exploration policies
*8.1.3 Expansion of oil terminals
**8.2 Market challenges
*8.2.1 Increased use of alternative energy sources
*8.2.2 High operational cost
*8.2.3 Stringent regulations associated with chemical storage and transportation
**8.3 Impact of drivers and challenges
*Exhibit 91: Impact of drivers and challenges in 2021 and 2026
**8.4 Market trends
*8.4.1 Growing LNG trade
*8.4.2 Technological innovations driving productivity in tank container shipping market
*8.4.3 Rising investments in chemical manufacturing facilities in emerging regions
***9. Vendor Landscape
**9.1 Overview
**9.2 Vendor landscape
*Exhibit 92: Overview on Criticality of inputs and Factors of differentiation
**9.3 Landscape disruption
*Exhibit 93: Overview on factors of disruption
**9.4 Industry risks
*Exhibit 94: Impact of key risks on business
***10. Vendor Analysis
**10.1 Vendors covered
*Exhibit 95: Vendors covered
**10.2 Market positioning of vendors
*Exhibit 96: Matrix on vendor position and classification
**10.3 Bertschi AG
*Exhibit 97: Bertschi AG - Overview
*Exhibit 98: Bertschi AG - Product / Service
*Exhibit 99: Bertschi AG - Key offerings
**10.4 Bulkhaul Ltd.
*Exhibit 100: Bulkhaul Ltd. - Overview
*Exhibit 101: Bulkhaul Ltd. - Product / Service
*Exhibit 102: Bulkhaul Ltd. - Key offerings
**10.5 Den Hartogh Holding BV
*Exhibit 103: Den Hartogh Holding BV - Overview
*Exhibit 104: Den Hartogh Holding BV - Product / Service
*Exhibit 105: Den Hartogh Holding BV - Key offerings
**10.6 Eagletainer Logistics Pte Ltd
*Exhibit 106: Eagletainer Logistics Pte Ltd - Overview
*Exhibit 107: Eagletainer Logistics Pte Ltd - Product / Service
*Exhibit 108: Eagletainer Logistics Pte Ltd - Key offerings
**10.7 Gruber GmbH and Co. KG
*Exhibit 109: Gruber GmbH and Co. KG - Overview
*Exhibit 110: Gruber GmbH and Co. KG - Product / Service
*Exhibit 111: Gruber GmbH and Co. KG - Key offerings
**10.8 HOYER GmbH
*Exhibit 112: HOYER GmbH - Overview
*Exhibit 113: HOYER GmbH - Business segments
*Exhibit 114: HOYER GmbH - Key offerings
*Exhibit 115: HOYER GmbH - Segment focus
**10.9 Intermodal Tank Transport Inc.
&
Get lifetime access to our
Technavio Insights


