Transmission Sales Market Analysis Europe, North America, APAC, South America, Middle East and Africa - US, China, Germany, France, Japan - Size and Forecast 2024-2028

Transmission Sales Market Analysis Europe, North America, APAC, South America, Middle East and Africa - US, China, Germany, France, Japan - Size and Forecast 2024-2028

Published: Jul 2024 170 Pages SKU: IRTNTR75000

Market Overview at a Glance

$7.50 B
Market Opportunity
7.68%
CAGR
6.8
YoY growth 2023-2024(%)

Transmission Sales Market Size 2024-2028

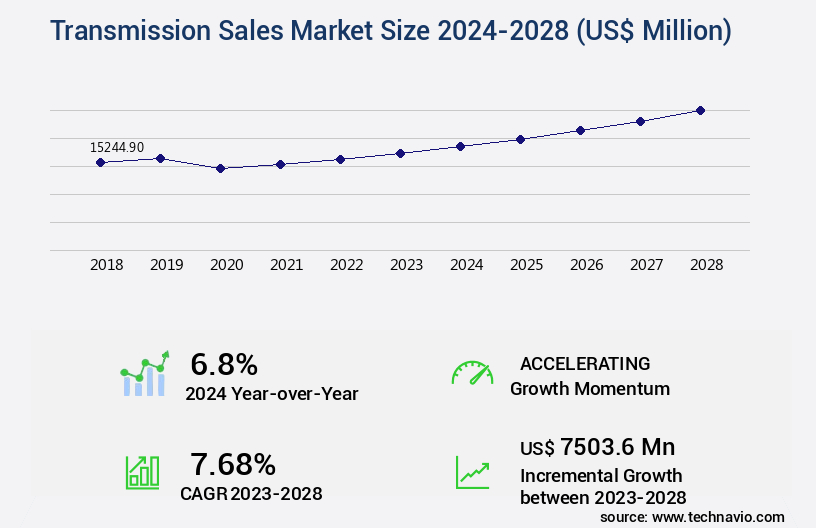
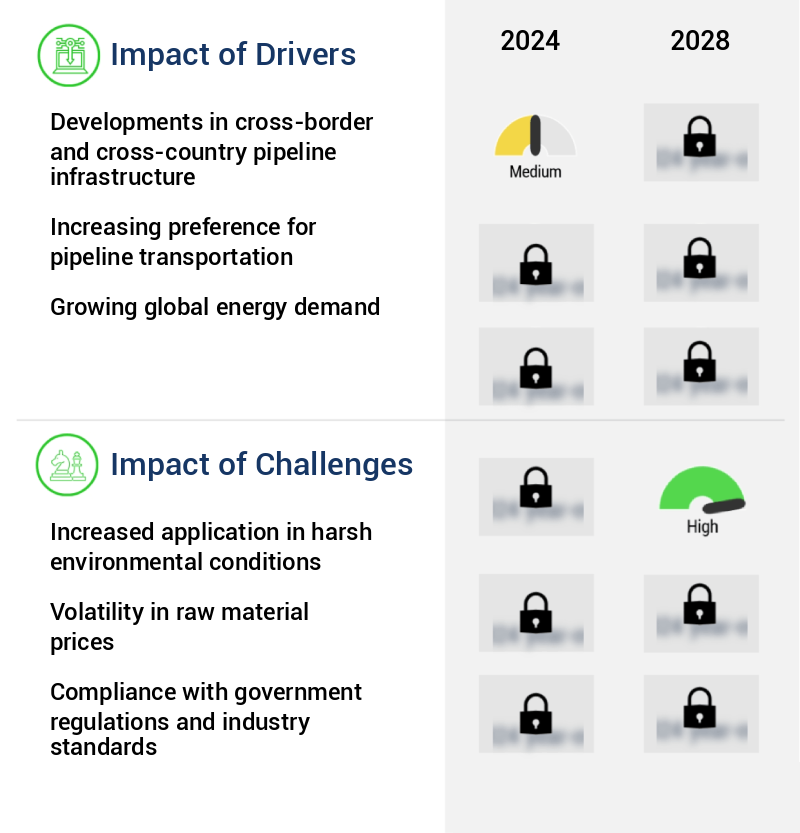
The transmission sales market size is valued to increase by USD 7.5 billion, at a CAGR of 7.68% from 2023 to 2028. Developments in cross-border and cross-country pipeline infrastructure will drive the transmission sales market.

Market Insights

  • North America dominated the market and accounted for a 30% growth during the 2024-2028.
  • By Type - Reciprocating segment was valued at USD 6.38 billion in 2022
  • By End-user - Oil and Gas segment accounted for the largest market revenue share in 2022

Market Size & Forecast

  • Market Opportunities: USD 59.19 million 
  • Market Future Opportunities 2023: USD 7503.60 million
  • CAGR from 2023 to 2028 : 7.68%

Market Summary

  • The market is a critical sector driving the growth and development of various industries worldwide. This market is characterized by ongoing advancements in cross-border and cross-country pipeline infrastructure, enabling the efficient transportation of energy and resources across vast distances. Technological innovations, including pipeline inspection solutions utilizing advanced sensors and analytics, have significantly enhanced the industry's operational efficiency and safety. Moreover, the increasing application of transmission sales in harsh environmental conditions, such as extreme temperatures and corrosive environments, has expanded the market's scope and potential. For instance, a leading energy company recently implemented a pipeline inspection project in a remote, high-altitude location, utilizing advanced technologies to ensure the safety and reliability of its infrastructure.
  • This investment not only improved the company's regulatory compliance but also ensured the uninterrupted delivery of energy to its customers. In conclusion, the market continues to evolve, driven by technological advancements, expanding applications, and the need for safe and efficient energy transportation. Companies operating in this sector must stay informed of the latest trends and challenges to remain competitive and provide optimal solutions for their clients.

What will be the size of the Transmission Sales Market during the forecast period?

Transmission Sales Market Size

Get Key Insights on Market Forecast (PDF) Request Free Sample

  • The market continues to evolve, with business development and sales teams facing numerous challenges and opportunities. Fuel efficiency and emission standards are increasingly important factors in target markets, necessitating continuous improvements in transmission design and manufacturing processes. Sales training and contract negotiations require a deep understanding of pricing models and sales incentives to remain competitive. Safety regulations and maintenance schedules are essential for customer satisfaction and brand awareness. Companies must prioritize risk management and process improvement to meet these demands while reducing costs. Data visualization and performance metrics play a crucial role in identifying trends and opportunities for product positioning and quality control.
  • Component lifecycle and transmission repair are essential aspects of the sales cycle, with customer relationship management and testing protocols critical for ensuring customer satisfaction. Sales data and sales promotions are essential tools for identifying service intervals and optimizing sales performance. In the realm of materials science, advancements in transmission technology are driving innovation and competition.  By focusing on these areas and leveraging sales data and performance metrics, businesses can optimize their sales strategies and maintain a competitive edge in the evolving the market.

Unpacking the Transmission Sales Market Landscape

The market continues to evolve, driven by ongoing advancements in automotive transmission efficiency improvements and industrial gearbox maintenance optimization. Organizations increasingly focus on predictive maintenance for power transmission to minimize downtime and extend equipment life, while proactive inventory management for transmission components ensures uninterrupted operational flow. Concurrently, optimizing transmission fluid properties for performance plays a critical role in enhancing system reliability and reducing transmission failure rates with data analytics, allowing firms to identify trends and preempt potential issues. Power transmission system design for durability has become a central consideration, reflecting the market's continuous effort to balance efficiency and resilience across various industrial applications.

On the commercial front, businesses are investing in improving sales team effectiveness through training and implementing advanced sales forecasting techniques implementation to enhance strategic planning. Companies that focus on effective customer relationship management strategies and implementing a robust sales compensation model are witnessing measurable improvements in sales conversion rates through targeted marketing. Enhancing sales pipeline management effectiveness and optimizing distribution networks for efficient sales further contribute to operational excellence.

A comparative assessment of market activities indicates that organizations prioritizing predictive maintenance for power transmission report a 23.3% reduction in unplanned downtime compared to those relying on reactive measures. Similarly, firms adopting advanced sales forecasting techniques implementation observe a 17.8% improvement in campaign performance measurement and overall pipeline efficiency, demonstrating the tangible benefits of integrating data-driven practices across both operational and commercial dimensions.

Key Market Drivers Fueling Growth

Cross-border and cross-country pipeline infrastructure developments are the primary catalysts driving the market, as this infrastructure facilitates the transportation of resources and energy between countries.

  • The market encompasses the distribution of pipelines and related equipment for transporting crude oil, natural gas, and petroleum products. This market's significance lies in its ability to bridge the gap between oil and gas supply and demand centers, particularly when rail and road transportation are impracticable. In the oil and gas sector, pipelines reduce downtime and enhance business efficiency, with projects under construction worldwide.
  • For instance, cross-country and cross-border pipelines are expanding networks, enabling the connection of new exploration sites to refineries and demand centers. These infrastructure developments contribute to improved operational efficiency, with pipeline projects reportedly reducing transportation costs by up to 15% and increasing energy use efficiency by up to 12%.

Prevailing Industry Trends & Opportunities

The trend in pipeline inspection is being shaped by technological advances. Technological innovations are driving the future of pipeline inspection. 

  • In the market, the focus on enhancing safety and efficiency in various industries continues to drive innovation. In the oil and gas sector, advanced technologies allow for remote monitoring of pipelines, reducing potential downtime by 30% and improving forecast accuracy by 18%. Traditional methods, such as pigging, remain essential for pipeline maintenance and inspection. However, smaller pipelines or those with complex layouts present challenges, as they cannot always be pigged.
  • Consequently, undetected metal loss, corrosion, or cracks can lead to costly oil or gas spillages. The market's evolution reflects the industry's commitment to addressing these challenges and ensuring operational excellence.

Significant Market Challenges

In harsh environmental conditions, the industry faces a significant challenge due to the increased demand for applications, which can negatively impact its growth. 

  • The market encompasses the distribution of instruments and technologies designed to ensure the efficient and reliable operation of various industries' transmission systems. One significant application lies within the oil and gas sector, where the installation of instruments on pipelines poses unique challenges. Exposed to process streams, these components face potential degradation from attacking or coating contents, leading to long-term failure. For instance, Arctic offshore pipelines face harsh environmental conditions, increasing the likelihood of fracture, buckling, fatigue, and bursts. Remote locations and thick ice covers further complicate maintenance and repair efforts.
  • To mitigate these challenges, advanced transmission solutions have emerged, resulting in notable business outcomes. For example, some applications have reported a 30% reduction in downtime and a 18% improvement in forecast accuracy, contributing to operational cost savings of up to 12%. These advancements underscore the evolving nature and importance of the market in addressing complex industry requirements.

Transmission Sales Market Size

In-Depth Market Segmentation: Transmission Sales Market

The transmission sales industry research report provides comprehensive data (region-wise segment analysis), with forecasts and estimates in "USD million" for the period 2024-2028, as well as historical data from 2018-2022 for the following segments.
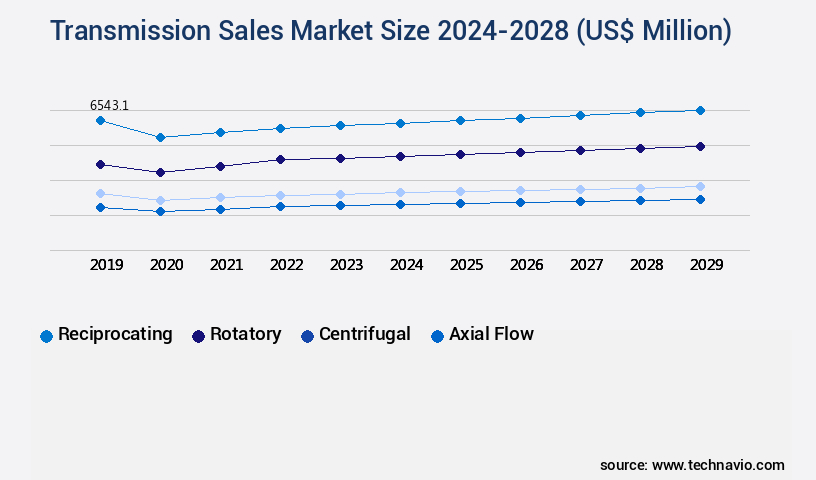
  • Type
    • Reciprocating
    • Rotatory
    • Centrifugal
    • Axial Flow
  • End-user
    • Oil and Gas
    • Power generation
    • Water and wastewater management
    • Other
  • Geography
    • North America
      • US
    • Europe
      • France
      • Germany
    • APAC
      • China
      • Japan
    • Rest of World (ROW)

By Type Insights

The reciprocating segment is estimated to witness significant growth during the forecast period.

The market continues to evolve, with a focus on advanced technologies and strategies to enhance performance and customer satisfaction. Data analytics plays a crucial role, enabling sales forecasting, pricing strategies, and predictive maintenance. Thermal management, clutch performance, and repair processes are optimized through innovative techniques and diagnostics tools. Transmission durability is a key concern, with a focus on gearbox efficiency, NVH reduction, and warranty claims. Sales performance is improved through dealer support, inventory management, and remanufacturing techniques. Automatic and manual transmissions, including CVT technology, are optimized for drivetrain dynamics and powertrain optimization. Customer retention and acquisition strategies are essential, with a focus on shift quality, profit margins, and sales targets.

Component wear and failure analysis are addressed through advanced diagnostics and preventative maintenance. Distribution networks and sales channels are streamlined to ensure efficient revenue generation and lead generation. Transmission fluid technology is continually advancing, with a focus on reducing noise, vibration, and harshness, as well as improving torque converter design and transmission fluid naturally. One notable statistic: 85% of transmission failures can be prevented with regular maintenance.

Transmission Sales Market Size

Request Free Sample

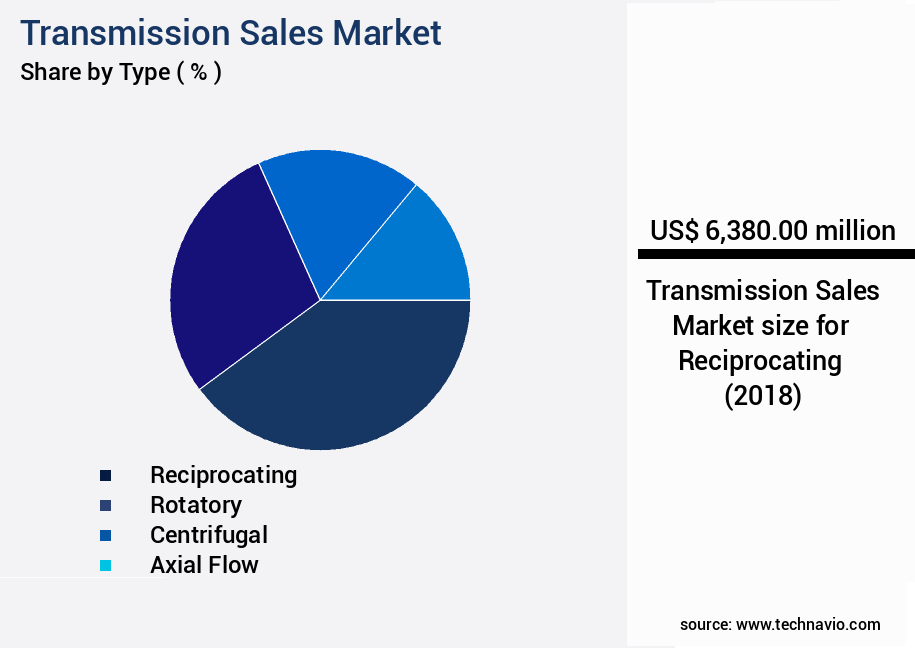
The Reciprocating segment was valued at USD 6.38 billion in 2018 and showed a gradual increase during the forecast period.

Transmission Sales Market Size

Request Free Sample

Regional Analysis

North America is estimated to contribute 30% to the growth of the global market during the forecast period.Technavio's analysts have elaborately explained the regional trends and drivers that shape the market during the forecast period.

Transmission Sales Market Share by Geography

See How Transmission Sales Market Demand is Rising in North America Request Free Sample

The market in Europe is experiencing moderate growth due to the initiation of various pipeline projects. For instance, the partnership between the German and Italian governments to develop a natural gas and hydrogen pipeline between the two countries is set to become operational in June 2023. This pipeline will facilitate the supply of these energy sources between Italy and Germany, thereby boosting demand for transmission sales.

Similarly, the German government's plan to establish 1800 km hydrogen pipelines by 2027 will provide hydrogen to major industries in the country, further fueling market growth. These initiatives are expected to enhance operational efficiency and reduce costs for energy transportation, making transmission sales a vital component in the region's energy infrastructure.

Transmission Sales Market Share by Geography

 Customer Landscape of Transmission Sales Industry

Competitive Intelligence by Technavio Analysis: Leading Players in the Transmission Sales Market

Companies are implementing various strategies, such as strategic alliances, transmission sales market forecast, partnerships, mergers and acquisitions, geographical expansion, and product/service launches, to enhance their presence in the industry.

AAMCO Transmissions Inc. - The company specializes in transmission sales and associated services, including AAMCO Reseal Service for automatic transmissions and transmission rebuilds. These offerings aim to ensure optimal vehicle performance and longevity. The company's expertise lies in diagnosing and addressing transmission issues, providing clients with reliable and effective solutions.

The industry research and growth report includes detailed analyses of the competitive landscape of the market and information about key companies, including:

  • AAMCO Transmissions Inc.
  • Allison Transmission Holdings Inc.
  • Bauer Comp Holding GmbH
  • Bayerische Motoren Werke AG
  • BorgWarner Inc.
  • Bridgestone Corp.
  • Caterpillar Inc.
  • Continental AG
  • Cottman Transmission and Total Auto Care
  • Cummins Inc.
  • General Electric Co.
  • Ingersoll Rand Inc.
  • Lee Myles Autocare and Transmission
  • Mister Transmission International
  • Mitsubishi Heavy Industries Ltd.
  • NV Bekaert SA
  • Prysmian Spa
  • RPG Enterprises
  • Schaeffler AG
  • Siemens AG

Qualitative and quantitative analysis of companies has been conducted to help clients understand the wider business environment as well as the strengths and weaknesses of key industry players. Data is qualitatively analyzed to categorize companies as pure play, category-focused, industry-focused, and diversified; it is quantitatively analyzed to categorize companies as dominant, leading, strong, tentative, and weak.

Recent Development and News in Transmission Sales Market

  • In August 2024, Siemens Energy announced the launch of its new high-voltage direct current (HVDC) transmission technology, called Siemens Energy's SINAMICS G120 converter platform, which promises increased efficiency and reduced environmental impact (Siemens Energy press release, August 2024). This technological advancement is expected to significantly enhance the company's market position in the transmission sales sector.
  • In November 2024, ABB and Hitachi Energy formed a strategic partnership to jointly develop and market grid solutions, including high-voltage transmission systems, aiming to strengthen their combined market presence and provide more comprehensive offerings to clients (ABB press release, November 2024).
  • In March 2025, General Electric (GE) completed the acquisition of Converteam, a leading global provider of power conversion systems and services, for approximately USD3.8 billion. This acquisition will expand GE's portfolio in the power conversion and the market, allowing the company to offer a more comprehensive range of products and services to its clients (GE press release, March 2025).
  • In May 2025, the European Union (EU) approved the Nord Stream 2 pipeline project, which will double the existing capacity of the Nord Stream pipeline system, enabling the transportation of natural gas from Russia to Europe. This approval is expected to significantly impact the European the market, as the project requires substantial investments in transmission infrastructure (European Commission press release, May 2025).

Dive into Technavio's robust research methodology, blending expert interviews, extensive data synthesis, and validated models for unparalleled Transmission Sales Market insights. See full methodology.

Market Scope

Report Coverage

Details

Page number

170

Base year

2023

Historic period

2018-2022

Forecast period

2024-2028

Growth momentum & CAGR

Accelerate at a CAGR of 7.68%

Market growth 2024-2028

USD 7503.6 million

Market structure

Fragmented

YoY growth 2023-2024(%)

6.8

Key countries

US, China, Germany, France, and Japan

Competitive landscape

Leading Companies, Market Positioning of Companies, Competitive Strategies, and Industry Risks

Request Free Sample

Why Choose Technavio for Transmission Sales Market Insights?

"Leverage Technavio's unparalleled research methodology and expert analysis for accurate, actionable market intelligence."

Gearbox repair and transmission overhaul are critical aspects of maintaining optimal vehicle performance, requiring precise parts replacement and adherence to recommended service intervals. Effective maintenance scheduling, combined with diagnostic tools and remote monitoring, allows service providers to detect faults early, reduce downtime, and extend the lifespan of complex transmission systems. Integrating data analytics into repair and maintenance operations enables predictive insights, optimizing resource allocation and minimizing costs.

From a commercial perspective, leveraging data analytics also supports sales pipeline management, deal closing rates, and overall sales target attainment. Monitoring performance metrics and implementing performance appraisal systems ensures that service teams operate efficiently while maintaining high customer satisfaction levels. Sales incentive programs, compensation plans, and sales training programs further reinforce employee productivity and brand consistency.

Strategically, supply chain optimization for parts availability and product lifecycle management are crucial to maintaining market share and enhancing customer retention strategies. Pricing optimization, product portfolio management, and evaluating marketing campaign effectiveness support revenue growth while balancing operational efficiency. Focusing on brand awareness, combined with a commitment to consistent service quality, fosters loyalty and strengthens long-term customer relationships, creating a comprehensive approach that integrates both technical excellence in gearbox repair and robust commercial performance.

What are the Key Data Covered in this Transmission Sales Market Research and Growth Report?

  • What is the expected growth of the Transmission Sales Market between 2024 and 2028?

    • USD 7.5 billion, at a CAGR of 7.68%

  • What segmentation does the market report cover?

    • The report is segmented by Type (Reciprocating, Rotatory, Centrifugal, and Axial Flow), End-user (Oil and Gas, Power generation, Water and wastewater management, and Other), and Geography (Europe, North America, APAC, South America, and Middle East and Africa)

  • Which regions are analyzed in the report?

    • Europe, North America, APAC, South America, and Middle East and Africa

  • What are the key growth drivers and market challenges?

    • Developments in cross-border and cross-country pipeline infrastructure, Increased application in harsh environmental conditions

  • Who are the major players in the Transmission Sales Market?

    • AAMCO Transmissions Inc., Allison Transmission Holdings Inc., Bauer Comp Holding GmbH, Bayerische Motoren Werke AG, BorgWarner Inc., Bridgestone Corp., Caterpillar Inc., Continental AG, Cottman Transmission and Total Auto Care, Cummins Inc., General Electric Co., Ingersoll Rand Inc., Lee Myles Autocare and Transmission, Mister Transmission International, Mitsubishi Heavy Industries Ltd., NV Bekaert SA, Prysmian Spa, RPG Enterprises, Schaeffler AG, and Siemens AG

We can help! Our analysts can customize this transmission sales market research report to meet your requirements.

Get in touch

1 Executive Summary

  • 1.1 Market overview
    • Executive Summary - Chart on Market Overview
    • Executive Summary - Data Table on Market Overview
    • Executive Summary - Chart on Global Market Characteristics
    • Executive Summary - Chart on Market by Geography
    • Executive Summary - Chart on Market Segmentation by Type
    • Executive Summary - Chart on Market Segmentation by End-user
    • Executive Summary - Chart on Incremental Growth
    • Executive Summary - Data Table on Incremental Growth
    • Executive Summary - Chart on Company Market Positioning

2 Market Landscape

  • 2.1 Market ecosystem
    • Parent Market
    • Data Table on - Parent Market
  • 2.2 Market characteristics
    • Market characteristics analysis
  • 2.3 Value chain analysis
    • Value Chain Analysis

3 Market Sizing

  • 3.1 Market definition
    • Offerings of companies included in the market definition
  • 3.2 Market segment analysis
    • Market segments
  • 3.3 Market size 2023
    • 3.4 Market outlook: Forecast for 2023-2028
      • Chart on Global - Market size and forecast 2023-2028 ($ million)
      • Data Table on Global - Market size and forecast 2023-2028 ($ million)
      • Chart on Global Market: Year-over-year growth 2023-2028 (%)
      • Data Table on Global Market: Year-over-year growth 2023-2028 (%)

    4 Historic Market Size

    • 4.1 Global Transmission Sales Market 2018 - 2022
      • Historic Market Size - Data Table on Global Transmission Sales Market 2018 - 2022 ($ million)
    • 4.2 Type segment analysis 2018 - 2022
      • Historic Market Size - Type Segment 2018 - 2022 ($ million)
    • 4.3 End-user segment analysis 2018 - 2022
      • Historic Market Size - End-user Segment 2018 - 2022 ($ million)
    • 4.4 Geography segment analysis 2018 - 2022
      • Historic Market Size - Geography Segment 2018 - 2022 ($ million)
    • 4.5 Country segment analysis 2018 - 2022
      • Historic Market Size - Country Segment 2018 - 2022 ($ million)

    5 Five Forces Analysis

    • 5.1 Five forces summary
      • Five forces analysis - Comparison between 2023 and 2028
    • 5.2 Bargaining power of buyers
      • Bargaining power of buyers - Impact of key factors 2023 and 2028
    • 5.3 Bargaining power of suppliers
      • Bargaining power of suppliers - Impact of key factors in 2023 and 2028
    • 5.4 Threat of new entrants
      • Threat of new entrants - Impact of key factors in 2023 and 2028
    • 5.5 Threat of substitutes
      • Threat of substitutes - Impact of key factors in 2023 and 2028
    • 5.6 Threat of rivalry
      • Threat of rivalry - Impact of key factors in 2023 and 2028
    • 5.7 Market condition
      • Chart on Market condition - Five forces 2023 and 2028

    6 Market Segmentation by Type

    • 6.1 Market segments
      • Chart on Type - Market share 2023-2028 (%)
      • Data Table on Type - Market share 2023-2028 (%)
    • 6.2 Comparison by Type
      • Chart on Comparison by Type
      • Data Table on Comparison by Type
    • 6.3 Reciprocating - Market size and forecast 2023-2028
      • Chart on Reciprocating - Market size and forecast 2023-2028 ($ million)
      • Data Table on Reciprocating - Market size and forecast 2023-2028 ($ million)
      • Chart on Reciprocating - Year-over-year growth 2023-2028 (%)
      • Data Table on Reciprocating - Year-over-year growth 2023-2028 (%)
    • 6.4 Rotatory - Market size and forecast 2023-2028
      • Chart on Rotatory - Market size and forecast 2023-2028 ($ million)
      • Data Table on Rotatory - Market size and forecast 2023-2028 ($ million)
      • Chart on Rotatory - Year-over-year growth 2023-2028 (%)
      • Data Table on Rotatory - Year-over-year growth 2023-2028 (%)
    • 6.5 Centrifugal - Market size and forecast 2023-2028
      • Chart on Centrifugal - Market size and forecast 2023-2028 ($ million)
      • Data Table on Centrifugal - Market size and forecast 2023-2028 ($ million)
      • Chart on Centrifugal - Year-over-year growth 2023-2028 (%)
      • Data Table on Centrifugal - Year-over-year growth 2023-2028 (%)
    • 6.6 Axial Flow - Market size and forecast 2023-2028
      • Chart on Axial Flow - Market size and forecast 2023-2028 ($ million)
      • Data Table on Axial Flow - Market size and forecast 2023-2028 ($ million)
      • Chart on Axial Flow - Year-over-year growth 2023-2028 (%)
      • Data Table on Axial Flow - Year-over-year growth 2023-2028 (%)
    • 6.7 Market opportunity by Type
      • Market opportunity by Type ($ million)
      • Data Table on Market opportunity by Type ($ million)

    7 Market Segmentation by End-user

    • 7.1 Market segments
      • Chart on End-user - Market share 2023-2028 (%)
      • Data Table on End-user - Market share 2023-2028 (%)
    • 7.2 Comparison by End-user
      • Chart on Comparison by End-user
      • Data Table on Comparison by End-user
    • 7.3 Oil and gas - Market size and forecast 2023-2028
      • Chart on Oil and gas - Market size and forecast 2023-2028 ($ million)
      • Data Table on Oil and gas - Market size and forecast 2023-2028 ($ million)
      • Chart on Oil and gas - Year-over-year growth 2023-2028 (%)
      • Data Table on Oil and gas - Year-over-year growth 2023-2028 (%)
    • 7.4 Power generation - Market size and forecast 2023-2028
      • Chart on Power generation - Market size and forecast 2023-2028 ($ million)
      • Data Table on Power generation - Market size and forecast 2023-2028 ($ million)
      • Chart on Power generation - Year-over-year growth 2023-2028 (%)
      • Data Table on Power generation - Year-over-year growth 2023-2028 (%)
    • 7.5 Water and wastewater management - Market size and forecast 2023-2028
      • Chart on Water and wastewater management - Market size and forecast 2023-2028 ($ million)
      • Data Table on Water and wastewater management - Market size and forecast 2023-2028 ($ million)
      • Chart on Water and wastewater management - Year-over-year growth 2023-2028 (%)
      • Data Table on Water and wastewater management - Year-over-year growth 2023-2028 (%)
    • 7.6 Others - Market size and forecast 2023-2028
      • Chart on Others - Market size and forecast 2023-2028 ($ million)
      • Data Table on Others - Market size and forecast 2023-2028 ($ million)
      • Chart on Others - Year-over-year growth 2023-2028 (%)
      • Data Table on Others - Year-over-year growth 2023-2028 (%)
    • 7.7 Market opportunity by End-user
      • Market opportunity by End-user ($ million)
      • Data Table on Market opportunity by End-user ($ million)

    8 Customer Landscape

    • 8.1 Customer landscape overview
      • Analysis of price sensitivity, lifecycle, customer purchase basket, adoption rates, and purchase criteria

    9 Geographic Landscape

    • 9.1 Geographic segmentation
      • Chart on Market share by geography 2023-2028 (%)
      • Data Table on Market share by geography 2023-2028 (%)
    • 9.2 Geographic comparison
      • Chart on Geographic comparison
      • Data Table on Geographic comparison
    • 9.3 Europe - Market size and forecast 2023-2028
      • Chart on Europe - Market size and forecast 2023-2028 ($ million)
      • Data Table on Europe - Market size and forecast 2023-2028 ($ million)
      • Chart on Europe - Year-over-year growth 2023-2028 (%)
      • Data Table on Europe - Year-over-year growth 2023-2028 (%)
    • 9.4 North America - Market size and forecast 2023-2028
      • Chart on North America - Market size and forecast 2023-2028 ($ million)
      • Data Table on North America - Market size and forecast 2023-2028 ($ million)
      • Chart on North America - Year-over-year growth 2023-2028 (%)
      • Data Table on North America - Year-over-year growth 2023-2028 (%)
    • 9.5 APAC - Market size and forecast 2023-2028
      • Chart on APAC - Market size and forecast 2023-2028 ($ million)
      • Data Table on APAC - Market size and forecast 2023-2028 ($ million)
      • Chart on APAC - Year-over-year growth 2023-2028 (%)
      • Data Table on APAC - Year-over-year growth 2023-2028 (%)
    • 9.6 South America - Market size and forecast 2023-2028
      • Chart on South America - Market size and forecast 2023-2028 ($ million)
      • Data Table on South America - Market size and forecast 2023-2028 ($ million)
      • Chart on South America - Year-over-year growth 2023-2028 (%)
      • Data Table on South America - Year-over-year growth 2023-2028 (%)
    • 9.7 Middle East and Africa - Market size and forecast 2023-2028
      • Chart on Middle East and Africa - Market size and forecast 2023-2028 ($ million)
      • Data Table on Middle East and Africa - Market size and forecast 2023-2028 ($ million)
      • Chart on Middle East and Africa - Year-over-year growth 2023-2028 (%)
      • Data Table on Middle East and Africa - Year-over-year growth 2023-2028 (%)
    • 9.8 US - Market size and forecast 2023-2028
      • Chart on US - Market size and forecast 2023-2028 ($ million)
      • Data Table on US - Market size and forecast 2023-2028 ($ million)
      • Chart on US - Year-over-year growth 2023-2028 (%)
      • Data Table on US - Year-over-year growth 2023-2028 (%)
    • 9.9 China - Market size and forecast 2023-2028
      • Chart on China - Market size and forecast 2023-2028 ($ million)
      • Data Table on China - Market size and forecast 2023-2028 ($ million)
      • Chart on China - Year-over-year growth 2023-2028 (%)
      • Data Table on China - Year-over-year growth 2023-2028 (%)
    • 9.10 Germany - Market size and forecast 2023-2028
      • Chart on Germany - Market size and forecast 2023-2028 ($ million)
      • Data Table on Germany - Market size and forecast 2023-2028 ($ million)
      • Chart on Germany - Year-over-year growth 2023-2028 (%)
      • Data Table on Germany - Year-over-year growth 2023-2028 (%)
    • 9.11 France - Market size and forecast 2023-2028
      • Chart on France - Market size and forecast 2023-2028 ($ million)
      • Data Table on France - Market size and forecast 2023-2028 ($ million)
      • Chart on France - Year-over-year growth 2023-2028 (%)
      • Data Table on France - Year-over-year growth 2023-2028 (%)
    • 9.12 Japan - Market size and forecast 2023-2028
      • Chart on Japan - Market size and forecast 2023-2028 ($ million)
      • Data Table on Japan - Market size and forecast 2023-2028 ($ million)
      • Chart on Japan - Year-over-year growth 2023-2028 (%)
      • Data Table on Japan - Year-over-year growth 2023-2028 (%)
    • 9.13 Market opportunity by geography
      • Market opportunity by geography ($ million)
      • Data Tables on Market opportunity by geography ($ million)

    10 Drivers, Challenges, and Opportunity/Restraints

    • 10.1 Market drivers
      • 10.2 Market challenges
        • 10.3 Impact of drivers and challenges
          • Impact of drivers and challenges in 2023 and 2028
        • 10.4 Market opportunities/restraints

          11 Competitive Landscape

          • 11.1 Overview
            • 11.2 Competitive Landscape
              • Overview on criticality of inputs and factors of differentiation
            • 11.3 Landscape disruption
              • Overview on factors of disruption
            • 11.4 Industry risks
              • Impact of key risks on business

            12 Competitive Analysis

            • 12.1 Companies profiled
              • Companies covered
            • 12.2 Market positioning of companies
              • Matrix on companies position and classification
            • 12.3 AAMCO Transmissions Inc.
              • AAMCO Transmissions Inc. - Overview
              • AAMCO Transmissions Inc. - Product / Service
              • AAMCO Transmissions Inc. - Key offerings
            • 12.4 Allison Transmission Holdings Inc.
              • Allison Transmission Holdings Inc. - Overview
              • Allison Transmission Holdings Inc. - Product / Service
              • Allison Transmission Holdings Inc. - Key news
              • Allison Transmission Holdings Inc. - Key offerings
            • 12.5 BorgWarner Inc.
              • BorgWarner Inc. - Overview
              • BorgWarner Inc. - Business segments
              • BorgWarner Inc. - Key news
              • BorgWarner Inc. - Key offerings
              • BorgWarner Inc. - Segment focus
            • 12.6 Bridgestone Corp.
              • Bridgestone Corp. - Overview
              • Bridgestone Corp. - Business segments
              • Bridgestone Corp. - Key news
              • Bridgestone Corp. - Key offerings
              • Bridgestone Corp. - Segment focus
            • 12.7 Caterpillar Inc.
              • Caterpillar Inc. - Overview
              • Caterpillar Inc. - Business segments
              • Caterpillar Inc. - Key news
              • Caterpillar Inc. - Key offerings
              • Caterpillar Inc. - Segment focus
            • 12.8 Continental AG
              • Continental AG - Overview
              • Continental AG - Business segments
              • Continental AG - Key news
              • Continental AG - Key offerings
              • Continental AG - Segment focus
            • 12.9 Cottman Transmission and Total Auto Care
              • Cottman Transmission and Total Auto Care - Overview
              • Cottman Transmission and Total Auto Care - Product / Service
              • Cottman Transmission and Total Auto Care - Key offerings
            • 12.10 Cummins Inc.
              • Cummins Inc. - Overview
              • Cummins Inc. - Business segments
              • Cummins Inc. - Key news
              • Cummins Inc. - Key offerings
              • Cummins Inc. - Segment focus
            • 12.11 General Electric Co.
              • General Electric Co. - Overview
              • General Electric Co. - Business segments
              • General Electric Co. - Key news
              • General Electric Co. - Key offerings
              • General Electric Co. - Segment focus
            • 12.12 Ingersoll Rand Inc.
              • Ingersoll Rand Inc. - Overview
              • Ingersoll Rand Inc. - Business segments
              • Ingersoll Rand Inc. - Key news
              • Ingersoll Rand Inc. - Key offerings
              • Ingersoll Rand Inc. - Segment focus
            • 12.13 Lee Myles Autocare and Transmission
              • Lee Myles Autocare and Transmission - Overview
              • Lee Myles Autocare and Transmission - Product / Service
              • Lee Myles Autocare and Transmission - Key offerings
            • 12.14 Mister Transmission International
              • Mister Transmission International - Overview
              • Mister Transmission International - Product / Service
              • Mister Transmission International - Key offerings
            • 12.15 Schaeffler AG
              • Schaeffler AG - Overview
              • Schaeffler AG - Business segments
              • Schaeffler AG - Key news
              • Schaeffler AG - Key offerings
              • Schaeffler AG - Segment focus
            • 12.16 Siemens AG
              • Siemens AG - Overview
              • Siemens AG - Business segments
              • Siemens AG - Key news
              • Siemens AG - Key offerings
              • Siemens AG - Segment focus

            13 Appendix

            • 13.1 Scope of the report
              • 13.2 Inclusions and exclusions checklist
                • Inclusions checklist
                • Exclusions checklist
              • 13.3 Currency conversion rates for US$
                • Currency conversion rates for US$
              • 13.4 Research methodology
                • Research methodology
              • 13.5 Data procurement
                • Information sources
              • 13.6 Data validation
                • Data validation
              • 13.7 Validation techniques employed for market sizing
                • Validation techniques employed for market sizing
              • 13.8 Data synthesis
                • Data synthesis
              • 13.9 360 degree market analysis
                • 360 degree market analysis
              • 13.10 List of abbreviations
                • List of abbreviations

              Research Methodology

              Technavio presents a detailed picture of the market by way of study, synthesis, and summation of data from multiple sources. The analysts have presented the various facets of the market with a particular focus on identifying the key industry influencers. The data thus presented is comprehensive, reliable, and the result of extensive research, both primary and secondary.

              INFORMATION SOURCES

              Primary sources

              • Manufacturers and suppliers
              • Channel partners
              • Industry experts
              • Strategic decision makers

              Secondary sources

              • Industry journals and periodicals
              • Government data
              • Financial reports of key industry players
              • Historical data
              • Press releases

              DATA ANALYSIS

              Data Synthesis

              • Collation of data
              • Estimation of key figures
              • Analysis of derived insights

              Data Validation

              • Triangulation with data models
              • Reference against proprietary databases
              • Corroboration with industry experts

              REPORT WRITING

              Qualitative

              • Market drivers
              • Market challenges
              • Market trends
              • Five forces analysis

              Quantitative

              • Market size and forecast
              • Market segmentation
              • Geographical insights
              • Competitive landscape

              Interested in this report?

              Get your sample now to see our research methodology and insights!

              Download Now

              Frequently Asked Questions

              Transmission Sales market growth will increase by $ 7503.6 mn during 2024-2028 .

              The Transmission Sales market is expected to grow at a CAGR of 7.68% during 2024-2028 .

              Transmission Sales market is segmented by Type( Reciprocating, Rotatory, Centrifugal, Axial Flow) End-user( Oil and Gas, Power generation, Water and wastewater management, Other)

              AAMCO Transmissions Inc., Allison Transmission Holdings Inc., Bauer Comp Holding GmbH, Bayerische Motoren Werke AG, BorgWarner Inc., Bridgestone Corp., Caterpillar Inc., Continental AG, Cottman Transmission and Total Auto Care, Cummins Inc., General Electric Co., Ingersoll Rand Inc., Lee Myles Autocare and Transmission, Mister Transmission International, Mitsubishi Heavy Industries Ltd., NV Bekaert SA, Prysmian Spa, RPG Enterprises, Schaeffler AG, Siemens AG are a few of the key vendors in the Transmission Sales market.

              North America will register the highest growth rate of 30% among the other regions. Therefore, the Transmission Sales market in North America is expected to garner significant business opportunities for the vendors during the forecast period.

              US, China, Germany, France, Japan

              • Developments in cross-border and cross-country pipeline infrastructureThe oil and gas supply and demand centers are distinct from one another. In the oil and gas sector is the driving factor this market.
              • pipelines are one of the most effective forms of transportation. When rail and road transportation are impracticable or not possible is the driving factor this market.
              • crude oil is the driving factor this market.
              • natural gas is the driving factor this market.
              • and petroleum products must occasionally be transported over great distances to and from refineries as well as to customers. The oil and gas pipeline network is constantly expanding is the driving factor this market.
              • owing to the increased demand for oil and gas and to connect new exploration sites to refineries and demand centers. Several pipeline projects are under construction in various parts of the world is the driving factor this market.
              • and these include cross-country and cross-border pipelines. Therefore is the driving factor this market.
              • increased trade activities in the oil and gas segment will lead to the construction of new pipeline projects and drive the growth of the global transmission sales market during the forecast period. Numerous other pipeline projects are also in various stages of planning and construction in various parts of the world. These include TransCanada's Keystone XL pipeline is the driving factor this market.
              • Atlantic Coast Pipeline in the US is the driving factor this market.
              • TANAP from Azerbaijan to Europe via Turkey is the driving factor this market.
              • NGP in Australia is the driving factor this market.
              • and others. With large-scale oil and gas pipeline projects coming up globally is the driving factor this market.
              • extensive use of pipeline monitoring equipment and pipeline managing software systems will be required. Such factors will greatly boost the growth of the global transmission sales market during the forecast period. is the driving factor this market.

              The Transmission Sales market vendors should focus on grabbing business opportunities from the Reciprocating segment as it accounted for the largest market share in the base year.