Utility Locator Market Analysis, Size, and Forecast 2026-2030: North America (US, Canada, and Mexico), Europe (Germany, UK, and France), APAC (China, Japan, and India), South America (Brazil and Argentina), Middle East and Africa (Saudi Arabia, UAE, and South Africa), and Rest of World (ROW)

Utility Locator Market Analysis, Size, and Forecast 2026-2030:
North America (US, Canada, and Mexico), Europe (Germany, UK, and France), APAC (China, Japan, and India), South America (Brazil and Argentina), Middle East and Africa (Saudi Arabia, UAE, and South Africa), and Rest of World (ROW)

Published: Dec 2025 297 Pages SKU: IRTNTR70557

Market Overview at a Glance

$2.34 B
Market Opportunity
6%
CAGR 2025 - 2030
34.1%
APAC Growth
$3.98 B
Electromagnetic field segment 2024

Utility Locator Market Size 2026-2030

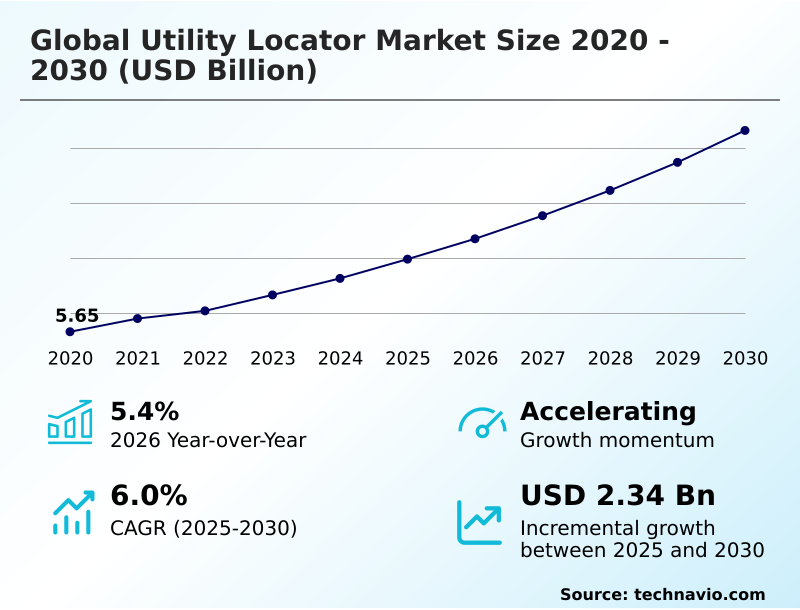
The utility locator market size is valued to increase by USD 2.34 billion, at a CAGR of 6% from 2025 to 2030. Surge in global infrastructure spending and modernization mandates will drive the utility locator market.

Major Market Trends & Insights

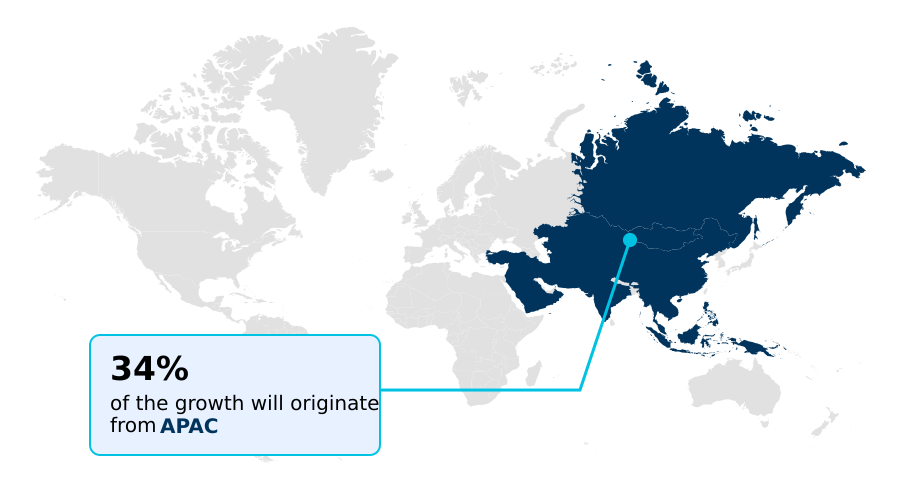
  • APAC dominated the market and accounted for a 34.1% growth during the forecast period.
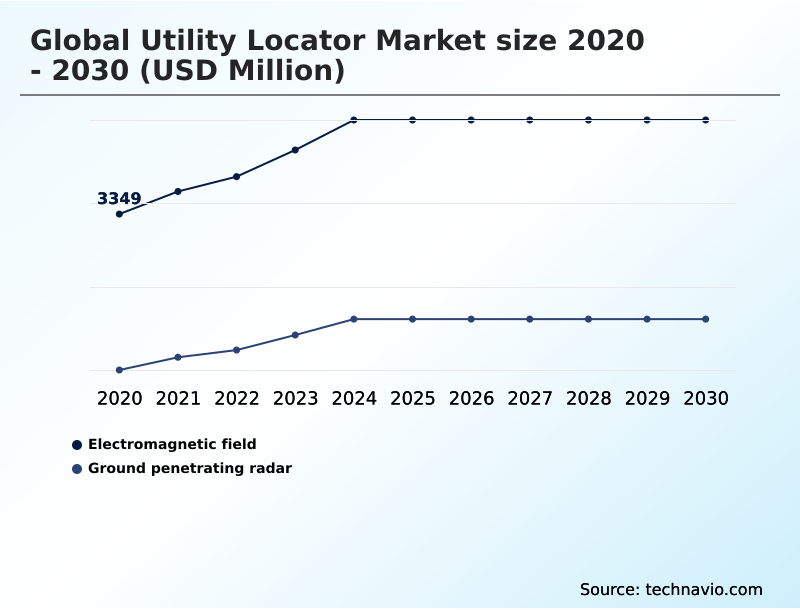
  • By Technique - Electromagnetic field segment was valued at USD 3.98 billion in 2024
  • By End-user - Oil and gas segment accounted for the largest market revenue share in 2024

Market Size & Forecast

  • Market Opportunities: USD 3.66 billion
  • Market Future Opportunities: USD 2.34 billion
  • CAGR from 2025 to 2030 : 6%

Market Summary

  • The utility locator market is undergoing a significant transformation, driven by massive infrastructure modernization and stringent damage prevention mandates. Core activities are shifting from simple detection to sophisticated digital subsurface mapping. The integration of high-precision GNSS receivers and cloud connectivity in intelligent utility devices enables the creation of detailed subsurface digital twins.
  • This technology is critical in scenarios like urban renewal, where contractors must navigate a complex web of undocumented pipes and cables. Using a locator with advanced signal processing algorithms for real-time data collection can reduce utility strikes by more than 25%, preventing costly project delays and service disruptions.
  • This move toward comprehensive subsurface characterization and GIS and BIM integration is redefining the value of locating technology. While the proliferation of non-conductive utilities and a shortage of skilled operators present ongoing hurdles, the push for digital construction workflows and proactive asset management ensures sustained demand for more advanced, data-centric locating solutions.

What will be the Size of the Utility Locator Market during the forecast period?

Get Key Insights on Market Forecast (PDF) Request Free Sample

How is the Utility Locator Market Segmented?

The utility locator industry research report provides comprehensive data (region-wise segment analysis), with forecasts and estimates in "USD million" for the period 2026-2030, as well as historical data from 2020-2024 for the following segments.

  • Technique
    • Electromagnetic field
    • Ground penetrating radar
  • End-user
    • Oil and gas
    • Electricity
    • Transportation
    • Others
  • Type
    • Metallic utilities
    • Non-metallic utilities
  • Geography
    • North America
      • US
      • Canada
      • Mexico
    • Europe
      • Germany
      • UK
      • France
    • APAC
      • China
      • Japan
      • India
    • South America
      • Brazil
      • Argentina
    • Middle East and Africa
      • Saudi Arabia
      • UAE
      • South Africa
    • Rest of World (ROW)

By Technique Insights

The electromagnetic field segment is estimated to witness significant growth during the forecast period.

The electromagnetic field technique remains the foundational method for the utility locator market, highly effective for conductive infrastructure. This segment's stability is driven by its cost-efficiency and performance in detecting metallic utilities.

Technology has evolved beyond basic detection, incorporating multi-frequency transmitters and advanced signal processing algorithms to improve performance in congested areas. A key advancement is the integration of georeferencing capabilities to create as-built digital maps.

This supports proactive asset management by enabling the creation of an auditable record of locate activities. Advanced diagnostic capabilities now allow for the assessment of pipeline coating health, with some systems improving fault detection accuracy by over 20%.

This evolution transforms the locator into a critical tool for digital construction workflows, supporting pipeline integrity management.

Request Free Sample

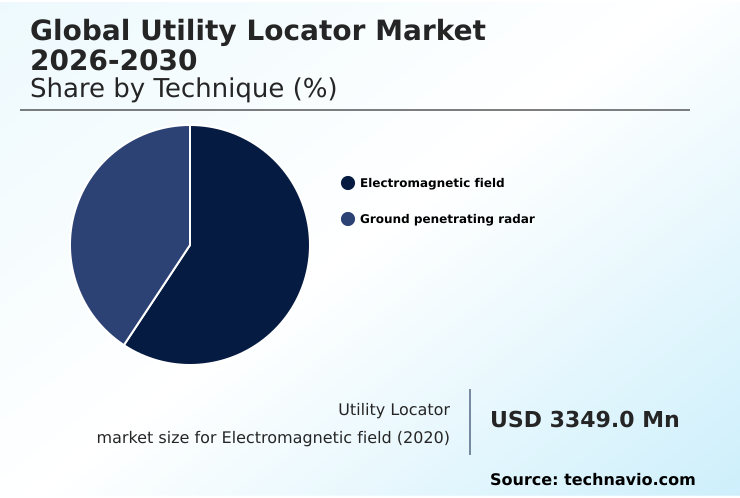
The Electromagnetic field segment was valued at USD 3.98 billion in 2024 and showed a gradual increase during the forecast period.

Request Free Sample

Regional Analysis

APAC is estimated to contribute 34.1% to the growth of the global market during the forecast period.Technavio’s analysts have elaborately explained the regional trends and drivers that shape the market during the forecast period.

See How Utility Locator Market Demand is Rising in APAC Request Free Sample

The geographic landscape of the utility locator market is characterized by a dichotomy between mature and emerging regions. North America and Europe lead in the adoption of advanced systems, driven by stringent regulations and a focus on subsurface utility engineering.

In these markets, the use of locators with geospatial coordinates and direct connection capabilities has reduced utility strikes by an estimated 20%.

Conversely, the APAC region is the fastest-growing market, propelled by massive infrastructure projects where damage prevention technology is becoming critical.

While mature markets focus on asset integrity management and digital subsurface mapping, APAC's growth is fueled by new construction, where adoption of even basic electromagnetic induction tools can improve project efficiency by over 15%.

This regional divergence creates opportunities for a wide range of products, from high-end multi-sensor platforms to rugged, cost-effective devices.

Market Dynamics

Our researchers analyzed the data with 2025 as the base year, along with the key drivers, trends, and challenges. A holistic analysis of drivers will help companies refine their marketing strategies to gain a competitive advantage.

  • The global utility locator market 2026-2030 is shaped by several interconnected factors. A clear understanding of the global utility locator market 2026-2030 key drivers, such as massive infrastructure spending and stricter safety regulations, is essential for strategic planning. The impact of regulations on utility locator market is profound, mandating pre-excavation surveys and compelling investment in more accurate technology.
  • This directly influences the future of utility locator technology, which is trending toward integrated systems that combine electromagnetic detection with advanced GPR. An analysis of the global utility locator market 2026-2030 segmentation reveals distinct needs; for instance, the energy sector's requirements differ significantly from those of telecommunications.
  • Key challenges in subsurface utility mapping, including signal interference and the presence of unrecorded lines, persist. The role of GPR in utility locating is expanding to address the proliferation of non-metallic pipes, a segment that grows nearly twice as fast as the metallic utility segment.
  • Effectively navigating these dynamics requires a focus on innovation and adapting to a data-centric operational model.

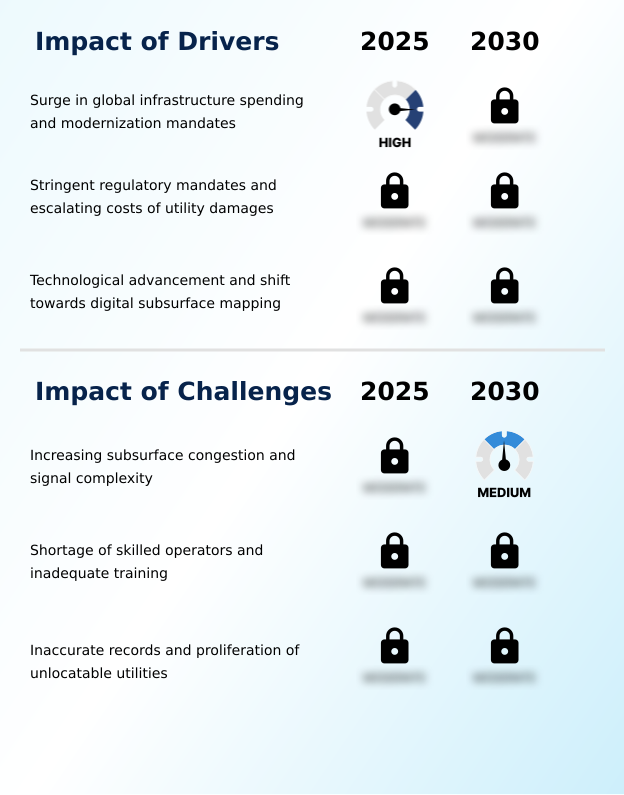
What are the key market drivers leading to the rise in the adoption of Utility Locator Industry?

  • The market is propelled by a significant surge in global infrastructure spending and the implementation of modernization mandates worldwide.

  • Global infrastructure modernization is a primary catalyst for the utility locator market, creating sustained demand for damage prevention technology. Government initiatives mandating the expansion of fiber optic and energy networks necessitate precise digital subsurface mapping.
  • The adoption of subsurface utility engineering practices has proven to reduce project delays by up to 25%. Technological advancements, particularly the integration of high-precision GNSS receivers and automated signal processing, are transforming locators into essential tools for real-time data collection.
  • This enables more effective pipeline integrity management and assessment, enhancing safety and operational efficiency. The market is also driven by the need for accurate non-conductive utility detection in increasingly congested subterranean environments.

What are the market trends shaping the Utility Locator Industry?

  • A defining market trend is the integration of locators into comprehensive digital workflows, driving the development of subsurface digital twins.

  • The utility locator market is increasingly defined by the adoption of intelligent utility devices and a move toward comprehensive subsurface characterization. A key trend is the integration of locators into digital construction workflows, where remote data synchronization enables field data to be instantly available for office-based analysis.
  • This focus on GIS and BIM integration is driving demand for advanced diagnostic capabilities that support proactive asset management. The use of multi-sensor platforms combining electromagnetic locators with high-density array systems improves the detection of non-conductive utilities by over 40%. These systems produce an auditable record of locate activities, which is critical for compliance and reduces liability.
  • This shift enhances underground utility verification and supports more efficient project planning.

What challenges does the Utility Locator Industry face during its growth?

  • The industry faces a key challenge from increasing subsurface congestion and the resulting signal complexity, which can impede locator performance.

  • A significant market challenge stems from increasingly congested subsurface environments, which leads to signal interference and complicates the use of tracer wire. This complexity is compounded by a shortage of skilled technicians capable of interpreting ambiguous signals from multi-frequency transmitters, leading to locating errors in an estimated 15% of complex urban surveys.
  • While directional guidance and other software enhancements help, they cannot fully replace operator expertise. The prevalence of inaccurate records and unlocatable non-conductive utilities forces reliance on ground penetrating radar, which requires significant training and is not effective in all soil types.
  • This gap between technological capability and field application highlights a critical need for improved training and more intuitive user interfaces with features such as passive locating.

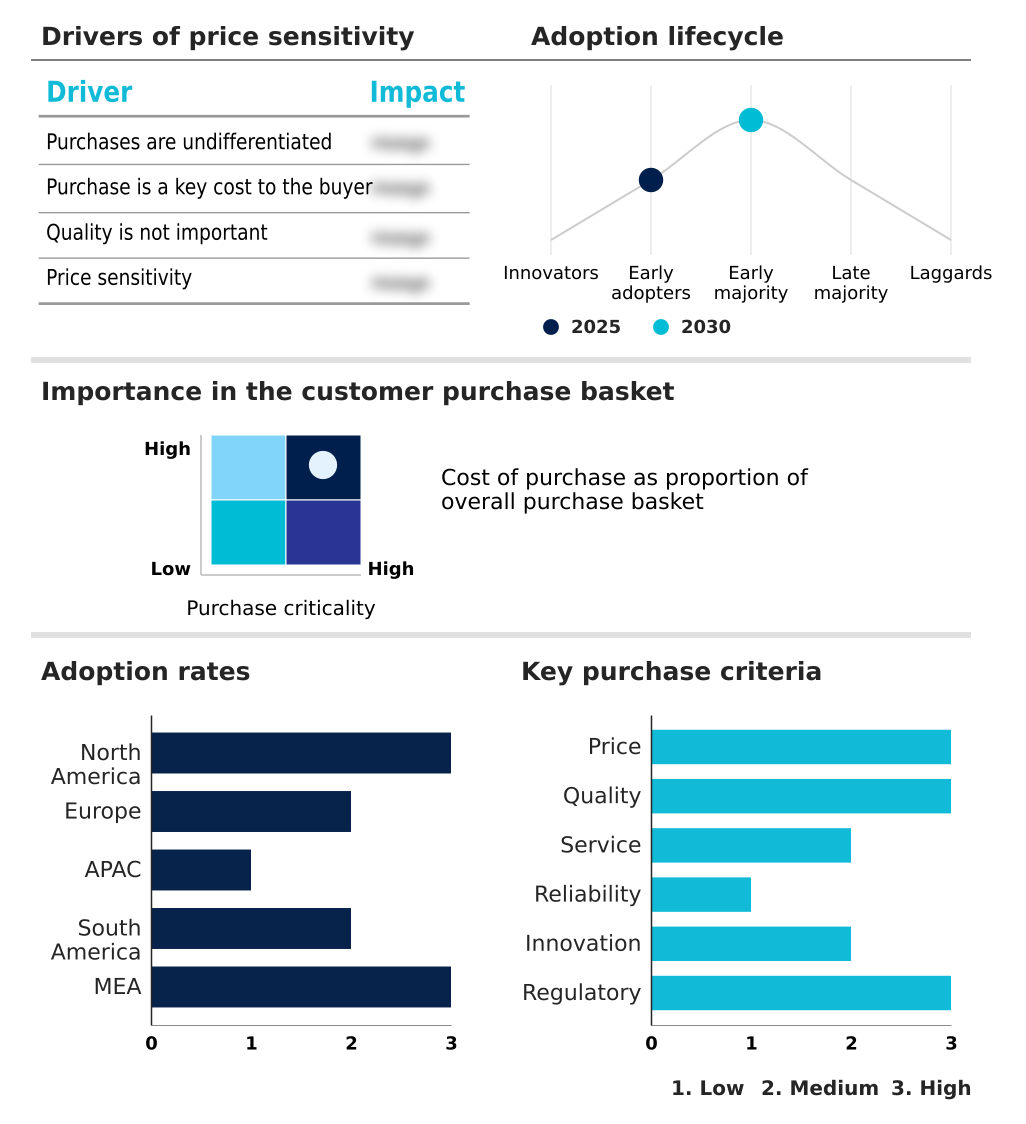
Exclusive Technavio Analysis on Customer Landscape

The utility locator market forecasting report includes the adoption lifecycle of the market, covering from the innovator’s stage to the laggard’s stage. It focuses on adoption rates in different regions based on penetration. Furthermore, the utility locator market report also includes key purchase criteria and drivers of price sensitivity to help companies evaluate and develop their market growth analysis strategies.

Customer Landscape of Utility Locator Industry

Competitive Landscape

Companies are implementing various strategies, such as strategic alliances, utility locator market forecast, partnerships, mergers and acquisitions, geographical expansion, and product/service launches, to enhance their presence in the industry.

3M Co. - Offerings are centered on advanced damage prevention technology, providing industrial-grade systems for precise pipe and cable locating.

The industry research and growth report includes detailed analyses of the competitive landscape of the market and information about key companies, including:

  • 3M Co.
  • Berntsen International Inc.
  • Emerson Electric Co.
  • Eos Positioning Systems Inc.
  • Geophysical Survey Systems Inc.
  • Guideline Geo AB
  • Hexagon AB
  • Leica Geosystems AG
  • MidAmerican Technology Inc.
  • Radiodetection Ltd.
  • RYCOM Instruments Inc.
  • SPX Technologies Inc.
  • STC TECHNO AC LLC
  • SubSurface Instruments Inc.
  • The Toro Co.
  • Vermeer Corp.
  • Vivax Metrotech Corp.

Qualitative and quantitative analysis of companies has been conducted to help clients understand the wider business environment as well as the strengths and weaknesses of key industry players. Data is qualitatively analyzed to categorize companies as pure play, category-focused, industry-focused, and diversified; it is quantitatively analyzed to categorize companies as dominant, leading, strong, tentative, and weak.

Recent Development and News in Utility locator market

  • In August, 2024, a major technology firm and a leading locator manufacturer announced a strategic partnership to integrate augmented reality overlays into locator displays, providing technicians with real-time visual guidance in the field.
  • In November, 2024, a European standards body announced the adoption of stricter subsurface survey mandates, similar to PAS 128, for two additional member states, increasing the requirement for high-accuracy locating and data reporting.
  • In February, 2025, a prominent vendor launched a new locator series featuring onboard AI for real-time signal interpretation and interference filtering, designed to reduce operator-dependent errors during complex locates.
  • In May, 2025, a consortium of infrastructure and technology companies in the APAC region secured funding for a large-scale project to develop a unified subsurface digital twin for a major capital city, mandating the use of locators with cloud connectivity.

Dive into Technavio’s robust research methodology, blending expert interviews, extensive data synthesis, and validated models for unparalleled Utility Locator Market insights. See full methodology.

Market Scope
Page number 297
Base year 2025
Historic period 2020-2024
Forecast period 2026-2030
Growth momentum & CAGR Accelerate at a CAGR of 6%
Market growth 2026-2030 USD 2341.7 million
Market structure Fragmented
YoY growth 2025-2026(%) 5.4%
Key countries US, Canada, Mexico, Germany, UK, France, Italy, Spain, The Netherlands, China, Japan, India, South Korea, Australia, Indonesia, Brazil, Argentina, Chile, Saudi Arabia, UAE, South Africa, Israel and Turkey
Competitive landscape Leading Companies, Market Positioning of Companies, Competitive Strategies, and Industry Risks

Request Free Sample

Research Analyst Overview

  • The utility locator market is advancing beyond simple detection, becoming integral to digital asset management and risk mitigation strategies. The industry's evolution is marked by the integration of technologies such as GNSS receivers and cloud connectivity, enabling the creation of precise as-built digital maps.
  • These subsurface digital twins are no longer a niche concept but a core component of modern infrastructure projects, supporting boardroom decisions on capital expenditure and compliance. The use of locators featuring advanced signal processing algorithms and fault-finding features has demonstrated the ability to reduce diagnostic time by over 30% in congested urban environments.
  • This shift from reactive damage prevention to proactive asset integrity management, using tools for assessing cathodic protection systems and pipeline coating health, is critical. The technology, including electromagnetic induction and ground penetrating radar, now provides a higher level of data integrity, with features like passive locating and direct connection ensuring both safety and accuracy.
  • This evolution underscores the instrument's role in creating verifiable geospatial coordinates and radargram data for long-term planning.

What are the Key Data Covered in this Utility Locator Market Research and Growth Report?

  • What is the expected growth of the Utility Locator Market between 2026 and 2030?

    • USD 2.34 billion, at a CAGR of 6%

  • What segmentation does the market report cover?

    • The report is segmented by Technique (Electromagnetic field, and Ground penetrating radar), End-user (Oil and gas, Electricity, Transportation, and Others), Type (Metallic utilities, and Non-metallic utilities) and Geography (North America, Europe, APAC, South America, Middle East and Africa)

  • Which regions are analyzed in the report?

    • North America, Europe, APAC, South America and Middle East and Africa

  • What are the key growth drivers and market challenges?

    • Surge in global infrastructure spending and modernization mandates, Increasing subsurface congestion and signal complexity

  • Who are the major players in the Utility Locator Market?

    • 3M Co., Berntsen International Inc., Emerson Electric Co., Eos Positioning Systems Inc., Geophysical Survey Systems Inc., Guideline Geo AB, Hexagon AB, Leica Geosystems AG, MidAmerican Technology Inc., Radiodetection Ltd., RYCOM Instruments Inc., SPX Technologies Inc., STC TECHNO AC LLC, SubSurface Instruments Inc., The Toro Co., Vermeer Corp. and Vivax Metrotech Corp.

Market Research Insights

  • Market dynamics are shaped by a definitive shift toward digital construction workflows and intelligent utility devices. The adoption of subsurface utility engineering practices, which improve project planning accuracy by over 40%, underscores the demand for advanced locating solutions. Integrating real-time data collection with GIS and BIM integration reduces rework costs associated with utility strikes by up to 30%.
  • The emphasis on damage prevention technology is driven by regulations and the high cost of repairs. Furthermore, non-conductive utility detection using multi-sensor platforms is becoming essential. This evolution supports proactive asset management and enhances subsurface characterization, justifying investment in higher-performance equipment that provides a clear and auditable record of locate activities.

We can help! Our analysts can customize this utility locator market research report to meet your requirements.

Get in touch

1. Executive Summary

1.1 Market overview

Executive Summary - Chart on Market Overview
Executive Summary - Data Table on Market Overview
Executive Summary - Chart on Global Market Characteristics
Executive Summary - Chart on Market by Geography
Executive Summary - Chart on Market Segmentation by Technique
Executive Summary - Chart on Market Segmentation by End-user
Executive Summary - Chart on Market Segmentation by Type
Executive Summary - Chart on Incremental Growth
Executive Summary - Data Table on Incremental Growth
Executive Summary - Chart on Company Market Positioning

2. Technavio Analysis

2.1 Analysis of price sensitivity, lifecycle, customer purchase basket, adoption rates, and purchase criteria

2.2 Criticality of inputs and Factors of differentiation

Chart on Overview on criticality of inputs and factors of differentiation

2.3 Factors of disruption

Chart on Overview on factors of disruption

2.4 Impact of drivers and challenges

Chart on Impact of drivers and challenges in 2025 and 2030

3. Market Landscape

3.1 Market ecosystem

Chart on Parent Market
Data Table on - Parent Market

3.2 Market characteristics

Chart on Market characteristics analysis

3.3 Value chain analysis

Chart on Value chain analysis

4. Market Sizing

4.1 Market definition

Data Table on Offerings of companies included in the market definition

4.2 Market segment analysis

Market segments

4.3 Market size 2025

4.4 Market outlook: Forecast for 2025-2030

Chart on Global - Market size and forecast 2025-2030 ($ million)
Data Table on Global - Market size and forecast 2025-2030 ($ million)
Chart on Global Market: Year-over-year growth 2025-2030 (%)
Data Table on Global Market: Year-over-year growth 2025-2030 (%)

5. Historic Market Size

5.1 Global Utility Locator Market 2020 - 2024

Historic Market Size - Data Table on Global Utility Locator Market 2020 - 2024 ($ million)

5.2 Technique segment analysis 2020 - 2024

Historic Market Size - Technique Segment 2020 - 2024 ($ million)

5.3 End-user segment analysis 2020 - 2024

Historic Market Size - End-user Segment 2020 - 2024 ($ million)

5.4 Type segment analysis 2020 - 2024

Historic Market Size - Type Segment 2020 - 2024 ($ million)

5.5 Geography segment analysis 2020 - 2024

Historic Market Size - Geography Segment 2020 - 2024 ($ million)

5.6 Country segment analysis 2020 - 2024

Historic Market Size - Country Segment 2020 - 2024 ($ million)

6. Qualitative Analysis

6.1 Impact of AI on Global Utility Locator Market

7. Five Forces Analysis

7.1 Five forces summary

Five forces analysis - Comparison between 2025 and 2030

7.2 Bargaining power of buyers

Bargaining power of buyers - Impact of key factors 2025 and 2030

7.3 Bargaining power of suppliers

Bargaining power of suppliers - Impact of key factors in 2025 and 2030

7.4 Threat of new entrants

Threat of new entrants - Impact of key factors in 2025 and 2030

7.5 Threat of substitutes

Threat of substitutes - Impact of key factors in 2025 and 2030

7.6 Threat of rivalry

Threat of rivalry - Impact of key factors in 2025 and 2030

7.7 Market condition

Chart on Market condition - Five forces 2025 and 2030

8. Market Segmentation by Technique

8.1 Market segments

Chart on Technique - Market share 2025-2030 (%)
Data Table on Technique - Market share 2025-2030 (%)

8.2 Comparison by Technique

Chart on Comparison by Technique
Data Table on Comparison by Technique

8.3 Electromagnetic field - Market size and forecast 2025-2030

Chart on Electromagnetic field - Market size and forecast 2025-2030 ($ million)
Data Table on Electromagnetic field - Market size and forecast 2025-2030 ($ million)
Chart on Electromagnetic field - Year-over-year growth 2025-2030 (%)
Data Table on Electromagnetic field - Year-over-year growth 2025-2030 (%)

8.4 Ground penetrating radar - Market size and forecast 2025-2030

Chart on Ground penetrating radar - Market size and forecast 2025-2030 ($ million)
Data Table on Ground penetrating radar - Market size and forecast 2025-2030 ($ million)
Chart on Ground penetrating radar - Year-over-year growth 2025-2030 (%)
Data Table on Ground penetrating radar - Year-over-year growth 2025-2030 (%)

8.5 Market opportunity by Technique

Market opportunity by Technique ($ million)
Data Table on Market opportunity by Technique ($ million)

9. Market Segmentation by End-user

9.1 Market segments

Chart on End-user - Market share 2025-2030 (%)
Data Table on End-user - Market share 2025-2030 (%)

9.2 Comparison by End-user

Chart on Comparison by End-user
Data Table on Comparison by End-user

9.3 Oil and gas - Market size and forecast 2025-2030

Chart on Oil and gas - Market size and forecast 2025-2030 ($ million)
Data Table on Oil and gas - Market size and forecast 2025-2030 ($ million)
Chart on Oil and gas - Year-over-year growth 2025-2030 (%)
Data Table on Oil and gas - Year-over-year growth 2025-2030 (%)

9.4 Electricity - Market size and forecast 2025-2030

Chart on Electricity - Market size and forecast 2025-2030 ($ million)
Data Table on Electricity - Market size and forecast 2025-2030 ($ million)
Chart on Electricity - Year-over-year growth 2025-2030 (%)
Data Table on Electricity - Year-over-year growth 2025-2030 (%)

9.5 Transportation - Market size and forecast 2025-2030

Chart on Transportation - Market size and forecast 2025-2030 ($ million)
Data Table on Transportation - Market size and forecast 2025-2030 ($ million)
Chart on Transportation - Year-over-year growth 2025-2030 (%)
Data Table on Transportation - Year-over-year growth 2025-2030 (%)

9.6 Others - Market size and forecast 2025-2030

Chart on Others - Market size and forecast 2025-2030 ($ million)
Data Table on Others - Market size and forecast 2025-2030 ($ million)
Chart on Others - Year-over-year growth 2025-2030 (%)
Data Table on Others - Year-over-year growth 2025-2030 (%)

9.7 Market opportunity by End-user

Market opportunity by End-user ($ million)
Data Table on Market opportunity by End-user ($ million)

10. Market Segmentation by Type

10.1 Market segments

Chart on Type - Market share 2025-2030 (%)
Data Table on Type - Market share 2025-2030 (%)

10.2 Comparison by Type

Chart on Comparison by Type
Data Table on Comparison by Type

10.3 Metallic utilities - Market size and forecast 2025-2030

Chart on Metallic utilities - Market size and forecast 2025-2030 ($ million)
Data Table on Metallic utilities - Market size and forecast 2025-2030 ($ million)
Chart on Metallic utilities - Year-over-year growth 2025-2030 (%)
Data Table on Metallic utilities - Year-over-year growth 2025-2030 (%)

10.4 Non-metallic utilities - Market size and forecast 2025-2030

Chart on Non-metallic utilities - Market size and forecast 2025-2030 ($ million)
Data Table on Non-metallic utilities - Market size and forecast 2025-2030 ($ million)
Chart on Non-metallic utilities - Year-over-year growth 2025-2030 (%)
Data Table on Non-metallic utilities - Year-over-year growth 2025-2030 (%)

10.5 Market opportunity by Type

Market opportunity by Type ($ million)
Data Table on Market opportunity by Type ($ million)

11. Customer Landscape

11.1 Customer landscape overview

Analysis of price sensitivity, lifecycle, customer purchase basket, adoption rates, and purchase criteria

12. Geographic Landscape

12.1 Geographic segmentation

Chart on Market share by geography 2025-2030 (%)
Data Table on Market share by geography 2025-2030 (%)

12.2 Geographic comparison

Chart on Geographic comparison
Data Table on Geographic comparison

12.3 North America - Market size and forecast 2025-2030

Chart on North America - Market size and forecast 2025-2030 ($ million)
Data Table on North America - Market size and forecast 2025-2030 ($ million)
Chart on North America - Year-over-year growth 2025-2030 (%)
Data Table on North America - Year-over-year growth 2025-2030 (%)
Chart on Regional Comparison - North America
Data Table on Regional Comparison - North America

12.3.1 US - Market size and forecast 2025-2030

Chart on US - Market size and forecast 2025-2030 ($ million)
Data Table on US - Market size and forecast 2025-2030 ($ million)
Chart on US - Year-over-year growth 2025-2030 (%)
Data Table on US - Year-over-year growth 2025-2030 (%)

12.3.2 Canada - Market size and forecast 2025-2030

Chart on Canada - Market size and forecast 2025-2030 ($ million)
Data Table on Canada - Market size and forecast 2025-2030 ($ million)
Chart on Canada - Year-over-year growth 2025-2030 (%)
Data Table on Canada - Year-over-year growth 2025-2030 (%)

12.3.3 Mexico - Market size and forecast 2025-2030

Chart on Mexico - Market size and forecast 2025-2030 ($ million)
Data Table on Mexico - Market size and forecast 2025-2030 ($ million)
Chart on Mexico - Year-over-year growth 2025-2030 (%)
Data Table on Mexico - Year-over-year growth 2025-2030 (%)

12.4 Europe - Market size and forecast 2025-2030

Chart on Europe - Market size and forecast 2025-2030 ($ million)
Data Table on Europe - Market size and forecast 2025-2030 ($ million)
Chart on Europe - Year-over-year growth 2025-2030 (%)
Data Table on Europe - Year-over-year growth 2025-2030 (%)
Chart on Regional Comparison - Europe
Data Table on Regional Comparison - Europe

12.4.1 Germany - Market size and forecast 2025-2030

Chart on Germany - Market size and forecast 2025-2030 ($ million)
Data Table on Germany - Market size and forecast 2025-2030 ($ million)
Chart on Germany - Year-over-year growth 2025-2030 (%)
Data Table on Germany - Year-over-year growth 2025-2030 (%)

12.4.2 UK - Market size and forecast 2025-2030

Chart on UK - Market size and forecast 2025-2030 ($ million)
Data Table on UK - Market size and forecast 2025-2030 ($ million)
Chart on UK - Year-over-year growth 2025-2030 (%)
Data Table on UK - Year-over-year growth 2025-2030 (%)

12.4.3 France - Market size and forecast 2025-2030

Chart on France - Market size and forecast 2025-2030 ($ million)
Data Table on France - Market size and forecast 2025-2030 ($ million)
Chart on France - Year-over-year growth 2025-2030 (%)
Data Table on France - Year-over-year growth 2025-2030 (%)

12.4.4 Italy - Market size and forecast 2025-2030

Chart on Italy - Market size and forecast 2025-2030 ($ million)
Data Table on Italy - Market size and forecast 2025-2030 ($ million)
Chart on Italy - Year-over-year growth 2025-2030 (%)
Data Table on Italy - Year-over-year growth 2025-2030 (%)

12.4.5 Spain - Market size and forecast 2025-2030

Chart on Spain - Market size and forecast 2025-2030 ($ million)
Data Table on Spain - Market size and forecast 2025-2030 ($ million)
Chart on Spain - Year-over-year growth 2025-2030 (%)
Data Table on Spain - Year-over-year growth 2025-2030 (%)

12.4.6 The Netherlands - Market size and forecast 2025-2030

Chart on The Netherlands - Market size and forecast 2025-2030 ($ million)
Data Table on The Netherlands - Market size and forecast 2025-2030 ($ million)
Chart on The Netherlands - Year-over-year growth 2025-2030 (%)
Data Table on The Netherlands - Year-over-year growth 2025-2030 (%)

12.5 APAC - Market size and forecast 2025-2030

Chart on APAC - Market size and forecast 2025-2030 ($ million)
Data Table on APAC - Market size and forecast 2025-2030 ($ million)
Chart on APAC - Year-over-year growth 2025-2030 (%)
Data Table on APAC - Year-over-year growth 2025-2030 (%)
Chart on Regional Comparison - APAC
Data Table on Regional Comparison - APAC

12.5.1 China - Market size and forecast 2025-2030

Chart on China - Market size and forecast 2025-2030 ($ million)
Data Table on China - Market size and forecast 2025-2030 ($ million)
Chart on China - Year-over-year growth 2025-2030 (%)
Data Table on China - Year-over-year growth 2025-2030 (%)

12.5.2 Japan - Market size and forecast 2025-2030

Chart on Japan - Market size and forecast 2025-2030 ($ million)
Data Table on Japan - Market size and forecast 2025-2030 ($ million)
Chart on Japan - Year-over-year growth 2025-2030 (%)
Data Table on Japan - Year-over-year growth 2025-2030 (%)

12.5.3 India - Market size and forecast 2025-2030

Chart on India - Market size and forecast 2025-2030 ($ million)
Data Table on India - Market size and forecast 2025-2030 ($ million)
Chart on India - Year-over-year growth 2025-2030 (%)
Data Table on India - Year-over-year growth 2025-2030 (%)

12.5.4 South Korea - Market size and forecast 2025-2030

Chart on South Korea - Market size and forecast 2025-2030 ($ million)
Data Table on South Korea - Market size and forecast 2025-2030 ($ million)
Chart on South Korea - Year-over-year growth 2025-2030 (%)
Data Table on South Korea - Year-over-year growth 2025-2030 (%)

12.5.5 Australia - Market size and forecast 2025-2030

Chart on Australia - Market size and forecast 2025-2030 ($ million)
Data Table on Australia - Market size and forecast 2025-2030 ($ million)
Chart on Australia - Year-over-year growth 2025-2030 (%)
Data Table on Australia - Year-over-year growth 2025-2030 (%)

12.5.6 Indonesia - Market size and forecast 2025-2030

Chart on Indonesia - Market size and forecast 2025-2030 ($ million)
Data Table on Indonesia - Market size and forecast 2025-2030 ($ million)
Chart on Indonesia - Year-over-year growth 2025-2030 (%)
Data Table on Indonesia - Year-over-year growth 2025-2030 (%)

12.6 South America - Market size and forecast 2025-2030

Chart on South America - Market size and forecast 2025-2030 ($ million)
Data Table on South America - Market size and forecast 2025-2030 ($ million)
Chart on South America - Year-over-year growth 2025-2030 (%)
Data Table on South America - Year-over-year growth 2025-2030 (%)
Chart on Regional Comparison - South America
Data Table on Regional Comparison - South America

12.6.1 Brazil - Market size and forecast 2025-2030

Chart on Brazil - Market size and forecast 2025-2030 ($ million)
Data Table on Brazil - Market size and forecast 2025-2030 ($ million)
Chart on Brazil - Year-over-year growth 2025-2030 (%)
Data Table on Brazil - Year-over-year growth 2025-2030 (%)

12.6.2 Argentina - Market size and forecast 2025-2030

Chart on Argentina - Market size and forecast 2025-2030 ($ million)
Data Table on Argentina - Market size and forecast 2025-2030 ($ million)
Chart on Argentina - Year-over-year growth 2025-2030 (%)
Data Table on Argentina - Year-over-year growth 2025-2030 (%)

12.6.3 Chile - Market size and forecast 2025-2030

Chart on Chile - Market size and forecast 2025-2030 ($ million)
Data Table on Chile - Market size and forecast 2025-2030 ($ million)
Chart on Chile - Year-over-year growth 2025-2030 (%)
Data Table on Chile - Year-over-year growth 2025-2030 (%)

12.7 Middle East and Africa - Market size and forecast 2025-2030

Chart on Middle East and Africa - Market size and forecast 2025-2030 ($ million)
Data Table on Middle East and Africa - Market size and forecast 2025-2030 ($ million)
Chart on Middle East and Africa - Year-over-year growth 2025-2030 (%)
Data Table on Middle East and Africa - Year-over-year growth 2025-2030 (%)
Chart on Regional Comparison - Middle East and Africa
Data Table on Regional Comparison - Middle East and Africa

12.7.1 Saudi Arabia - Market size and forecast 2025-2030

Chart on Saudi Arabia - Market size and forecast 2025-2030 ($ million)
Data Table on Saudi Arabia - Market size and forecast 2025-2030 ($ million)
Chart on Saudi Arabia - Year-over-year growth 2025-2030 (%)
Data Table on Saudi Arabia - Year-over-year growth 2025-2030 (%)

12.7.2 UAE - Market size and forecast 2025-2030

Chart on UAE - Market size and forecast 2025-2030 ($ million)
Data Table on UAE - Market size and forecast 2025-2030 ($ million)
Chart on UAE - Year-over-year growth 2025-2030 (%)
Data Table on UAE - Year-over-year growth 2025-2030 (%)

12.7.3 South Africa - Market size and forecast 2025-2030

Chart on South Africa - Market size and forecast 2025-2030 ($ million)
Data Table on South Africa - Market size and forecast 2025-2030 ($ million)
Chart on South Africa - Year-over-year growth 2025-2030 (%)
Data Table on South Africa - Year-over-year growth 2025-2030 (%)

12.7.4 Israel - Market size and forecast 2025-2030

Chart on Israel - Market size and forecast 2025-2030 ($ million)
Data Table on Israel - Market size and forecast 2025-2030 ($ million)
Chart on Israel - Year-over-year growth 2025-2030 (%)
Data Table on Israel - Year-over-year growth 2025-2030 (%)

12.7.5 Turkey - Market size and forecast 2025-2030

Chart on Turkey - Market size and forecast 2025-2030 ($ million)
Data Table on Turkey - Market size and forecast 2025-2030 ($ million)
Chart on Turkey - Year-over-year growth 2025-2030 (%)
Data Table on Turkey - Year-over-year growth 2025-2030 (%)

12.8 Market opportunity by geography

Market opportunity by geography ($ million)
Data Tables on Market opportunity by geography ($ million)

13. Drivers, Challenges, and Opportunity

13.1 Market drivers

Surge in global infrastructure spending and modernization mandates
Stringent regulatory mandates and escalating costs of utility damages
Technological advancement and shift towards digital subsurface mapping

13.2 Market challenges

Increasing subsurface congestion and signal complexity
Shortage of skilled operators and inadequate training
Inaccurate records and proliferation of unlocatable utilities

13.3 Impact of drivers and challenges

Impact of drivers and challenges in 2025 and 2030

13.4 Market opportunities

Integration with digital workflows and rise of subsurface digital twins
Convergence of technologies and multi-sensor platforms
Specialization and development of diagnostic capabilities

14. Competitive Landscape

14.1 Overview

14.2

Overview on criticality of inputs and factors of differentiation

14.3 Landscape disruption

Overview on factors of disruption

14.4 Industry risks

Impact of key risks on business

15. Competitive Analysis

15.1 Companies profiled

Companies covered

15.2 Company ranking index

15.3 Market positioning of companies

Matrix on companies position and classification

15.4 3M Co.

3M Co. - Overview
3M Co. - Business segments
3M Co. - Key news
3M Co. - Key offerings
3M Co. - Segment focus
SWOT

15.5 Berntsen International Inc.

Berntsen International Inc. - Overview
Berntsen International Inc. - Product / Service
Berntsen International Inc. - Key offerings
SWOT

15.6 Emerson Electric Co.

Emerson Electric Co. - Overview
Emerson Electric Co. - Business segments
Emerson Electric Co. - Key news
Emerson Electric Co. - Key offerings
Emerson Electric Co. - Segment focus
SWOT

15.7 Eos Positioning Systems Inc.

Eos Positioning Systems Inc. - Overview
Eos Positioning Systems Inc. - Product / Service
Eos Positioning Systems Inc. - Key offerings
SWOT

15.8 Geophysical Survey Systems Inc.

Geophysical Survey Systems Inc. - Overview
Geophysical Survey Systems Inc. - Product / Service
Geophysical Survey Systems Inc. - Key offerings
SWOT

15.9 Hexagon AB

Hexagon AB - Overview
Hexagon AB - Business segments
Hexagon AB - Key news
Hexagon AB - Key offerings
Hexagon AB - Segment focus
SWOT

15.10 Leica Geosystems AG

Leica Geosystems AG - Overview
Leica Geosystems AG - Product / Service
Leica Geosystems AG - Key offerings
SWOT

15.11 MidAmerican Technology Inc.

MidAmerican Technology Inc. - Overview
MidAmerican Technology Inc. - Product / Service
MidAmerican Technology Inc. - Key offerings
SWOT

15.12 RYCOM Instruments Inc.

RYCOM Instruments Inc. - Overview
RYCOM Instruments Inc. - Product / Service
RYCOM Instruments Inc. - Key offerings
SWOT

15.13 SPX Technologies Inc.

SPX Technologies Inc. - Overview
SPX Technologies Inc. - Business segments
SPX Technologies Inc. - Key news
SPX Technologies Inc. - Key offerings
SPX Technologies Inc. - Segment focus
SWOT

15.14 STC TECHNO AC LLC

STC TECHNO AC LLC - Overview
STC TECHNO AC LLC - Product / Service
STC TECHNO AC LLC - Key offerings
SWOT

15.15 SubSurface Instruments Inc.

SubSurface Instruments Inc. - Overview
SubSurface Instruments Inc. - Product / Service
SubSurface Instruments Inc. - Key offerings
SWOT

15.16 The Toro Co.

The Toro Co. - Overview
The Toro Co. - Business segments
The Toro Co. - Key news
The Toro Co. - Key offerings
The Toro Co. - Segment focus
SWOT

15.17 Vermeer Corp.

Vermeer Corp. - Overview
Vermeer Corp. - Product / Service
Vermeer Corp. - Key offerings
SWOT

15.18 Vivax Metrotech Corp.

Vivax Metrotech Corp. - Overview
Vivax Metrotech Corp. - Product / Service
Vivax Metrotech Corp. - Key offerings
SWOT

16. Appendix

16.1 Scope of the report

Market definition
Objectives
Notes and caveats

16.2 Inclusions and exclusions checklist

Inclusions checklist
Exclusions checklist

16.3 Currency conversion rates for US$

16.4 Research methodology

16.5 Data procurement

Information sources

16.6 Data validation

16.7 Validation techniques employed for market sizing

16.8 Data synthesis

16.9 360 degree market analysis

16.10 List of abbreviations

Research Methodology

Technavio presents a detailed picture of the market by way of study, synthesis, and summation of data from multiple sources. The analysts have presented the various facets of the market with a particular focus on identifying the key industry influencers. The data thus presented is comprehensive, reliable, and the result of extensive research, both primary and secondary.

INFORMATION SOURCES

Primary sources

  • Manufacturers and suppliers
  • Channel partners
  • Industry experts
  • Strategic decision makers

Secondary sources

  • Industry journals and periodicals
  • Government data
  • Financial reports of key industry players
  • Historical data
  • Press releases

DATA ANALYSIS

Data Synthesis

  • Collation of data
  • Estimation of key figures
  • Analysis of derived insights

Data Validation

  • Triangulation with data models
  • Reference against proprietary databases
  • Corroboration with industry experts

REPORT WRITING

Qualitative

  • Market drivers
  • Market challenges
  • Market trends
  • Five forces analysis

Quantitative

  • Market size and forecast
  • Market segmentation
  • Geographical insights
  • Competitive landscape

Interested in this report?

Get your sample now to see our research methodology and insights!

Download Now

Frequently Asked Questions

Utility Locator market growth will increase by USD 2341.7 million during 2026-2030 .

The Utility Locator market is expected to grow at a CAGR of 6% during 2026-2030 .

Utility Locator market is segmented by Technique (Electromagnetic field, Ground penetrating radar) End-user (Oil and gas, Electricity, Transportation, Others) Type (Metallic utilities, Non-metallic utilities)

3M Co., Berntsen International Inc., Emerson Electric Co., Eos Positioning Systems Inc., Geophysical Survey Systems Inc., Guideline Geo AB, Hexagon AB, Leica Geosystems AG, MidAmerican Technology Inc., Radiodetection Ltd., RYCOM Instruments Inc., SPX Technologies Inc., STC TECHNO AC LLC, SubSurface Instruments Inc., The Toro Co., Vermeer Corp., Vivax Metrotech Corp. are a few of the key vendors in the Utility Locator market.

APAC will register the highest growth rate of 34.1% among the other regions. Therefore, the Utility Locator market in APAC is expected to garner significant business opportunities for the vendors during the forecast period.

US, Canada, Mexico, Germany, UK, France, Italy, Spain, The Netherlands, China, Japan, India, South Korea, Australia, Indonesia, Brazil, Argentina, Chile, Saudi Arabia, UAE, South Africa, Israel, Turkey

  • Surge in global infrastructure spending and modernization mandates is the driving factor this market.

The Utility Locator market vendors should focus on grabbing business opportunities from the Technique segment as it accounted for the largest market share in the base year.