Vacuum Insulation Panels Market Analysis, Size, and Forecast 2026-2030: APAC (China, Japan, and India), North America (US, Canada, and Mexico), Europe (Germany, UK, and France), South America (Brazil and Argentina), Middle East and Africa (Saudi Arabia, UAE, and South Africa), and Rest of World (ROW)

Vacuum Insulation Panels Market Analysis, Size, and Forecast 2026-2030:
APAC (China, Japan, and India), North America (US, Canada, and Mexico), Europe (Germany, UK, and France), South America (Brazil and Argentina), Middle East and Africa (Saudi Arabia, UAE, and South Africa), and Rest of World (ROW)

Published: Mar 2026 305 Pages SKU: IRTNTR43296

Market Overview at a Glance

$2.22 B
Market Opportunity
4.7%
CAGR 2025 - 2030
38.1%
APAC Growth
$3.01 B
Construction segment 2024

Vacuum Insulation Panels Market Size 2026-2030

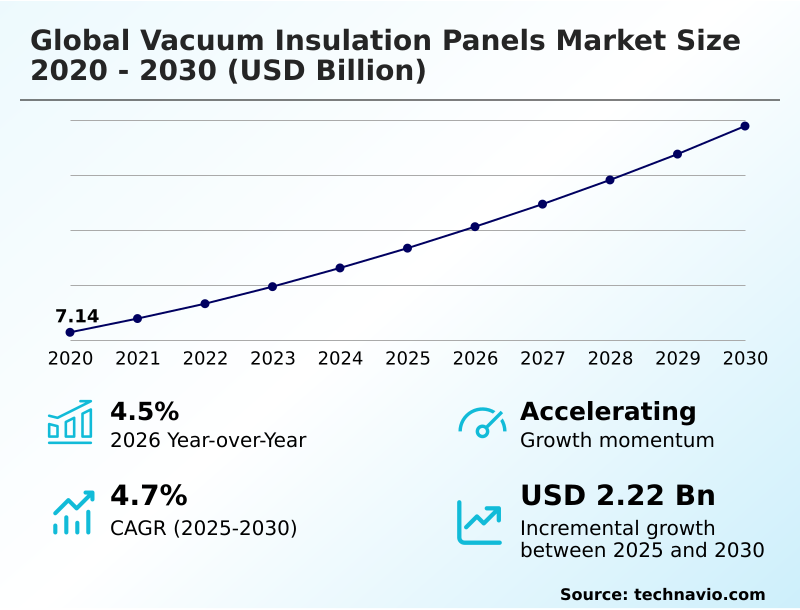
The vacuum insulation panels market size is valued to increase by USD 2.22 billion, at a CAGR of 4.7% from 2025 to 2030. Increased urbanization and investment in infrastructure development will drive the vacuum insulation panels market.

Major Market Trends & Insights

  • APAC dominated the market and accounted for a 38.1% growth during the forecast period.
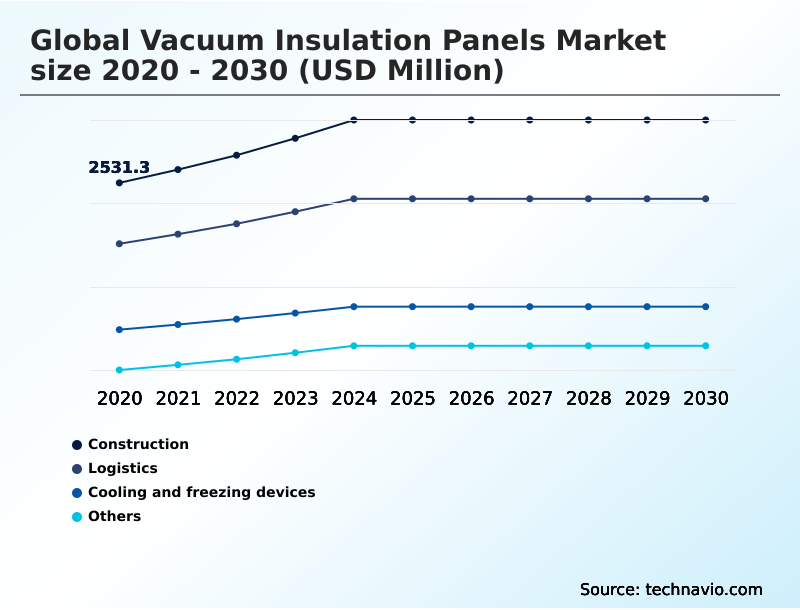
  • By End-user - Construction segment was valued at USD 3.01 billion in 2024
  • By Material - Silica segment accounted for the largest market revenue share in 2024

Market Size & Forecast

  • Market Opportunities: USD 3.75 billion
  • Market Future Opportunities: USD 2.22 billion
  • CAGR from 2025 to 2030 : 4.7%

Market Summary

  • The vacuum insulation panels market is advancing rapidly, driven by a convergence of stringent energy regulations and the need for high-performance thermal management in space-constrained applications. These panels, which leverage a microporous insulation structure under vacuum to achieve an exceptionally low thermal conductivity value, are becoming indispensable in sectors such as construction, logistics, and appliance manufacturing.
  • Key drivers include the push for zero-energy building design and the operational cost savings associated with superior building envelope efficiency. In logistics, a major pharmaceutical distributor could leverage temperature-controlled packaging with integrated panels to guarantee the hermetic seal integrity of vaccine shipments across fluctuating climates, ensuring compliance and preventing costly product loss.
  • A prominent trend is the development of hybrid core materials, combining the benefits of fumed silica core structures with cost-effective alternatives to broaden application viability. The market is also addressing durability challenges like thermal cycling stress and moisture vapor transmission by engineering more robust high-barrier multilayer films.
  • This focus on innovation is expanding the use of panels from niche applications to mainstream solutions, where both thermal performance and spatial efficiency are paramount.

What will be the Size of the Vacuum Insulation Panels Market during the forecast period?

Get Key Insights on Market Forecast (PDF) Request Free Sample

How is the Vacuum Insulation Panels Market Segmented?

The vacuum insulation panels industry research report provides comprehensive data (region-wise segment analysis), with forecasts and estimates in "USD million" for the period 2026-2030, as well as historical data from 2020-2024 for the following segments.

  • End-user
    • Construction
    • Logistics
    • Cooling and freezing devices
    • Others
  • Material
    • Silica
    • Fiberglass
    • Others
  • Product
    • Flat
    • Special shape
  • Geography
    • APAC
      • China
      • Japan
      • India
    • North America
      • US
      • Canada
      • Mexico
    • Europe
      • Germany
      • UK
      • France
    • South America
      • Brazil
      • Argentina
    • Middle East and Africa
      • Saudi Arabia
      • UAE
      • South Africa
    • Rest of World (ROW)

By End-user Insights

The construction segment is estimated to witness significant growth during the forecast period.

The construction segment leverages vacuum insulation panels to meet stringent energy efficiency regulations, particularly for sustainable building. In high-density urban projects, these panels provide a competitive advantage by maximizing usable floor area without compromising thermal performance.

The low thermal conductivity value and long panel service life of units produced with advanced vacuum sealing technology make them ideal for permanent structures. The microporous insulation structure resists core material compression and limits moisture vapor transmission.

This is crucial for achieving nearly zero-energy building standards. Applications are expanding from building envelopes to specialized uses like medical device insulation and electronic component cooling.

The manufacturing process, often requiring a clean room environment and high-vacuum chamber, supports custom panel sizing to fit complex architectural designs, while a growing focus on recyclable insulation materials aligns with circular economy goals.

Their adoption in retrofits has been shown to improve a building's thermal envelope efficiency by over 30%.

Request Free Sample

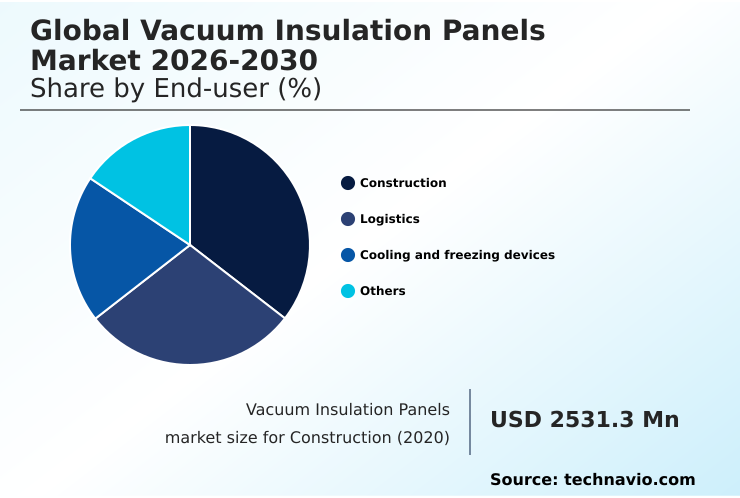
The Construction segment was valued at USD 3.01 billion in 2024 and showed a gradual increase during the forecast period.

Request Free Sample

Regional Analysis

APAC is estimated to contribute 38.1% to the growth of the global market during the forecast period.Technavio’s analysts have elaborately explained the regional trends and drivers that shape the market during the forecast period.

See How Vacuum Insulation Panels Market Demand is Rising in APAC Request Free Sample

The geographic landscape is characterized by varied regional priorities. In Europe, the focus is on building retrofit insulation using premium fumed silica core panels that meet stringent codes for energy-efficient building materials, ensuring long-term thermal stability.

North America sees high demand in cold chain logistics insulation, where maintaining hermetic seal integrity in insulated shipping solutions is paramount.

The APAC region, a hub for appliance manufacturing, heavily utilizes cost-effective fiberglass core material to achieve high R-value per inch, with some leading manufacturers reporting a 99.8% success rate in their VIP manufacturing process.

Emerging applications like battery thermal management for electric vehicles are creating new opportunities globally. Advanced designs now mitigate the panel edge effect, improving overall thermal performance by up to 10% in integrated systems.

Market Dynamics

Our researchers analyzed the data with 2025 as the base year, along with the key drivers, trends, and challenges. A holistic analysis of drivers will help companies refine their marketing strategies to gain a competitive advantage.

  • Strategic decision-making in the industry involves a deep cost-benefit analysis of vacuum insulation panels, especially when comparing silica vs fiberglass vip cores for different applications. For high-rise construction, thin insulation solutions for high-rise buildings are essential, with passive house design with vacuum insulation becoming a benchmark for energy efficiency. Simultaneously, integrating vips in modular construction streamlines building processes.
  • A critical aspect is reducing thermal bridging with vip solutions, though installers face challenges of installing vacuum insulation panels. In the automotive sector, vacuum insulation for electric vehicle batteries is a key innovation area. For existing structures, vip thermal performance in building retrofits offers a path to modernization.
  • The logistics sector is improving cold chain logistics with vips, using vip solutions for temperature-sensitive shipping to protect goods. A thorough lifecycle assessment of vacuum insulation panels is influencing material selection, considering the durability of vacuum insulation in appliances and medical equipment, such as vacuum insulation panels in medical refrigerators, where consistent energy savings with vip in refrigeration is critical.
  • The manufacturing process of vacuum insulation panels, protected by advanced barrier films for vip longevity, determines overall quality. Research into best core materials for vacuum insulation, including exploring aerogel-based vacuum insulation panel benefits, continues to drive innovation, especially for specialized uses like vacuum insulation panels for cryogenic storage, where performance is an order of magnitude higher than conventional methods.

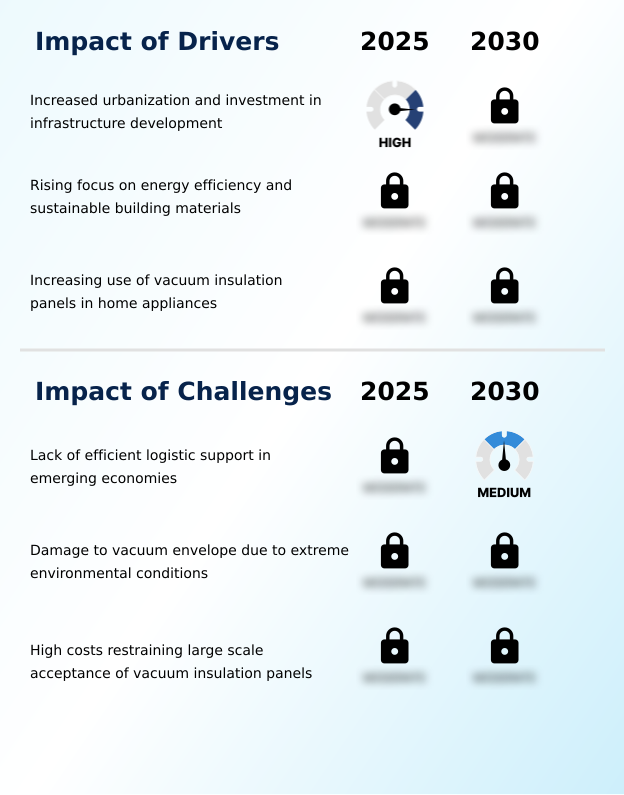
What are the key market drivers leading to the rise in the adoption of Vacuum Insulation Panels Industry?

  • Increased urbanization and significant investments in infrastructure development are key drivers for the market's growth.

  • The push toward sustainability is a major driver, with regulations mandating passive house standards and zero-energy building design.
  • Achieving this level of building envelope efficiency relies on sustainable insulation materials that provide high R-value insulation and enable effective thermal bridge mitigation.
  • In practice, implementing these materials improves a building's effective thermal resistance by over 40% compared to conventional insulation. Beyond construction, demand for passive building insulation is growing.
  • The logistics sector requires robust refrigerated transport insulation and specialized pharmaceutical shipping containers that maintain temperature stability for 120+ hours without power.
  • Furthermore, critical infrastructure like industrial pipeline insulation and data center cooling solutions are adopting these technologies to reduce operational energy consumption by up to 20%.

What are the market trends shaping the Vacuum Insulation Panels Industry?

  • A key market trend involves integrating advanced core materials like aerogel and polyurethane, which enhances thermal performance and diversifies insulation solutions.

  • The integration of advanced core materials is reshaping the market, with aerogel-infused cores and polyurethane-based cores offering new balances between cost and performance. These innovations, alongside developments in nano-porous materials and open-cell foam cores, facilitate architectural insulation design for complex geometries, a critical factor in modular construction insulation.
  • This evolution supports a broader range of thin-profile insulation panels and advanced thermal management solutions. Rigorous thermal performance testing shows that new panel designs with improved getter material integration can extend service life by up to 15%.
  • This is particularly vital for cryogenic insulation systems and enhancing appliance energy efficiency, where some next-generation refrigerators demonstrate a 25% improvement in thermal resistance over previous models.

What challenges does the Vacuum Insulation Panels Industry face during its growth?

  • A key challenge affecting industry growth is the lack of efficient logistical support for fragile insulation components in emerging economies.

  • Key challenges center on long-term durability, as high-performance thermal insulation can suffer from vacuum level degradation over time. Issues such as barrier film delamination and heat-sealed seam fatigue, exacerbated by thermal cycling stress, impact the reliability of space-saving insulation solutions. The effectiveness of high-barrier multilayer films is compromised by the inherent gas permeation rate and outgassing characteristics of core materials.
  • Panels with inconsistent core material density are 30% more likely to fail prematurely. These vulnerabilities are critical for applications like ultra-low temperature freezers and temperature-controlled packaging, where a single panel failure can result in significant product loss.
  • Developing improved structural insulation panels and fire-resistant insulation cores that resist these degradation pathways is essential for broader market acceptance, as failure rates in some harsh environments can reach up to 5% annually.

Exclusive Technavio Analysis on Customer Landscape

The vacuum insulation panels market forecasting report includes the adoption lifecycle of the market, covering from the innovator’s stage to the laggard’s stage. It focuses on adoption rates in different regions based on penetration. Furthermore, the vacuum insulation panels market report also includes key purchase criteria and drivers of price sensitivity to help companies evaluate and develop their market growth analysis strategies.

Customer Landscape of Vacuum Insulation Panels Industry

Competitive Landscape

Companies are implementing various strategies, such as strategic alliances, vacuum insulation panels market forecast, partnerships, mergers and acquisitions, geographical expansion, and product/service launches, to enhance their presence in the industry.

Avery Dennison Corp. - Delivers advanced vacuum insulation panels, providing high-performance thermal solutions across construction, refrigeration, and logistics sectors.

The industry research and growth report includes detailed analyses of the competitive landscape of the market and information about key companies, including:

  • Avery Dennison Corp.
  • BASF SE
  • Bridgestone Corp.
  • Dow Chemical Co.
  • Etex NV
  • Evonik Industries AG
  • Kingspan Group
  • Knauf Digital GmbH
  • Morgan Advanced Materials
  • OCI Co. Ltd.
  • Panasonic Holdings Corp.
  • Sealed Air Corp.
  • Siltherm
  • Thermacor Process Inc.
  • Tiger Corp.
  • Turna d.o.o.
  • va Q tec AG

Qualitative and quantitative analysis of companies has been conducted to help clients understand the wider business environment as well as the strengths and weaknesses of key industry players. Data is qualitatively analyzed to categorize companies as pure play, category-focused, industry-focused, and diversified; it is quantitatively analyzed to categorize companies as dominant, leading, strong, tentative, and weak.

Recent Development and News in Vacuum insulation panels market

  • In February, 2025, Kingspan Group announced a strategic expansion of its vacuum insulation production capacity in Europe to meet the surging demand for its Optim R product line, targeting high-rise residential and commercial refurbishment projects.
  • In April, 2025, va Q tec AG revealed a new partnership with a major global airline to deploy a fleet of high-performance thermal containers for distributing temperature-sensitive oncology medications across Southeast Asia.
  • In July, 2025, Panasonic Holdings Corp. introduced its newest line of energy-efficient refrigerators for the European market, featuring an integrated vacuum insulation system that achieves a 30% reduction in electricity usage compared to previous models.
  • In September, 2025, Morgan Advanced Materials announced a successful test flight of a specialized thermal shield for satellite components that utilized a bespoke fiberglass-based vacuum panel to withstand extreme thermal radiation in space.

Dive into Technavio’s robust research methodology, blending expert interviews, extensive data synthesis, and validated models for unparalleled Vacuum Insulation Panels Market insights. See full methodology.

Market Scope
Page number 305
Base year 2025
Historic period 2020-2024
Forecast period 2026-2030
Growth momentum & CAGR Accelerate at a CAGR of 4.7%
Market growth 2026-2030 USD 2217.1 million
Market structure Fragmented
YoY growth 2025-2026(%) 4.5%
Key countries China, Japan, India, South Korea, Australia, Indonesia, US, Canada, Mexico, Germany, UK, France, Italy, Spain, The Netherlands, Brazil, Argentina, Chile, Saudi Arabia, UAE, South Africa, Israel and Turkey
Competitive landscape Leading Companies, Market Positioning of Companies, Competitive Strategies, and Industry Risks

Request Free Sample

Research Analyst Overview

  • The market's evolution is defined by a push for greater building envelope efficiency, driven by passive house standards and zero-energy building design. The core of this technology, whether a fumed silica core or a fiberglass core material, relies on a sophisticated VIP manufacturing process conducted in a clean room environment using a high-vacuum chamber.
  • Maintaining hermetic seal integrity with high-barrier multilayer films is paramount to prevent vacuum level degradation caused by gas permeation rate and moisture vapor transmission. Advanced vacuum sealing technology mitigates heat-sealed seam fatigue and barrier film delamination from thermal cycling stress.
  • Key performance metrics include the thermal conductivity value and R-value per inch, which determine effective thermal resistance and overall panel service life. Innovations in microporous insulation structure, including aerogel-infused cores, polyurethane-based cores, and other nano-porous materials like open-cell foam cores, address the outgassing characteristics and core material compression of evacuated powder insulation.
  • These materials, along with getter material integration and phase change materials (PCMs), reduce radiant heat transfer through gas-filled pores. For designers, thermal bridge mitigation and minimizing the panel edge effect through custom panel sizing are critical.
  • This focus on performance has led to integrated systems that demonstrate a 30% improvement in thermal efficiency, a decisive factor in boardroom decisions on product strategy and compliance.

What are the Key Data Covered in this Vacuum Insulation Panels Market Research and Growth Report?

  • What is the expected growth of the Vacuum Insulation Panels Market between 2026 and 2030?

    • USD 2.22 billion, at a CAGR of 4.7%

  • What segmentation does the market report cover?

    • The report is segmented by End-user (Construction, Logistics, Cooling and freezing devices, and Others), Material (Silica, Fiberglass, and Others), Product (Flat, and Special shape) and Geography (APAC, North America, Europe, South America, Middle East and Africa)

  • Which regions are analyzed in the report?

    • APAC, North America, Europe, South America and Middle East and Africa

  • What are the key growth drivers and market challenges?

    • Increased urbanization and investment in infrastructure development, Lack of efficient logistic support in emerging economies

  • Who are the major players in the Vacuum Insulation Panels Market?

    • Avery Dennison Corp., BASF SE, Bridgestone Corp., Dow Chemical Co., Etex NV, Evonik Industries AG, Kingspan Group, Knauf Digital GmbH, Morgan Advanced Materials, OCI Co. Ltd., Panasonic Holdings Corp., Sealed Air Corp., Siltherm, Thermacor Process Inc., Tiger Corp., Turna d.o.o. and va Q tec AG

Market Research Insights

  • The market for high-performance thermal insulation is expanding as industries adopt space-saving insulation solutions to meet efficiency and sustainability goals. In construction, energy-efficient building materials are now mandated by codes that have seen a 40% tightening in thermal performance requirements over the last decade.
  • The adoption of thin-profile insulation panels allows architects to maximize floor space without compromising on high R-value insulation. In logistics, the use of temperature-controlled packaging and insulated shipping solutions has reduced product spoilage rates by over 75% for certain high-value pharmaceuticals.
  • These sustainable insulation materials ensure long-term thermal stability, which is critical for applications ranging from cold chain logistics insulation to refrigerated transport insulation and advanced battery thermal management systems.

We can help! Our analysts can customize this vacuum insulation panels market research report to meet your requirements.

Get in touch

1. Executive Summary

1.1 Market overview

Executive Summary - Chart on Market Overview
Executive Summary - Data Table on Market Overview
Executive Summary - Chart on Global Market Characteristics
Executive Summary - Chart on Market by Geography
Executive Summary - Chart on Market Segmentation by End-user
Executive Summary - Chart on Market Segmentation by Material
Executive Summary - Chart on Market Segmentation by Product
Executive Summary - Chart on Incremental Growth
Executive Summary - Data Table on Incremental Growth
Executive Summary - Chart on Company Market Positioning

2. Technavio Analysis

2.1 Analysis of price sensitivity, lifecycle, customer purchase basket, adoption rates, and purchase criteria

2.2 Criticality of inputs and Factors of differentiation

Chart on Overview on criticality of inputs and factors of differentiation

2.3 Factors of disruption

Chart on Overview on factors of disruption

2.4 Impact of drivers and challenges

Chart on Impact of drivers and challenges in 2025 and 2030

3. Market Landscape

3.1 Market ecosystem

Chart on Parent Market
Data Table on - Parent Market

3.2 Market characteristics

Chart on Market characteristics analysis

3.3 Value chain analysis

Chart on Value chain analysis

4. Market Sizing

4.1 Market definition

Data Table on Offerings of companies included in the market definition

4.2 Market segment analysis

Market segments

4.3 Market size 2025

4.4 Market outlook: Forecast for 2025-2030

Chart on Global - Market size and forecast 2025-2030 ($ million)
Data Table on Global - Market size and forecast 2025-2030 ($ million)
Chart on Global Market: Year-over-year growth 2025-2030 (%)
Data Table on Global Market: Year-over-year growth 2025-2030 (%)

5. Historic Market Size

5.1 Global Vacuum Insulation Panels Market 2020 - 2024

Historic Market Size - Data Table on Global Vacuum Insulation Panels Market 2020 - 2024 ($ million)

5.2 End-user segment analysis 2020 - 2024

Historic Market Size - End-user Segment 2020 - 2024 ($ million)

5.3 Material segment analysis 2020 - 2024

Historic Market Size - Material Segment 2020 - 2024 ($ million)

5.4 Product segment analysis 2020 - 2024

Historic Market Size - Product Segment 2020 - 2024 ($ million)

5.5 Geography segment analysis 2020 - 2024

Historic Market Size - Geography Segment 2020 - 2024 ($ million)

5.6 Country segment analysis 2020 - 2024

Historic Market Size - Country Segment 2020 - 2024 ($ million)

6. Qualitative Analysis

6.1 Impact of AI on Global Vacuum Insulation Panels Market

6.2 Impact of Geopolitical Conflicts on Global Vacuum Insulation Panels Market

7. Five Forces Analysis

7.1 Five forces summary

Five forces analysis - Comparison between 2025 and 2030

7.2 Bargaining power of buyers

Bargaining power of buyers - Impact of key factors 2025 and 2030

7.3 Bargaining power of suppliers

Bargaining power of suppliers - Impact of key factors in 2025 and 2030

7.4 Threat of new entrants

Threat of new entrants - Impact of key factors in 2025 and 2030

7.5 Threat of substitutes

Threat of substitutes - Impact of key factors in 2025 and 2030

7.6 Threat of rivalry

Threat of rivalry - Impact of key factors in 2025 and 2030

7.7 Market condition

Chart on Market condition - Five forces 2025 and 2030

8. Market Segmentation by End-user

8.1 Market segments

Chart on End-user - Market share 2025-2030 (%)
Data Table on End-user - Market share 2025-2030 (%)

8.2 Comparison by End-user

Chart on Comparison by End-user
Data Table on Comparison by End-user

8.3 Construction - Market size and forecast 2025-2030

Chart on Construction - Market size and forecast 2025-2030 ($ million)
Data Table on Construction - Market size and forecast 2025-2030 ($ million)
Chart on Construction - Year-over-year growth 2025-2030 (%)
Data Table on Construction - Year-over-year growth 2025-2030 (%)

8.4 Logistics - Market size and forecast 2025-2030

Chart on Logistics - Market size and forecast 2025-2030 ($ million)
Data Table on Logistics - Market size and forecast 2025-2030 ($ million)
Chart on Logistics - Year-over-year growth 2025-2030 (%)
Data Table on Logistics - Year-over-year growth 2025-2030 (%)

8.5 Cooling and freezing devices - Market size and forecast 2025-2030

Chart on Cooling and freezing devices - Market size and forecast 2025-2030 ($ million)
Data Table on Cooling and freezing devices - Market size and forecast 2025-2030 ($ million)
Chart on Cooling and freezing devices - Year-over-year growth 2025-2030 (%)
Data Table on Cooling and freezing devices - Year-over-year growth 2025-2030 (%)

8.6 Others - Market size and forecast 2025-2030

Chart on Others - Market size and forecast 2025-2030 ($ million)
Data Table on Others - Market size and forecast 2025-2030 ($ million)
Chart on Others - Year-over-year growth 2025-2030 (%)
Data Table on Others - Year-over-year growth 2025-2030 (%)

8.7 Market opportunity by End-user

Market opportunity by End-user ($ million)
Data Table on Market opportunity by End-user ($ million)

9. Market Segmentation by Material

9.1 Market segments

Chart on Material - Market share 2025-2030 (%)
Data Table on Material - Market share 2025-2030 (%)

9.2 Comparison by Material

Chart on Comparison by Material
Data Table on Comparison by Material

9.3 Silica - Market size and forecast 2025-2030

Chart on Silica - Market size and forecast 2025-2030 ($ million)
Data Table on Silica - Market size and forecast 2025-2030 ($ million)
Chart on Silica - Year-over-year growth 2025-2030 (%)
Data Table on Silica - Year-over-year growth 2025-2030 (%)

9.4 Fiberglass - Market size and forecast 2025-2030

Chart on Fiberglass - Market size and forecast 2025-2030 ($ million)
Data Table on Fiberglass - Market size and forecast 2025-2030 ($ million)
Chart on Fiberglass - Year-over-year growth 2025-2030 (%)
Data Table on Fiberglass - Year-over-year growth 2025-2030 (%)

9.5 Others - Market size and forecast 2025-2030

Chart on Others - Market size and forecast 2025-2030 ($ million)
Data Table on Others - Market size and forecast 2025-2030 ($ million)
Chart on Others - Year-over-year growth 2025-2030 (%)
Data Table on Others - Year-over-year growth 2025-2030 (%)

9.6 Market opportunity by Material

Market opportunity by Material ($ million)
Data Table on Market opportunity by Material ($ million)

10. Market Segmentation by Product

10.1 Market segments

Chart on Product - Market share 2025-2030 (%)
Data Table on Product - Market share 2025-2030 (%)

10.2 Comparison by Product

Chart on Comparison by Product
Data Table on Comparison by Product

10.3 Flat - Market size and forecast 2025-2030

Chart on Flat - Market size and forecast 2025-2030 ($ million)
Data Table on Flat - Market size and forecast 2025-2030 ($ million)
Chart on Flat - Year-over-year growth 2025-2030 (%)
Data Table on Flat - Year-over-year growth 2025-2030 (%)

10.4 Special shape - Market size and forecast 2025-2030

Chart on Special shape - Market size and forecast 2025-2030 ($ million)
Data Table on Special shape - Market size and forecast 2025-2030 ($ million)
Chart on Special shape - Year-over-year growth 2025-2030 (%)
Data Table on Special shape - Year-over-year growth 2025-2030 (%)

10.5 Market opportunity by Product

Market opportunity by Product ($ million)
Data Table on Market opportunity by Product ($ million)

11. Customer Landscape

11.1 Customer landscape overview

Analysis of price sensitivity, lifecycle, customer purchase basket, adoption rates, and purchase criteria

12. Geographic Landscape

12.1 Geographic segmentation

Chart on Market share by geography 2025-2030 (%)
Data Table on Market share by geography 2025-2030 (%)

12.2 Geographic comparison

Chart on Geographic comparison
Data Table on Geographic comparison

12.3 APAC - Market size and forecast 2025-2030

Chart on APAC - Market size and forecast 2025-2030 ($ million)
Data Table on APAC - Market size and forecast 2025-2030 ($ million)
Chart on APAC - Year-over-year growth 2025-2030 (%)
Data Table on APAC - Year-over-year growth 2025-2030 (%)
Chart on Regional Comparison - APAC
Data Table on Regional Comparison - APAC

12.3.1 China - Market size and forecast 2025-2030

Chart on China - Market size and forecast 2025-2030 ($ million)
Data Table on China - Market size and forecast 2025-2030 ($ million)
Chart on China - Year-over-year growth 2025-2030 (%)
Data Table on China - Year-over-year growth 2025-2030 (%)

12.3.2 Japan - Market size and forecast 2025-2030

Chart on Japan - Market size and forecast 2025-2030 ($ million)
Data Table on Japan - Market size and forecast 2025-2030 ($ million)
Chart on Japan - Year-over-year growth 2025-2030 (%)
Data Table on Japan - Year-over-year growth 2025-2030 (%)

12.3.3 India - Market size and forecast 2025-2030

Chart on India - Market size and forecast 2025-2030 ($ million)
Data Table on India - Market size and forecast 2025-2030 ($ million)
Chart on India - Year-over-year growth 2025-2030 (%)
Data Table on India - Year-over-year growth 2025-2030 (%)

12.3.4 South Korea - Market size and forecast 2025-2030

Chart on South Korea - Market size and forecast 2025-2030 ($ million)
Data Table on South Korea - Market size and forecast 2025-2030 ($ million)
Chart on South Korea - Year-over-year growth 2025-2030 (%)
Data Table on South Korea - Year-over-year growth 2025-2030 (%)

12.3.5 Australia - Market size and forecast 2025-2030

Chart on Australia - Market size and forecast 2025-2030 ($ million)
Data Table on Australia - Market size and forecast 2025-2030 ($ million)
Chart on Australia - Year-over-year growth 2025-2030 (%)
Data Table on Australia - Year-over-year growth 2025-2030 (%)

12.3.6 Indonesia - Market size and forecast 2025-2030

Chart on Indonesia - Market size and forecast 2025-2030 ($ million)
Data Table on Indonesia - Market size and forecast 2025-2030 ($ million)
Chart on Indonesia - Year-over-year growth 2025-2030 (%)
Data Table on Indonesia - Year-over-year growth 2025-2030 (%)

12.4 North America - Market size and forecast 2025-2030

Chart on North America - Market size and forecast 2025-2030 ($ million)
Data Table on North America - Market size and forecast 2025-2030 ($ million)
Chart on North America - Year-over-year growth 2025-2030 (%)
Data Table on North America - Year-over-year growth 2025-2030 (%)
Chart on Regional Comparison - North America
Data Table on Regional Comparison - North America

12.4.1 US - Market size and forecast 2025-2030

Chart on US - Market size and forecast 2025-2030 ($ million)
Data Table on US - Market size and forecast 2025-2030 ($ million)
Chart on US - Year-over-year growth 2025-2030 (%)
Data Table on US - Year-over-year growth 2025-2030 (%)

12.4.2 Canada - Market size and forecast 2025-2030

Chart on Canada - Market size and forecast 2025-2030 ($ million)
Data Table on Canada - Market size and forecast 2025-2030 ($ million)
Chart on Canada - Year-over-year growth 2025-2030 (%)
Data Table on Canada - Year-over-year growth 2025-2030 (%)

12.4.3 Mexico - Market size and forecast 2025-2030

Chart on Mexico - Market size and forecast 2025-2030 ($ million)
Data Table on Mexico - Market size and forecast 2025-2030 ($ million)
Chart on Mexico - Year-over-year growth 2025-2030 (%)
Data Table on Mexico - Year-over-year growth 2025-2030 (%)

12.5 Europe - Market size and forecast 2025-2030

Chart on Europe - Market size and forecast 2025-2030 ($ million)
Data Table on Europe - Market size and forecast 2025-2030 ($ million)
Chart on Europe - Year-over-year growth 2025-2030 (%)
Data Table on Europe - Year-over-year growth 2025-2030 (%)
Chart on Regional Comparison - Europe
Data Table on Regional Comparison - Europe

12.5.1 Germany - Market size and forecast 2025-2030

Chart on Germany - Market size and forecast 2025-2030 ($ million)
Data Table on Germany - Market size and forecast 2025-2030 ($ million)
Chart on Germany - Year-over-year growth 2025-2030 (%)
Data Table on Germany - Year-over-year growth 2025-2030 (%)

12.5.2 UK - Market size and forecast 2025-2030

Chart on UK - Market size and forecast 2025-2030 ($ million)
Data Table on UK - Market size and forecast 2025-2030 ($ million)
Chart on UK - Year-over-year growth 2025-2030 (%)
Data Table on UK - Year-over-year growth 2025-2030 (%)

12.5.3 France - Market size and forecast 2025-2030

Chart on France - Market size and forecast 2025-2030 ($ million)
Data Table on France - Market size and forecast 2025-2030 ($ million)
Chart on France - Year-over-year growth 2025-2030 (%)
Data Table on France - Year-over-year growth 2025-2030 (%)

12.5.4 Italy - Market size and forecast 2025-2030

Chart on Italy - Market size and forecast 2025-2030 ($ million)
Data Table on Italy - Market size and forecast 2025-2030 ($ million)
Chart on Italy - Year-over-year growth 2025-2030 (%)
Data Table on Italy - Year-over-year growth 2025-2030 (%)

12.5.5 Spain - Market size and forecast 2025-2030

Chart on Spain - Market size and forecast 2025-2030 ($ million)
Data Table on Spain - Market size and forecast 2025-2030 ($ million)
Chart on Spain - Year-over-year growth 2025-2030 (%)
Data Table on Spain - Year-over-year growth 2025-2030 (%)

12.5.6 The Netherlands - Market size and forecast 2025-2030

Chart on The Netherlands - Market size and forecast 2025-2030 ($ million)
Data Table on The Netherlands - Market size and forecast 2025-2030 ($ million)
Chart on The Netherlands - Year-over-year growth 2025-2030 (%)
Data Table on The Netherlands - Year-over-year growth 2025-2030 (%)

12.6 South America - Market size and forecast 2025-2030

Chart on South America - Market size and forecast 2025-2030 ($ million)
Data Table on South America - Market size and forecast 2025-2030 ($ million)
Chart on South America - Year-over-year growth 2025-2030 (%)
Data Table on South America - Year-over-year growth 2025-2030 (%)
Chart on Regional Comparison - South America
Data Table on Regional Comparison - South America

12.6.1 Brazil - Market size and forecast 2025-2030

Chart on Brazil - Market size and forecast 2025-2030 ($ million)
Data Table on Brazil - Market size and forecast 2025-2030 ($ million)
Chart on Brazil - Year-over-year growth 2025-2030 (%)
Data Table on Brazil - Year-over-year growth 2025-2030 (%)

12.6.2 Argentina - Market size and forecast 2025-2030

Chart on Argentina - Market size and forecast 2025-2030 ($ million)
Data Table on Argentina - Market size and forecast 2025-2030 ($ million)
Chart on Argentina - Year-over-year growth 2025-2030 (%)
Data Table on Argentina - Year-over-year growth 2025-2030 (%)

12.6.3 Chile - Market size and forecast 2025-2030

Chart on Chile - Market size and forecast 2025-2030 ($ million)
Data Table on Chile - Market size and forecast 2025-2030 ($ million)
Chart on Chile - Year-over-year growth 2025-2030 (%)
Data Table on Chile - Year-over-year growth 2025-2030 (%)

12.7 Middle East and Africa - Market size and forecast 2025-2030

Chart on Middle East and Africa - Market size and forecast 2025-2030 ($ million)
Data Table on Middle East and Africa - Market size and forecast 2025-2030 ($ million)
Chart on Middle East and Africa - Year-over-year growth 2025-2030 (%)
Data Table on Middle East and Africa - Year-over-year growth 2025-2030 (%)
Chart on Regional Comparison - Middle East and Africa
Data Table on Regional Comparison - Middle East and Africa

12.7.1 Saudi Arabia - Market size and forecast 2025-2030

Chart on Saudi Arabia - Market size and forecast 2025-2030 ($ million)
Data Table on Saudi Arabia - Market size and forecast 2025-2030 ($ million)
Chart on Saudi Arabia - Year-over-year growth 2025-2030 (%)
Data Table on Saudi Arabia - Year-over-year growth 2025-2030 (%)

12.7.2 UAE - Market size and forecast 2025-2030

Chart on UAE - Market size and forecast 2025-2030 ($ million)
Data Table on UAE - Market size and forecast 2025-2030 ($ million)
Chart on UAE - Year-over-year growth 2025-2030 (%)
Data Table on UAE - Year-over-year growth 2025-2030 (%)

12.7.3 South Africa - Market size and forecast 2025-2030

Chart on South Africa - Market size and forecast 2025-2030 ($ million)
Data Table on South Africa - Market size and forecast 2025-2030 ($ million)
Chart on South Africa - Year-over-year growth 2025-2030 (%)
Data Table on South Africa - Year-over-year growth 2025-2030 (%)

12.7.4 Israel - Market size and forecast 2025-2030

Chart on Israel - Market size and forecast 2025-2030 ($ million)
Data Table on Israel - Market size and forecast 2025-2030 ($ million)
Chart on Israel - Year-over-year growth 2025-2030 (%)
Data Table on Israel - Year-over-year growth 2025-2030 (%)

12.7.5 Turkey - Market size and forecast 2025-2030

Chart on Turkey - Market size and forecast 2025-2030 ($ million)
Data Table on Turkey - Market size and forecast 2025-2030 ($ million)
Chart on Turkey - Year-over-year growth 2025-2030 (%)
Data Table on Turkey - Year-over-year growth 2025-2030 (%)

12.8 Market opportunity by geography

Market opportunity by geography ($ million)
Data Tables on Market opportunity by geography ($ million)

13. Drivers, Challenges, and Opportunity

13.1 Market drivers

Increased urbanization and investment in infrastructure development
Rising focus on energy efficiency and sustainable building materials
Increasing use of vacuum insulation panels in home appliances

13.2 Market challenges

Lack of efficient logistic support in emerging economies
Damage to vacuum envelope due to extreme environmental conditions
High costs restraining large scale acceptance of vacuum insulation panels

13.3 Impact of drivers and challenges

Impact of drivers and challenges in 2025 and 2030

13.4 Market opportunities

Integration of advanced core materials such as aerogel and polyurethane to improve thermal performance
Growing adoption of vacuum insulation panels for automated storage and retrieval
Rising demand for vacuum panels in emerging economies

14. Competitive Landscape

14.1 Overview

14.2

Overview on criticality of inputs and factors of differentiation

14.3 Landscape disruption

Overview on factors of disruption

14.4 Industry risks

Impact of key risks on business

15. Competitive Analysis

15.1 Companies profiled

Companies covered

15.2 Company ranking index

15.3 Market positioning of companies

Matrix on companies position and classification

15.4 Avery Dennison Corp.

Avery Dennison Corp. - Overview
Avery Dennison Corp. - Business segments
Avery Dennison Corp. - Key news
Avery Dennison Corp. - Key offerings
Avery Dennison Corp. - Segment focus
SWOT

15.5 BASF SE

BASF SE - Overview
BASF SE - Business segments
BASF SE - Key news
BASF SE - Key offerings
BASF SE - Segment focus
SWOT

15.6 Bridgestone Corp.

Bridgestone Corp. - Overview
Bridgestone Corp. - Business segments
Bridgestone Corp. - Key news
Bridgestone Corp. - Key offerings
Bridgestone Corp. - Segment focus
SWOT

15.7 Dow Chemical Co.

Dow Chemical Co. - Overview
Dow Chemical Co. - Business segments
Dow Chemical Co. - Key news
Dow Chemical Co. - Key offerings
Dow Chemical Co. - Segment focus
SWOT

15.8 Etex NV

Etex NV - Overview
Etex NV - Product / Service
Etex NV - Key offerings
SWOT

15.9 Evonik Industries AG

Evonik Industries AG - Overview
Evonik Industries AG - Business segments
Evonik Industries AG - Key news
Evonik Industries AG - Key offerings
Evonik Industries AG - Segment focus
SWOT

15.10 Kingspan Group

Kingspan Group - Overview
Kingspan Group - Product / Service
Kingspan Group - Key news
Kingspan Group - Key offerings
SWOT

15.11 Knauf Digital GmbH

Knauf Digital GmbH - Overview
Knauf Digital GmbH - Product / Service
Knauf Digital GmbH - Key offerings
SWOT

15.12 Morgan Advanced Materials

Morgan Advanced Materials - Overview
Morgan Advanced Materials - Business segments
Morgan Advanced Materials - Key news
Morgan Advanced Materials - Key offerings
Morgan Advanced Materials - Segment focus
SWOT

15.13 OCI Co. Ltd.

OCI Co. Ltd. - Overview
OCI Co. Ltd. - Business segments
OCI Co. Ltd. - Key offerings
OCI Co. Ltd. - Segment focus
SWOT

15.14 Panasonic Holdings Corp.

Panasonic Holdings Corp. - Overview
Panasonic Holdings Corp. - Business segments
Panasonic Holdings Corp. - Key news
Panasonic Holdings Corp. - Key offerings
Panasonic Holdings Corp. - Segment focus
SWOT

15.15 Sealed Air Corp.

Sealed Air Corp. - Overview
Sealed Air Corp. - Business segments
Sealed Air Corp. - Key news
Sealed Air Corp. - Key offerings
Sealed Air Corp. - Segment focus
SWOT

15.16 Siltherm

Siltherm - Overview
Siltherm - Product / Service
Siltherm - Key offerings
SWOT

15.17 Tiger Corp.

Tiger Corp. - Overview
Tiger Corp. - Product / Service
Tiger Corp. - Key offerings
SWOT

15.18 va Q tec AG

va Q tec AG - Overview
va Q tec AG - Product / Service
va Q tec AG - Key offerings
SWOT

16. Appendix

16.1 Scope of the report

Market definition
Objectives
Notes and caveats

16.2 Inclusions and exclusions checklist

Inclusions checklist
Exclusions checklist

16.3 Currency conversion rates for US$

16.4 Research methodology

16.5 Data procurement

Information sources

16.6 Data validation

16.7 Validation techniques employed for market sizing

16.8 Data synthesis

16.9 360 degree market analysis

16.10 List of abbreviations

Research Methodology

Technavio presents a detailed picture of the market by way of study, synthesis, and summation of data from multiple sources. The analysts have presented the various facets of the market with a particular focus on identifying the key industry influencers. The data thus presented is comprehensive, reliable, and the result of extensive research, both primary and secondary.

INFORMATION SOURCES

Primary sources

  • Manufacturers and suppliers
  • Channel partners
  • Industry experts
  • Strategic decision makers

Secondary sources

  • Industry journals and periodicals
  • Government data
  • Financial reports of key industry players
  • Historical data
  • Press releases

DATA ANALYSIS

Data Synthesis

  • Collation of data
  • Estimation of key figures
  • Analysis of derived insights

Data Validation

  • Triangulation with data models
  • Reference against proprietary databases
  • Corroboration with industry experts

REPORT WRITING

Qualitative

  • Market drivers
  • Market challenges
  • Market trends
  • Five forces analysis

Quantitative

  • Market size and forecast
  • Market segmentation
  • Geographical insights
  • Competitive landscape

Interested in this report?

Get your sample now to see our research methodology and insights!

Download Now

Frequently Asked Questions

Vacuum Insulation Panels market growth will increase by USD 2217.1 million during 2026-2030.

The Vacuum Insulation Panels market is expected to grow at a CAGR of 4.7% during 2026-2030.

Vacuum Insulation Panels market is segmented by End-user (Construction, Logistics, Cooling and freezing devices, Others) Material (Silica, Fiberglass, Others) Product (Flat, Special shape)

Avery Dennison Corp., BASF SE, Bridgestone Corp., Dow Chemical Co., Etex NV, Evonik Industries AG, Kingspan Group, Knauf Digital GmbH, Morgan Advanced Materials, OCI Co. Ltd., Panasonic Holdings Corp., Sealed Air Corp., Siltherm, Thermacor Process Inc., Tiger Corp., Turna d.o.o., va Q tec AG are a few of the key vendors in the Vacuum Insulation Panels market.

APAC will register the highest growth rate of 38.1% among the other regions. Therefore, the Vacuum Insulation Panels market in APAC is expected to garner significant business opportunities for the vendors during the forecast period.

China, Japan, India, South Korea, Australia, Indonesia, US, Canada, Mexico, Germany, UK, France, Italy, Spain, The Netherlands, Brazil, Argentina, Chile, Saudi Arabia, UAE, South Africa, Israel, Turkey

  • Increased urbanization and investment in infrastructure development is the driving factor this market.

The Vacuum Insulation Panels market vendors should focus on grabbing business opportunities from the End-user segment as it accounted for the largest market share in the base year.
RIA - Research AI Assistant
Ask RIA