Viral Vectors Market Analysis North America, Europe, Asia, Rest of World (ROW) - US, Canada, UK, China, Japan - Size and Forecast 2024-2028

Viral Vectors Market Analysis North America, Europe, Asia, Rest of World (ROW) - US, Canada, UK, China, Japan - Size and Forecast 2024-2028

Published: May 2024 166 Pages SKU: IRTNTR40121

Market Overview at a Glance

$1.12 B
Market Opportunity
7.02%
CAGR
5.49
YoY growth 2023-2024(%)

Viral Vectors Market Size 2024-2028

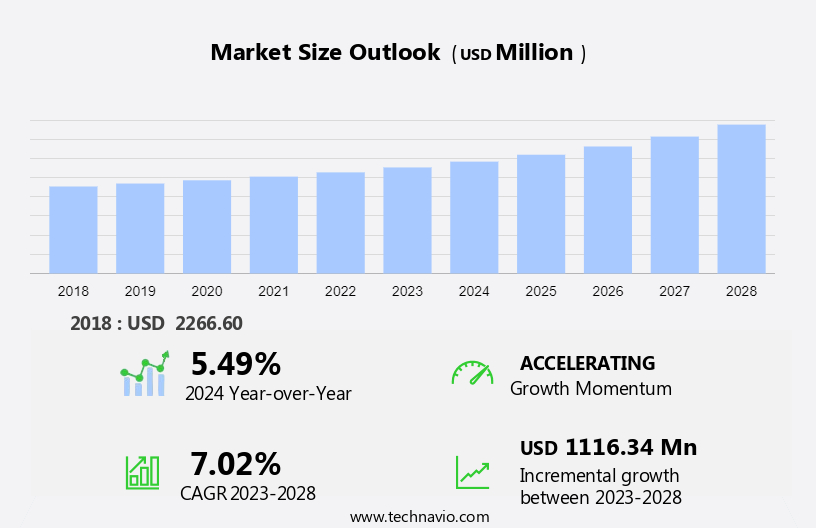
The global viral vectors market size is estimated to grow by USD 1.17 billion, at a CAGR of 7.02% between 2023 and 2028. The market growth and forecasting report also includes an in-depth analysis of drivers, trends, and challenges. Our report examines historical data from 2018-2022, besides analyzing the current market scenario.

Recent discoveries have improved the understanding of viral molecular biology and genetics, which has enabled the use of viruses as vaccine platforms and as potential agents for the treatment of cancer and infectious diseases, such as HIV. Viral vectors are considered a feasible option to deliver vaccine antigens and to specifically target and kill disease-causing agents due to their ability to effectively induce both humoral and cell-mediated immune responses. Recombinant viral vector vaccines have the potential to be used as therapeutic vaccines, as they enable an intracellular antigen expression and induce a strong cytotoxic T lymphocyte response, which results in the elimination of virus-infected cells. The advantages have led to an increase in their use in the development of vaccines. Thus, the increasing use of viral vectors for the development of vaccines to treat various diseases will drive the growth of the market during the forecast period.

What will be the size of the Market During the Forecast Period?

Viral Vectors Market Size

To learn more about this report, Download Report Sample

Segmentation by Application, End-user, and Geography Analysis

The market is experiencing rapid expansion driven by the surge in vaccine development and the growing demand for viral vector vaccines. As vaccine candidates progress through clinical and preclinical development, emphasis is placed on replication-deficient chimp adenovirus vector like ChAdOx1 and replication-incompetent human adenovirus vector for their efficacy. With increasing focus on treating genetic disorders and target diseases, funding for gene therapy development continues to rise, fueling innovations in viral vector manufacturing. The market is further bolstered by advancements in cell and gene therapy manufacturing and therapeutic genes, paving the way for novel therapeutic approaches and in vivo gene transfers.


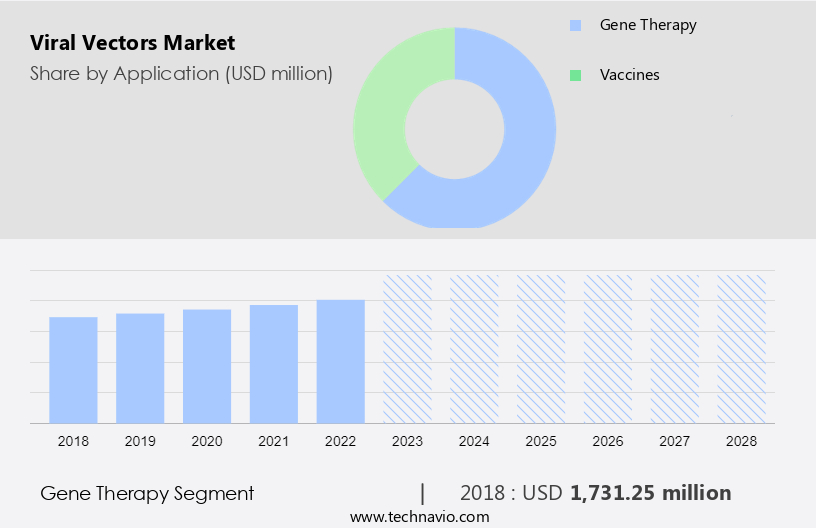
Application Analysis

The market share growth by the gene therapy segment will be significant during the forecast period. In recent years, viral vectors have emerged as potent tools in gene therapy, offering effective delivery mechanisms for treating various disorders. Adenovirus vectors, known for their broad host cell range and immunogenicity, show promise in cancer therapy, including oncolytic adenoviruses targeting pancreatic cancer.

Viral Vectors Market Size

Get a glance at the market contribution of various segments Download PDF Sample

The gene therapy segment was valued at USD 1.73 billion in 2018. Adeno-associated virus vectors, heralded for their low immunogenicity and integration capacity, are utilized in therapies like ZOLGENSMA for spinal muscular atrophy. Herpes simplex virus vectors exhibit efficacy in treating conditions like diabetic neuropathy. Retrovirus and lentivirus vectors enable long-term gene transfer, with lentiviral vector therapy like ZYNTEGLO proving effective for beta-thalassemia. Ongoing clinical trials, including those targeting Alzheimer's disease and HIV-1 infection, underscore the growing demand and potential of viral vector-based gene therapies, driving market growth.

End-user Analysis

The pharmaceutical and biotechnology companies segment will account for the largest share of this segment.?Pharmaceutical companies and biotechnology companies are exploring the use of viral vectors for genome therapy and cell therapy to develop personalized therapies tailored to individual patients' genetic profiles, with the aim of improving treatment outcomes and minimizing adverse effects. Furthermore, owing to the increasing prevalence of chronic diseases and rising disease burden globally, the development of efficient therapies such as gene therapy and personalized medicine is increasing. The US FDA stated that over 800 active investigational new drug applications were filed in the same year. Thus, the growing focus of pharmaceutical and biotechnology companies on the use of advanced therapies is driving the growth of the segment of the market during the forecast period.

The academic and research institutes segment is also showing steady growth. Academic institutes and research institutes are among the key users of viral vector products. Growing investments in genomic research and growing interest in editing the DNA of genes and the genome during basic and applied research, which is aimed at advancing the understanding of human stem cells, human cells and tissues, diseases, genetic pathways and gene expressions, and regenerative medicines, are driving the demand across the academic institutes and research laboratories segment. Further, growing investments and initiatives in basic and applied research activities that focus on improving the understanding of genetic connections between hereditary diseases and cancer are driving the use of viral vectors. Thus, such factors will drive market growth during the forecast period.
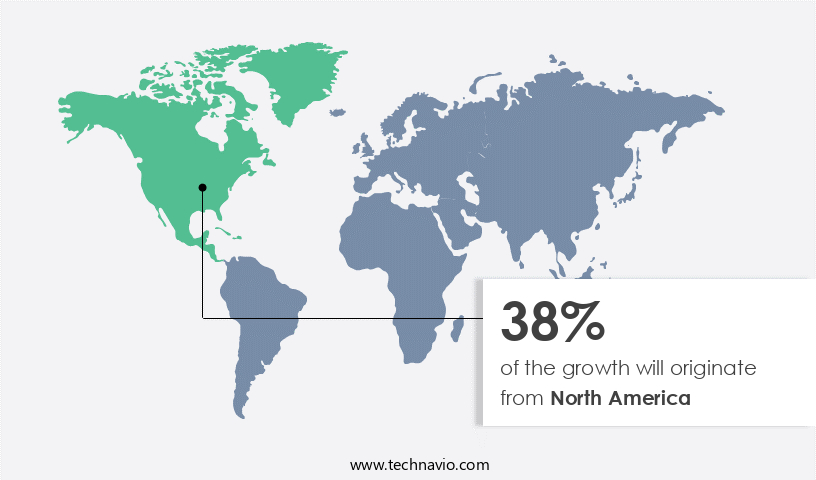
Regional Analysis

Viral Vectors Market Share by Geography

For more insights about the market share of various regions Download PDF Sample now!

North America is estimated to contribute 38% to the growth of the global market during the forecast period. Technavio’s analysts have elaborately explained the regional trends and drivers will shape the market during the forecast period. North America holds the largest share of the market, primarily due to the strong prevalence of infectious and non-infectious diseases and the increasing investments in developing gene therapies and vaccines in the region. The prevalence of diseases such as cancer, HIV, and genetic and inherited disorders has been increasing at a significant rate in developed countries in the region.

Further, market players have been leading to various developments, such as the expansion of manufacturing facilities and others. In October 2021, Merck announced the opening of its second Carlsbad, California-based facility, significantly expanding its global CDMO footprint. This new facility will more than double the companys existing capacity to support large-scale commercial and industrial manufacturing for viral gene therapy. Thus, the market in North America is expected to grow during the forecast period.

Buy Full Report Now

Key Market Players 

Companies are implementing various strategies, such as strategic alliances, partnerships, mergers and acquisitions, geographical expansion, and product/service launches, to enhance their presence in the market. The market forecasting report also includes detailed analyses of the competitive landscape of the market and information about 20 market companies, including:

  • Batavia Biosciences BV: The company offers viral vector tools such as SCOUT technology and SIDUS platform that combines our biological materials.

Bayer AG, Catalent Inc., Creative Biogene, Danaher Corp., F. Hoffmann La Roche Ltd., FinVector Oy, FUJIFILM Holdings Corp., Institut Merieux, Lonza Group Ltd., Merck KGaA, Novartis AG, Oxford Biomedica Plc, REGENXBIO Inc, Sirion Biotech GmbH, Syncona Ltd., Takara Holdings Inc., Thermo Fisher Scientific Inc., uniQure NV, and Virovek Inc

Qualitative and quantitative analysis of companies has been conducted to help clients understand the wider business environment as well as the strengths and weaknesses of key market players. Data is qualitatively analyzed to categorize companies as pure play, category-focused, industry-focused, and diversified; it is quantitatively analyzed to categorize companies as dominant, leading, strong, tentative, and weak.

Market Dynamics and Customer Landscape

The viral vector manufacturing market is witnessing exponential growth, driven by the escalating demand for doses of viral vectored vaccine worldwide. As a pivotal component in vaccine production, the Global viral vector manufacturing market is characterized by the quest for enhanced effectiveness of viral vectors and optimized dosage delivery. With a focus on eliciting robust immune response against a spectrum of target diseases and disorders, manufacturers are innovating to tailor vectors to specific target cell type. This market evolution is closely intertwined with advancements in cell and gene therapies, emphasizing clinical development, and expanding viral capacity. Additionally, the market is buoyed by the demand for supporting products such as monoclonal antibodies, assay kits, and vector amplification kits to streamline manufacturing processes. Our researchers analyzed the market research and growth data with 2023 as the base year, along with the key market growth analysis, trends, and challenges. A holistic analysis of drivers, trends, and challenges will help companies refine their marketing strategies to gain a competitive advantage. 

Key Market Drivers

Increasing use of viral vectors to develop gene therapies is the key factor driving the market. Researchers have found the application of viral vectors encouraging the development of gene therapies to treat and prevent life-threatening diseases in recent years. Significant improvements in vector engineering, delivery, and safety have increased the demand for vector-based therapies. Thus, viral vectors are extensively being used for the development of gene therapies. By addressing genetic disorders at their root, new technologies in the field of cell and gene therapy hold the potential to not only treat symptoms but also to cure diseases. By introducing healthy genes into human cells, adeno-associated viruses (AAVs) have the potential to treat patients with diseases that are currently incurable.

Moreover, the main groups of viral vectors applied for gene therapies include adenoviruses, herpes simplex, retroviruses, lentiviruses, and measles viruses. The most used viral vector in gene therapies is adenoviruses. Adenovirus vectors are considered to generate low pathogenicity and toxicity, and they provide long-term transgene expression through chromosomal integration. Hence, they are extensively used in gene therapies. Thus, increasing use of viral vectors to develop gene therapies is expected to drive the growth of the market during the forecast period.

Significant Market Trends

The rising number of M&A and collaborations is the primary trend shaping the market.  Established international market players, such as Thermo Fisher Scientific Inc. (Thermo Fisher Scientific), have been involved in major M&A and collaborations in the last few years. M&A and collaborations are expected to increase the shares of the vendors in the market. Companies also opt for M&A and collaborations as a business strategy to expand their product portfolios and strengthen their businesses. 

For instance, in December 2021, Thermo Fisher Scientific announced its completion of the acquisition of PPD Inc. The agreement aimed to increase Thermo Fisher Scientific's revenue through the services clinical development spectrum. The increasing number of M&A and collaboration activities for the development of gene therapies and vaccines are expected to drive the growth of the market during the forecast period.

Major Market Challenges

Risks associated with viral vectors is the major challenge that affects te market. The major concerns associated are the risks of an immune response, inflammation, off-target effects, and insertional mutagenesis. The immune response could limit the effectiveness of viral treatments. It can also result in the creation of antibodies that can prevent a second dosage of the same virus. Inflammation can result in death if an extremely high dosage of adenovirus is administered. Insertional mutagenesis is a major challenge associated with gene therapies.

Moreover, the risk of inserting a gene into a tumor suppressor gene or activating an oncogene is present in vectors that integrate into the unwanted locations of the genome, such as the retrovirus. Besides, discovering the appropriate virus to infect the desired cells is difficult, and there is a risk that the virus could cross the Weismann barrier and infect the germline cells. Furthermore, viruses are susceptible to genetic variations, and incorporation into undesirable sites such as regulatory and oncogenes will have undesirable results. The risk factors associated with viral vectors may limit their usage, which, in turn, can challenge market growth during the forecast period.

Buy Now Full Report

Key Market Customer Landscape

The market report includes the adoption lifecycle of the market, covering from the innovator’s stage to the laggard’s stage. It focuses on adoption rates in different regions based on penetration. Furthermore, the market forecast report also includes key purchase criteria and drivers of price sensitivity to help companies evaluate and develop their growth strategies.
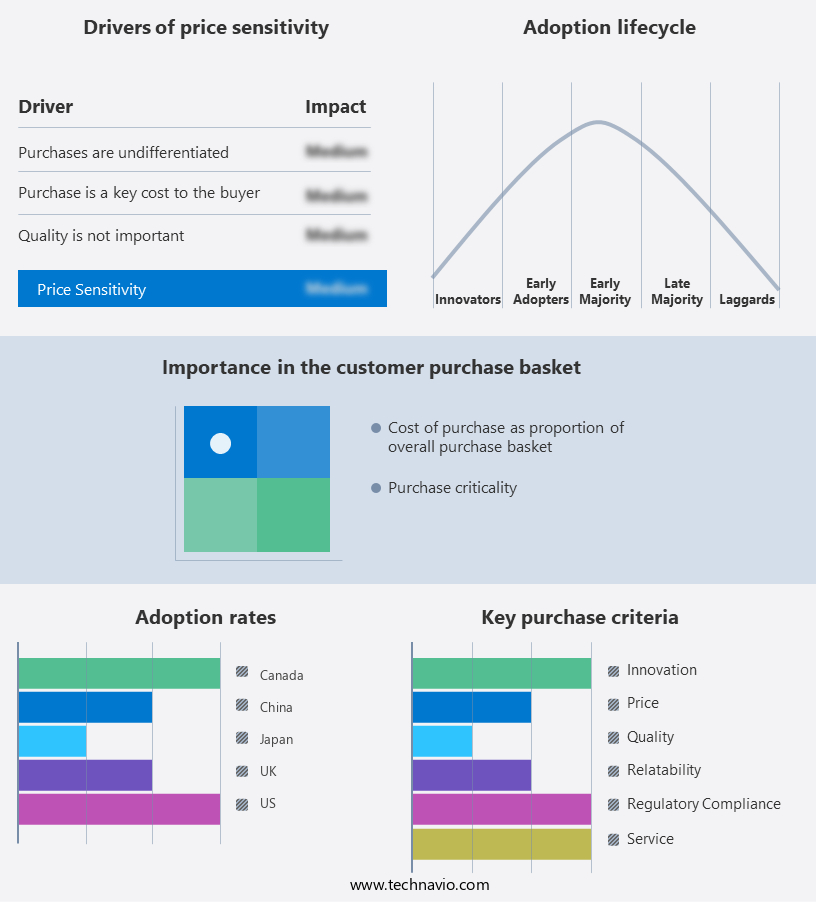
Viral Vectors Market Share by Geography

 Customer Landscape

Segment Overview

The market research report provides comprehensive data (region wise segment analysis), with forecasts and estimates in "USD Million" for the period 2024-2028, as well as historical data from 2018 - 2022 for the following segments.

  • Application Outlook
    • Gene therapy
    • Vaccines
  • End-user Outlook
    • Pharmaceutical and biotechnology companies
    • Academics and research institutes
  • Region Outlook
    • North America
      • The U.S.
      • Canada
    • Europe
      • U.K.
      • Germany
      • France
      • Rest of Europe
    • Asia
      • China
      • India
    • Rest of World (ROW)
      • Argentina
      • Australia
      • Brazil

Market Analyst Overview:

The market is undergoing profound transformation, fueled by advancements in clinical studies and drug delivery approaches for combating infectious and viral diseases. Innovations like self-amplifying messenger RNA vaccine and recombinant viral vectors are reshaping cancer management, offering promising avenues for treating various cancers including brain, skin, liver, colon, breast, and kidney cancer. Academic centers and oncology institutes are at the forefront of pioneering therapies like suicide gene therapy and oncolytic virotherapy, while anti-angiogenesis and therapeutic gene vaccines represent novel approaches in oncology. Radiology and Oncology sectors are leveraging advanced analytics-based models and augmented reality to enhance cancer therapeutics development. As the demand for effective therapeutics grows, the market continues to evolve with the integration of digital tools and virtual reality in medical product approval procedures and genotoxicity testing.

Further, the market is at the forefront of revolutionizing cancer treatment, offering targeted therapies for brain cancer, skin cancer, liver cancer, colon cancer, breast cancer, and non-small cell lung cancer. Therapeutic cancer vaccine and novel drugs delivered through advanced drug delivery option hold promise in combating these malignancies. Tailored recombinant proteins and viral vectors, considering tropism and type of virus, are essential in designing effective treatments. With the aid of cell lines, test models, and purification kits, manufacturers ensure quality and potency in viral vector production. Additionally, outsourcing drug discovery services streamline research efforts, accelerating medical product approval procedure. The integration of augmented and virtual reality tools enhances efficiency in life sciences research, propelling advancements in cancer therapeutics.

Market Scope

Report Coverage

Details

Page number

166

Base year

2023

Historic period

2018-2022

Forecast period

2024-2028

Growth momentum & CAGR

Accelerate at a CAGR of 7.02%

Market Growth 2024-2028

USD 1.17 billion

Market structure

Fragmented

YoY growth 2023-2024(%)

5.49

Regional analysis

North America, Europe, Asia, and Rest of World (ROW)

Performing market contribution

North America at 38%

Key countries

US, Canada, UK, China, and Japan

Competitive landscape

Leading companies, Market Positioning of companies, Competitive Strategies, and Industry Risks

Key companies profiled

Batavia Biosciences BV, Bayer AG, Catalent Inc., Creative Biogene, Danaher Corp., F. Hoffmann La Roche Ltd., FinVector Oy, FUJIFILM Holdings Corp., Institut Merieux, Lonza Group Ltd., Merck KGaA, Novartis AG, Oxford Biomedica Plc, REGENXBIO Inc, Sirion Biotech GmbH, Syncona Ltd., Takara Holdings Inc., Thermo Fisher Scientific Inc., uniQure NV, and Virovek Inc

Market dynamics

Parent market analysis, Market growth inducers and obstacles, Fast-growing and slow-growing segment analysis, COVID-19 impact and recovery analysis and future consumer dynamics, and market condition analysis for the forecast period.

Customization purview

If our report has not included the data that you are looking for, you can reach out to our analysts and get segments customized.

Download Sample PDF at your Fingertips

What are the Key Data Covered in this Market Research Report?

  • CAGR of the market during the forecast period
  • Detailed information on factors that will drive the growth of the between 2024 and 2028
  • Precise estimation of the size and its contribution to the market in focus on the parent market
  • Detailed analysis of customer landscape covering Diver of price sensitivity, Adoption of the lifecycle, and key purchase criteria 
  • Companies landscape comparing criticality of inputs and factors of differentiation
  • Exclusive Matrix on companies' position and classification
  • Accurate predictions about upcoming trends and changes in consumer behavior
  • Growth of the market across North America, Europe, Asia, and Rest of World (ROW)
  • A thorough analysis of the market’s competitive landscape and detailed information about companies
  • Comprehensive analysis of factors that will challenge the growth of companies

We can help! Our analysts can customize this market research report to meet your requirements. Get in touch

1 Executive Summary

  • 1.1 Market overview
    • Exhibit 01: Executive Summary – Chart on Market Overview
    • Exhibit 02: Executive Summary – Data Table on Market Overview
    • Exhibit 03: Executive Summary – Chart on Global Market Characteristics
    • Exhibit 04: Executive Summary – Chart on Market by Geography
    • Exhibit 05: Executive Summary – Chart on Market Segmentation by Application
    • Exhibit 06: Executive Summary – Chart on Market Segmentation by End-user
    • Exhibit 07: Executive Summary – Chart on Incremental Growth
    • Exhibit 08: Executive Summary – Data Table on Incremental Growth
    • Exhibit 09: Executive Summary – Chart on Vendor Market Positioning

2 Market Landscape

  • 2.1 Market ecosystem
    • Exhibit 10: Parent market
    • Exhibit 11: Market Characteristics

3 Market Sizing

  • 3.1 Market definition
    • Exhibit 12: Offerings of vendors included in the market definition
  • 3.2 Market segment analysis
    • Exhibit 13: Market segments
  • 3.3 Market size 2023
    • 3.4 Market outlook: Forecast for 2023-2028
      • Exhibit 14: Chart on Global - Market size and forecast 2023-2028 ($ million)
      • Exhibit 15: Data Table on Global - Market size and forecast 2023-2028 ($ million)
      • Exhibit 16: Chart on Global Market: Year-over-year growth 2023-2028 (%)
      • Exhibit 17: Data Table on Global Market: Year-over-year growth 2023-2028 (%)

    4 Historic Market Size

    • 4.1 Global viral vectors market 2018 - 2022
      • Exhibit 18: Historic Market Size – Data Table on global viral vectors market 2018 - 2022 ($ million)
    • 4.2 Application Segment Analysis 2018 - 2022
      • Exhibit 19: Historic Market Size – Application Segment 2018 - 2022 ($ million)
    • 4.3 End-User Segment Analysis 2018 - 2022
      • Exhibit 20: Historic Market Size – End-User Segment 2018 - 2022 ($ million)
    • 4.4 Region Segment Analysis 2018 - 2022
      • Exhibit 21: Historic Market Size – Region Segment 2018 - 2022 ($ million)
    • 4.5 Country Segment Analysis 2018 - 2022
      • Exhibit 22: Historic Market Size – Country Segment 2018 - 2022 ($ million)

    5 Five Forces Analysis

    • 5.1 Five forces summary
      • Exhibit 23: Five forces analysis - Comparison between 2023 and 2028
    • 5.2 Bargaining power of buyers
      • Exhibit 24: Chart on Bargaining power of buyers – Impact of key factors 2023 and 2028
    • 5.3 Bargaining power of suppliers
      • Exhibit 25: Bargaining power of suppliers – Impact of key factors in 2023 and 2028
    • 5.4 Threat of new entrants
      • Exhibit 26: Threat of new entrants – Impact of key factors in 2023 and 2028
    • 5.5 Threat of substitutes
      • Exhibit 27: Threat of substitutes – Impact of key factors in 2023 and 2028
    • 5.6 Threat of rivalry
      • Exhibit 28: Threat of rivalry – Impact of key factors in 2023 and 2028
    • 5.7 Market condition
      • Exhibit 29: Chart on Market condition - Five forces 2023 and 2028

    6 Market Segmentation by Application

    • 6.1 Market segments
      • Exhibit 30: Chart on Application - Market share 2023-2028 (%)
      • Exhibit 31: Data Table on Application - Market share 2023-2028 (%)
    • 6.2 Comparison by Application
      • Exhibit 32: Chart on Comparison by Application
      • Exhibit 33: Data Table on Comparison by Application
    • 6.3 Gene therapy - Market size and forecast 2023-2028
      • Exhibit 34: Chart on Gene therapy - Market size and forecast 2023-2028 ($ million)
      • Exhibit 35: Data Table on Gene therapy - Market size and forecast 2023-2028 ($ million)
      • Exhibit 36: Chart on Gene therapy - Year-over-year growth 2023-2028 (%)
      • Exhibit 37: Data Table on Gene therapy - Year-over-year growth 2023-2028 (%)
    • 6.4 Vaccines - Market size and forecast 2023-2028
      • Exhibit 38: Chart on Vaccines - Market size and forecast 2023-2028 ($ million)
      • Exhibit 39: Data Table on Vaccines - Market size and forecast 2023-2028 ($ million)
      • Exhibit 40: Chart on Vaccines - Year-over-year growth 2023-2028 (%)
      • Exhibit 41: Data Table on Vaccines - Year-over-year growth 2023-2028 (%)
    • 6.5 Market opportunity by Application
      • Exhibit 42: Market opportunity by Application ($ million)
      • Exhibit 43: Data Table on Market opportunity by Application ($ million)

    7 Market Segmentation by End-user

    • 7.1 Market segments
      • Exhibit 44: Chart on End-user - Market share 2023-2028 (%)
      • Exhibit 45: Data Table on End-user - Market share 2023-2028 (%)
    • 7.2 Comparison by End-user
      • Exhibit 46: Chart on Comparison by End-user
      • Exhibit 47: Data Table on Comparison by End-user
    • 7.3 Pharmaceutical and biotechnology companies - Market size and forecast 2023-2028
      • Exhibit 48: Chart on Pharmaceutical and biotechnology companies - Market size and forecast 2023-2028 ($ million)
      • Exhibit 49: Data Table on Pharmaceutical and biotechnology companies - Market size and forecast 2023-2028 ($ million)
      • Exhibit 50: Chart on Pharmaceutical and biotechnology companies - Year-over-year growth 2023-2028 (%)
      • Exhibit 51: Data Table on Pharmaceutical and biotechnology companies - Year-over-year growth 2023-2028 (%)
    • 7.4 Academics and research institutes - Market size and forecast 2023-2028
      • Exhibit 52: Chart on Academics and research institutes - Market size and forecast 2023-2028 ($ million)
      • Exhibit 53: Data Table on Academics and research institutes - Market size and forecast 2023-2028 ($ million)
      • Exhibit 54: Chart on Academics and research institutes - Year-over-year growth 2023-2028 (%)
      • Exhibit 55: Data Table on Academics and research institutes - Year-over-year growth 2023-2028 (%)
    • 7.5 Market opportunity by End-user
      • Exhibit 56: Market opportunity by End-user ($ million)
      • Exhibit 57: Data Table on Market opportunity by End-user ($ million)

    8 Customer Landscape

    • 8.1 Customer landscape overview
      • Exhibit 58: Analysis of price sensitivity, lifecycle, customer purchase basket, adoption rates, and purchase criteria

    9 Geographic Landscape

    • 9.1 Geographic segmentation
      • Exhibit 59: Chart on Market share by geography 2023-2028 (%)
      • Exhibit 60: Data Table on Market share by geography 2023-2028 (%)
    • 9.2 Geographic comparison
      • Exhibit 61: Chart on Geographic comparison
      • Exhibit 62: Data Table on Geographic comparison
    • 9.3 North America - Market size and forecast 2023-2028
      • Exhibit 63: Chart on North America - Market size and forecast 2023-2028 ($ million)
      • Exhibit 64: Data Table on North America - Market size and forecast 2023-2028 ($ million)
      • Exhibit 65: Chart on North America - Year-over-year growth 2023-2028 (%)
      • Exhibit 66: Data Table on North America - Year-over-year growth 2023-2028 (%)
    • 9.4 Europe - Market size and forecast 2023-2028
      • Exhibit 67: Chart on Europe - Market size and forecast 2023-2028 ($ million)
      • Exhibit 68: Data Table on Europe - Market size and forecast 2023-2028 ($ million)
      • Exhibit 69: Chart on Europe - Year-over-year growth 2023-2028 (%)
      • Exhibit 70: Data Table on Europe - Year-over-year growth 2023-2028 (%)
    • 9.5 Asia - Market size and forecast 2023-2028
      • Exhibit 71: Chart on Asia - Market size and forecast 2023-2028 ($ million)
      • Exhibit 72: Data Table on Asia - Market size and forecast 2023-2028 ($ million)
      • Exhibit 73: Chart on Asia - Year-over-year growth 2023-2028 (%)
      • Exhibit 74: Data Table on Asia - Year-over-year growth 2023-2028 (%)
    • 9.6 Rest of World (ROW) - Market size and forecast 2023-2028
      • Exhibit 75: Chart on Rest of World (ROW) - Market size and forecast 2023-2028 ($ million)
      • Exhibit 76: Data Table on Rest of World (ROW) - Market size and forecast 2023-2028 ($ million)
      • Exhibit 77: Chart on Rest of World (ROW) - Year-over-year growth 2023-2028 (%)
      • Exhibit 78: Data Table on Rest of World (ROW) - Year-over-year growth 2023-2028 (%)
    • 9.7 US - Market size and forecast 2023-2028
      • Exhibit 79: Chart on US - Market size and forecast 2023-2028 ($ million)
      • Exhibit 80: Data Table on US - Market size and forecast 2023-2028 ($ million)
      • Exhibit 81: Chart on US - Year-over-year growth 2023-2028 (%)
      • Exhibit 82: Data Table on US - Year-over-year growth 2023-2028 (%)
    • 9.8 UK - Market size and forecast 2023-2028
      • Exhibit 83: Chart on UK - Market size and forecast 2023-2028 ($ million)
      • Exhibit 84: Data Table on UK - Market size and forecast 2023-2028 ($ million)
      • Exhibit 85: Chart on UK - Year-over-year growth 2023-2028 (%)
      • Exhibit 86: Data Table on UK - Year-over-year growth 2023-2028 (%)
    • 9.9 China - Market size and forecast 2023-2028
      • Exhibit 87: Chart on China - Market size and forecast 2023-2028 ($ million)
      • Exhibit 88: Data Table on China - Market size and forecast 2023-2028 ($ million)
      • Exhibit 89: Chart on China - Year-over-year growth 2023-2028 (%)
      • Exhibit 90: Data Table on China - Year-over-year growth 2023-2028 (%)
    • 9.10 Canada - Market size and forecast 2023-2028
      • Exhibit 91: Chart on Canada - Market size and forecast 2023-2028 ($ million)
      • Exhibit 92: Data Table on Canada - Market size and forecast 2023-2028 ($ million)
      • Exhibit 93: Chart on Canada - Year-over-year growth 2023-2028 (%)
      • Exhibit 94: Data Table on Canada - Year-over-year growth 2023-2028 (%)
    • 9.11 Japan - Market size and forecast 2023-2028
      • Exhibit 95: Chart on Japan - Market size and forecast 2023-2028 ($ million)
      • Exhibit 96: Data Table on Japan - Market size and forecast 2023-2028 ($ million)
      • Exhibit 97: Chart on Japan - Year-over-year growth 2023-2028 (%)
      • Exhibit 98: Data Table on Japan - Year-over-year growth 2023-2028 (%)
    • 9.12 Market opportunity by geography
      • Exhibit 99: Market opportunity by geography ($ million)
      • Exhibit 100: Data Tables on Market opportunity by geography ($ million)

    10 Drivers, Challenges, and Trends

    • 10.1 Market drivers
      • 10.2 Market challenges
        • 10.3 Impact of drivers and challenges
          • Exhibit 101: Impact of drivers and challenges in 2023 and 2028
        • 10.4 Market trends

          11 Vendor Landscape

          • 11.1 Overview
            • 11.2 Vendor landscape
              • Exhibit 102: Overview on Criticality of inputs and Factors of differentiation
            • 11.3 Landscape disruption
              • Exhibit 103: Overview on factors of disruption
            • 11.4 Industry risks
              • Exhibit 104: Impact of key risks on business

            12 Vendor Analysis

            • 12.1 Vendors covered
              • Exhibit 105: Vendors covered
            • 12.2 Market positioning of vendors
              • Exhibit 106: Matrix on vendor position and classification
            • 12.3 Batavia Biosciences BV
              • Exhibit 107: Batavia Biosciences BV - Overview
              • Exhibit 108: Batavia Biosciences BV - Product / Service
              • Exhibit 109: Batavia Biosciences BV - Key news
              • Exhibit 110: Batavia Biosciences BV - Key offerings
            • 12.4 Bayer AG
              • Exhibit 111: Bayer AG - Overview
              • Exhibit 112: Bayer AG - Business segments
              • Exhibit 113: Bayer AG - Key news
              • Exhibit 114: Bayer AG - Key offerings
              • Exhibit 115: Bayer AG - Segment focus
            • 12.5 Creative Biogene
              • Exhibit 116: Creative Biogene - Overview
              • Exhibit 117: Creative Biogene - Product / Service
              • Exhibit 118: Creative Biogene - Key offerings
            • 12.6 Danaher Corp.
              • Exhibit 119: Danaher Corp. - Overview
              • Exhibit 120: Danaher Corp. - Business segments
              • Exhibit 121: Danaher Corp. - Key news
              • Exhibit 122: Danaher Corp. - Key offerings
              • Exhibit 123: Danaher Corp. - Segment focus
            • 12.7 F. Hoffmann La Roche Ltd.
              • Exhibit 124: F. Hoffmann La Roche Ltd. - Overview
              • Exhibit 125: F. Hoffmann La Roche Ltd. - Business segments
              • Exhibit 126: F. Hoffmann La Roche Ltd. - Key offerings
              • Exhibit 127: F. Hoffmann La Roche Ltd. - Segment focus
            • 12.8 FinVector Oy
              • Exhibit 128: FinVector Oy - Overview
              • Exhibit 129: FinVector Oy - Product / Service
              • Exhibit 130: FinVector Oy - Key offerings
            • 12.9 FUJIFILM Holdings Corp.
              • Exhibit 131: FUJIFILM Holdings Corp. - Overview
              • Exhibit 132: FUJIFILM Holdings Corp. - Business segments
              • Exhibit 133: FUJIFILM Holdings Corp. - Key offerings
              • Exhibit 134: FUJIFILM Holdings Corp. - Segment focus
            • 12.10 Institut Merieux
              • Exhibit 135: Institut Merieux - Overview
              • Exhibit 136: Institut Merieux - Product / Service
              • Exhibit 137: Institut Merieux - Key offerings
            • 12.11 Lonza Group Ltd.
              • Exhibit 138: Lonza Group Ltd. - Overview
              • Exhibit 139: Lonza Group Ltd. - Business segments
              • Exhibit 140: Lonza Group Ltd. - Key news
              • Exhibit 141: Lonza Group Ltd. - Key offerings
              • Exhibit 142: Lonza Group Ltd. - Segment focus
            • 12.12 Merck KGaA
              • Exhibit 143: Merck KGaA - Overview
              • Exhibit 144: Merck KGaA - Business segments
              • Exhibit 145: Merck KGaA - Key news
              • Exhibit 146: Merck KGaA - Key offerings
              • Exhibit 147: Merck KGaA - Segment focus
            • 12.13 Oxford Biomedica Plc
              • Exhibit 148: Oxford Biomedica Plc - Overview
              • Exhibit 149: Oxford Biomedica Plc - Business segments
              • Exhibit 150: Oxford Biomedica Plc - Key offerings
              • Exhibit 151: Oxford Biomedica Plc - Segment focus
            • 12.14 REGENXBIO Inc
              • Exhibit 152: REGENXBIO Inc - Overview
              • Exhibit 153: REGENXBIO Inc - Product / Service
              • Exhibit 154: REGENXBIO Inc - Key offerings
            • 12.15 Sirion Biotech GmbH
              • Exhibit 155: Sirion Biotech GmbH - Overview
              • Exhibit 156: Sirion Biotech GmbH - Product / Service
              • Exhibit 157: Sirion Biotech GmbH - Key offerings
            • 12.16 Thermo Fisher Scientific Inc.
              • Exhibit 158: Thermo Fisher Scientific Inc. - Overview
              • Exhibit 159: Thermo Fisher Scientific Inc. - Business segments
              • Exhibit 160: Thermo Fisher Scientific Inc. - Key news
              • Exhibit 161: Thermo Fisher Scientific Inc. - Key offerings
              • Exhibit 162: Thermo Fisher Scientific Inc. - Segment focus
            • 12.17 uniQure NV
              • Exhibit 163: uniQure NV - Overview
              • Exhibit 164: uniQure NV - Product / Service
              • Exhibit 165: uniQure NV - Key offerings

            13 Appendix

            • 13.1 Scope of the report
              • 13.2 Inclusions and exclusions checklist
                • Exhibit 166: Inclusions checklist
                • Exhibit 167: Exclusions checklist
              • 13.3 Currency conversion rates for US$
                • Exhibit 168: Currency conversion rates for US$
              • 13.4 Research methodology
                • Exhibit 169: Research methodology
                • Exhibit 170: Validation techniques employed for market sizing
                • Exhibit 171: Information sources
              • 13.5 List of abbreviations
                • Exhibit 172: List of abbreviations

              Research Methodology

              Technavio presents a detailed picture of the market by way of study, synthesis, and summation of data from multiple sources. The analysts have presented the various facets of the market with a particular focus on identifying the key industry influencers. The data thus presented is comprehensive, reliable, and the result of extensive research, both primary and secondary.

              INFORMATION SOURCES

              Primary sources

              • Manufacturers and suppliers
              • Channel partners
              • Industry experts
              • Strategic decision makers

              Secondary sources

              • Industry journals and periodicals
              • Government data
              • Financial reports of key industry players
              • Historical data
              • Press releases

              DATA ANALYSIS

              Data Synthesis

              • Collation of data
              • Estimation of key figures
              • Analysis of derived insights

              Data Validation

              • Triangulation with data models
              • Reference against proprietary databases
              • Corroboration with industry experts

              REPORT WRITING

              Qualitative

              • Market drivers
              • Market challenges
              • Market trends
              • Five forces analysis

              Quantitative

              • Market size and forecast
              • Market segmentation
              • Geographical insights
              • Competitive landscape

              Interested in this report?

              Get your sample now to see our research methodology and insights!

              Download Now

              Frequently Asked Questions

              Viral Vectors market growth will increase by $ 1116.34 mn during 2024-2028 .

              The Viral Vectors market is expected to grow at a CAGR of 7.02% during 2024-2028 .

              Viral Vectors market is segmented by Application( Gene therapy, Vaccines) End-user( Pharmaceutical and biotechnology companies, Academics and research institutes, Academics, research institutes)

              Batavia Biosciences BV, Bayer AG, Catalent Inc., Creative Biogene, Danaher Corp., F. Hoffmann La Roche Ltd., FinVector Oy, FUJIFILM Holdings Corp., Institut Merieux, Lonza Group Ltd., Merck KGaA, Novartis AG, Oxford Biomedica Plc, REGENXBIO Inc, Sirion Biotech GmbH, Syncona Ltd., Takara Holdings Inc., Thermo Fisher Scientific Inc., uniQure NV, Virovek Inc are a few of the key vendors in the Viral Vectors market.

              North America will register the highest growth rate of 38% among the other regions. Therefore, the Viral Vectors market in North America is expected to garner significant business opportunities for the vendors during the forecast period.

              US, Canada, UK, China, Japan

              • Rising prevalence of chronic diseasesDespite advances in treatment options is the driving factor this market.
              • the prevalence and incidence of several life-threatening diseases are rising. Diseases such as cancer is the driving factor this market.
              • heart disease is the driving factor this market.
              • hemophilia A is the driving factor this market.
              • diabetes is the driving factor this market.
              • and HIV do not have a cure. The rising prevalence and incidence of such diseases are increasing the need for the development of therapies using viral vectors. According to the CDC is the driving factor this market.
              • in 2020 is the driving factor this market.
              • 602 is the driving factor this market.
              • 350 deaths from cancer were reported. According to the NIH is the driving factor this market.
              • in the US is the driving factor this market.
              • the number of new cancer cases was 1 is the driving factor this market.
              • 806 is the driving factor this market.
              • 590 in the same year. The most common cancers in the US were lung and bronchus cancer is the driving factor this market.
              • breast cancer is the driving factor this market.
              • prostate cancer is the driving factor this market.
              • melanoma of the skin is the driving factor this market.
              • colon and rectum cancer is the driving factor this market.
              • bladder cancer is the driving factor this market.
              • non-Hodgkins lymphoma is the driving factor this market.
              • kidney and renal pelvis cancer is the driving factor this market.
              • endometrial cancer is the driving factor this market.
              • leukemia is the driving factor this market.
              • pancreatic cancer is the driving factor this market.
              • thyroid cancer is the driving factor this market.
              • and liver cancer. In the European Union (EU) is the driving factor this market.
              • the prevalence of cancer is high. The incidence of HIV is high across the world. The incidence of the disease has been rising significantly in developed countries such as Ireland is the driving factor this market.
              • Switzerland is the driving factor this market.
              • Norway is the driving factor this market.
              • and Germany. According to the CDC is the driving factor this market.
              • in 2020 is the driving factor this market.
              • an estimated 1.1 million adults and adolescents were living with HIV in the US. In 2020 is the driving factor this market.
              • in the US is the driving factor this market.
              • 30 is the driving factor this market.
              • 635 individuals who were diagnosed with HIV died. According to the European Centre for Disease Prevention and Control (ECDC) is the driving factor this market.
              • in 2020 is the driving factor this market.
              • in Europe is the driving factor this market.
              • 560 is the driving factor this market.
              • 000 people in the EU and the European Economic Area (EEA) were diagnosed with HIV. The incidence of genetic diseases such as hemophilia A is also high. According to the CDC is the driving factor this market.
              • every year is the driving factor this market.
              • hemophilia A affects 1 out of every 5 is the driving factor this market.
              • 000 men is the driving factor this market.
              • and approximately 400 newborns are born with hemophilia A. The rising prevalence and incidence of such diseases have encouraged vendors to develop curative therapies using viral vectors. Hence is the driving factor this market.
              • the rising prevalence and incidence of such diseases are expected to drive the growth of the global viral vectors market during the forecast period. is the driving factor this market.

              The Viral Vectors market vendors should focus on grabbing business opportunities from the Gene therapy segment as it accounted for the largest market share in the base year.