Wall Art Market Analysis, Size, and Forecast 2026-2030: APAC (China, Japan, and India), North America (US, Canada, and Mexico), Europe (Germany, UK, and France), Middle East and Africa (UAE, Saudi Arabia, and South Africa), South America (Brazil, Argentina, and Colombia), and Rest of World (ROW)

Wall Art Market Analysis, Size, and Forecast 2026-2030:
APAC (China, Japan, and India), North America (US, Canada, and Mexico), Europe (Germany, UK, and France), Middle East and Africa (UAE, Saudi Arabia, and South Africa), South America (Brazil, Argentina, and Colombia), and Rest of World (ROW)

Published: May 2026 289 Pages SKU: IRTNTR81462

Market Overview at a Glance

$38.47 B
Market Opportunity
10.5%
CAGR 2025 - 2030
49.1%
APAC Growth
$23.29 B
Canvas segment 2024

Wall Art Market Size 2026-2030

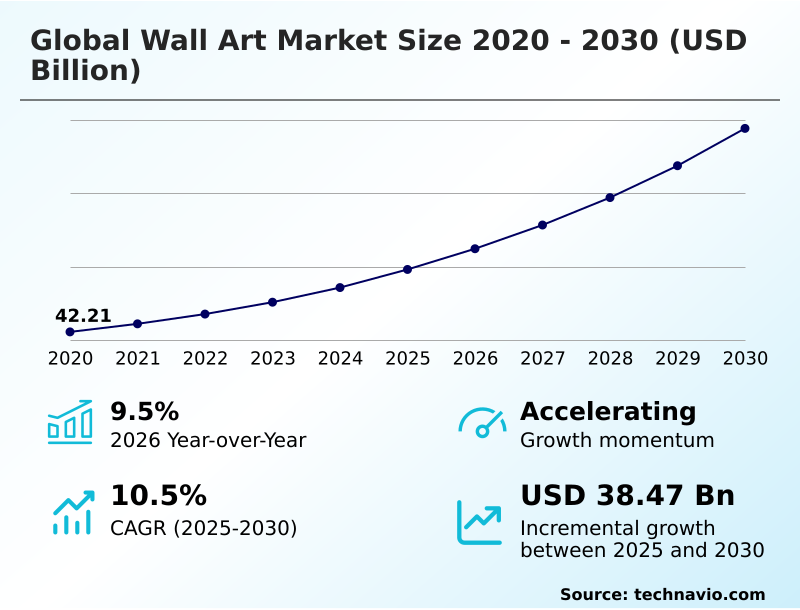
The wall art market size is valued to increase by USD 38.47 billion, at a CAGR of 10.5% from 2025 to 2030. Escalating investments in residential real estate and interior renovation projects. will drive the wall art market.

Major Market Trends & Insights

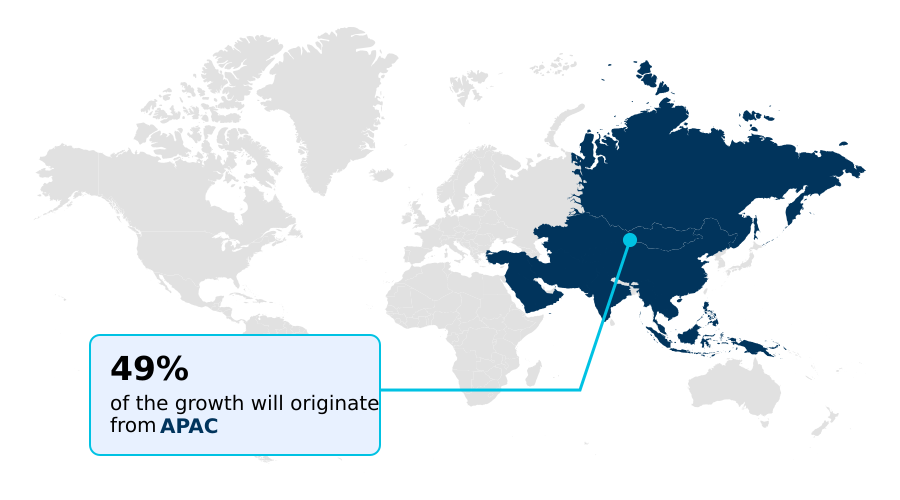
  • APAC dominated the market and accounted for a 49.1% growth during the forecast period.
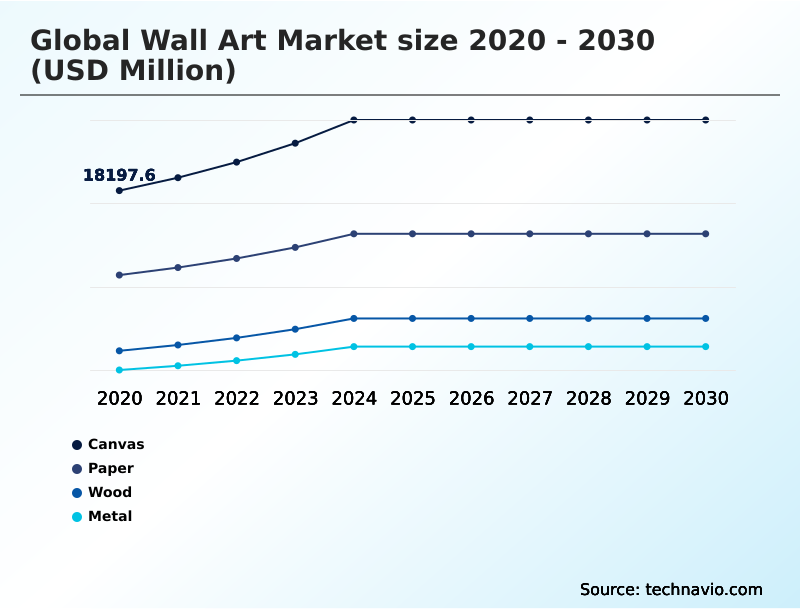
  • By Material - Canvas segment was valued at USD 23.29 billion in 2024
  • By End-user - Residential segment accounted for the largest market revenue share in 2024

Market Size & Forecast

  • Market Opportunities: USD 55.50 billion
  • Market Future Opportunities: USD 38.47 billion
  • CAGR from 2025 to 2030 : 10.5%

Market Summary

  • The wall art market is experiencing dynamic shifts driven by technological advancements and evolving consumer behaviors. The rise of e-commerce and specialized online art marketplaces has democratized access to art, allowing consumers to source everything from mass-produced prints to bespoke art commissions directly from creators worldwide.
  • This digital transformation is fueled by technologies like augmented reality visualization, which allows buyers to preview art in their own space, increasing purchase confidence. A key trend is the growing demand for personalization, supported by print-on-demand services that facilitate customized photo-to-canvas creations.
  • Concurrently, sustainability is a major focus, with a clear shift towards sustainable material compositions such as upcycled wood and non-toxic pigments. In the commercial sector, a hospitality firm might leverage commercial art procurement strategies, using evidence-based design principles to select biophilic design themes that enhance guest well-being, while ensuring all pieces, created using techniques like giclee printing, are ethically sourced.
  • However, the industry grapples with challenges like IP protection, necessitating tools like digital watermarking to protect artists' work in a digital-first environment. The market's future will be shaped by the interplay of aesthetic trends, technological innovation, and ethical production.

What will be the Size of the Wall Art Market during the forecast period?

Get Key Insights on Market Forecast (PDF) Request Free Sample

How is the Wall Art Market Segmented?

The wall art industry research report provides comprehensive data (region-wise segment analysis), with forecasts and estimates in "USD million" for the period 2026-2030, as well as historical data from 2020-2024 for the following segments.

  • Material
    • Canvas
    • Paper
    • Wood
    • Metal
  • End-user
    • Residential
    • Commercial spaces
  • Distribution channel
    • Offline
    • Online
  • Geography
    • APAC
      • China
      • Japan
      • India
    • North America
      • US
      • Canada
      • Mexico
    • Europe
      • Germany
      • UK
      • France
    • Middle East and Africa
      • UAE
      • Saudi Arabia
      • South Africa
    • South America
      • Brazil
      • Argentina
      • Colombia
    • Rest of World (ROW)

By Material Insights

The canvas segment is estimated to witness significant growth during the forecast period.

The canvas segment maintains a significant market share, prized for its classic texture and visual depth. High-quality stretched canvas provides a durable foundation for artist-designed decor, accessible through global online art marketplaces.

Advances in giclee printing technology, utilizing high-fidelity archival inks and precise color calibration, allow for exceptional detail and longevity. This process is highly efficient, with some manufacturers reporting up to a 20% reduction in ink waste while producing premium products.

Modern presentation techniques like gallery wrapping, which creates a frameless aesthetic, are particularly popular for complementing contemporary interiors and minimalist graphic prints, ensuring the segment's continued relevance and appeal.

Request Free Sample

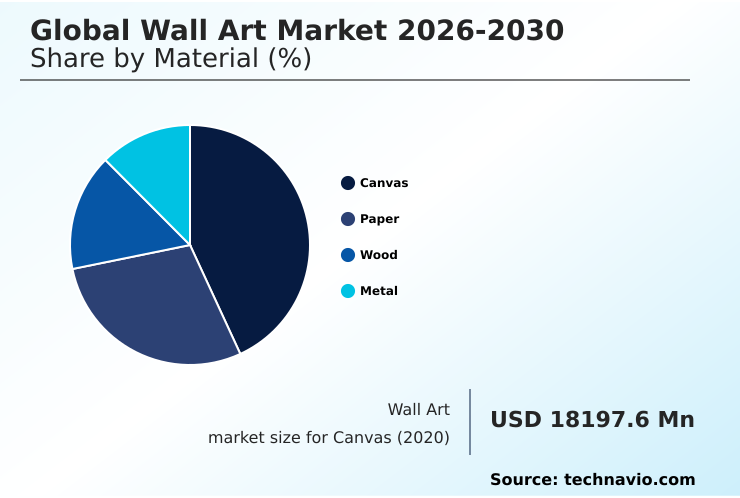
The Canvas segment was valued at USD 23.29 billion in 2024 and showed a gradual increase during the forecast period.

Request Free Sample

Regional Analysis

APAC is estimated to contribute 49.1% to the growth of the global market during the forecast period.Technavio’s analysts have elaborately explained the regional trends and drivers that shape the market during the forecast period.

See How Wall Art Market Demand is Rising in APAC Request Free Sample

The market's geographic landscape is led by the APAC region, which is set to contribute nearly 49.1% of the incremental growth, driven by rapid urbanization and a rising middle class.

North America follows, accounting for approximately 20.9% of growth, with a mature market focused on home interior customization and modern farmhouse decor.

In APAC, there is strong demand for artist-designed decor and cultural heritage artwork, often presented on stretched canvas with modern gallery wrapping.

Retailers offer curated art collections that include everything from traditional pieces to contemporary abstract metal sculpture and three-dimensional wall art. The demand for eco-friendly canvas is also growing globally, reflecting a universal trend toward sustainability.

Market Dynamics

Our researchers analyzed the data with 2025 as the base year, along with the key drivers, trends, and challenges. A holistic analysis of drivers will help companies refine their marketing strategies to gain a competitive advantage.

  • The impact of e-commerce on global wall art sales has been transformative, fundamentally restructuring how consumers and creators connect. Digital platforms have lowered the barrier to entry, fueling the growth of customized photo-to-canvas printing services and allowing individuals to turn personal memories into decorative pieces.
  • This digital-first environment has also heightened the importance of the role of augmented reality in online art purchasing, with tools that let buyers visualize art in their homes leading to significantly higher conversion rates compared to static image galleries. Simultaneously, trends in commercial design are creating new, specialized verticals.
  • The push for wellness in corporate and healthcare settings has created a substantial market for biophilic wall art for corporate and healthcare environments, where nature-inspired aesthetics are used to improve occupant well-being. This aligns with a broader industry shift toward sustainable materials for wall art production, as corporate buyers demand eco-friendly options to meet their ESG mandates.
  • However, the ease of digital replication brings the critical challenge of intellectual property protection for digital artists. This has spurred innovation in blockchain-based verification and advanced watermarking to ensure creators are compensated, a necessary step to sustain the creative ecosystem that the digital marketplace relies upon.

What are the key market drivers leading to the rise in the adoption of Wall Art Industry?

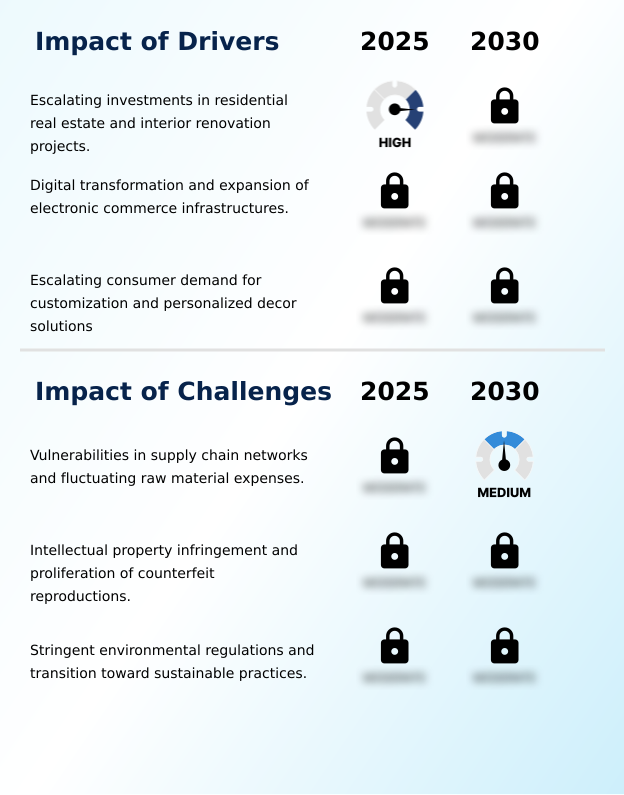
  • Escalating investments in residential real estate and interior renovation projects are a key driver for market growth.

  • The expansion of e-commerce is a primary driver, enabling direct-to-consumer sales models that facilitate home interior customization at scale. Print-on-demand services allow for a vast array of products, from personalized photo-to-canvas to Scandinavian-style posters, without inventory risk.
  • Technology plays a vital role; augmented reality visualization tools are boosting consumer confidence, leading to engagement rates that are 40% higher and reduced returns. This focus on interior aesthetic enhancement is not limited to residential spaces.
  • Commercial art procurement for offices and hotels increasingly demands custom framing solutions to match specific brand aesthetics, with custom orders now accounting for up to 25% of online sales for some leading vendors.

What are the market trends shaping the Wall Art Industry?

  • A key market trend is the rising adoption of sustainable and environmentally responsible material compositions, reflecting growing consumer and corporate demand for eco-conscious products.

  • A major trend is the focus on sustainable material compositions, with ethical art sourcing becoming a key criterion for both residential and commercial buyers. Hospitality design trends increasingly incorporate pieces made from upcycled wood and printed with non-toxic pigments. Biophilic design is prominent, with studies showing its application in workplaces can increase productivity by up to 15%.
  • This is reinforced by evidence-based design principles in healthcare. The market also sees growth in functional art, such as decorative acoustic wall panels and stylistic bohemian wall tapestries, with sustainable artworks now comprising over 30% of new collections in some retail channels.

What challenges does the Wall Art Industry face during its growth?

  • Vulnerabilities in supply chain networks and fluctuating raw material expenses present a key challenge to industry growth.

  • Supply chain volatility presents a significant challenge, with raw material price hikes causing production costs to rise by 10-15% for items ranging from sustainable framing materials to archival paper. Concurrently, intellectual property infringement is a major concern, particularly for artists creating limited-edition prints and businesses specializing in corporate branding art.
  • Companies report dedicating up to 20% more resources to IP protection measures like digital watermarking. The complexity extends to premium products such as dye-sublimation on metal pieces and frameless acrylic prints, where counterfeit goods can damage brand reputation. These issues create a difficult landscape, even for firms offering luxury art consultation for bespoke art commissions.

Exclusive Technavio Analysis on Customer Landscape

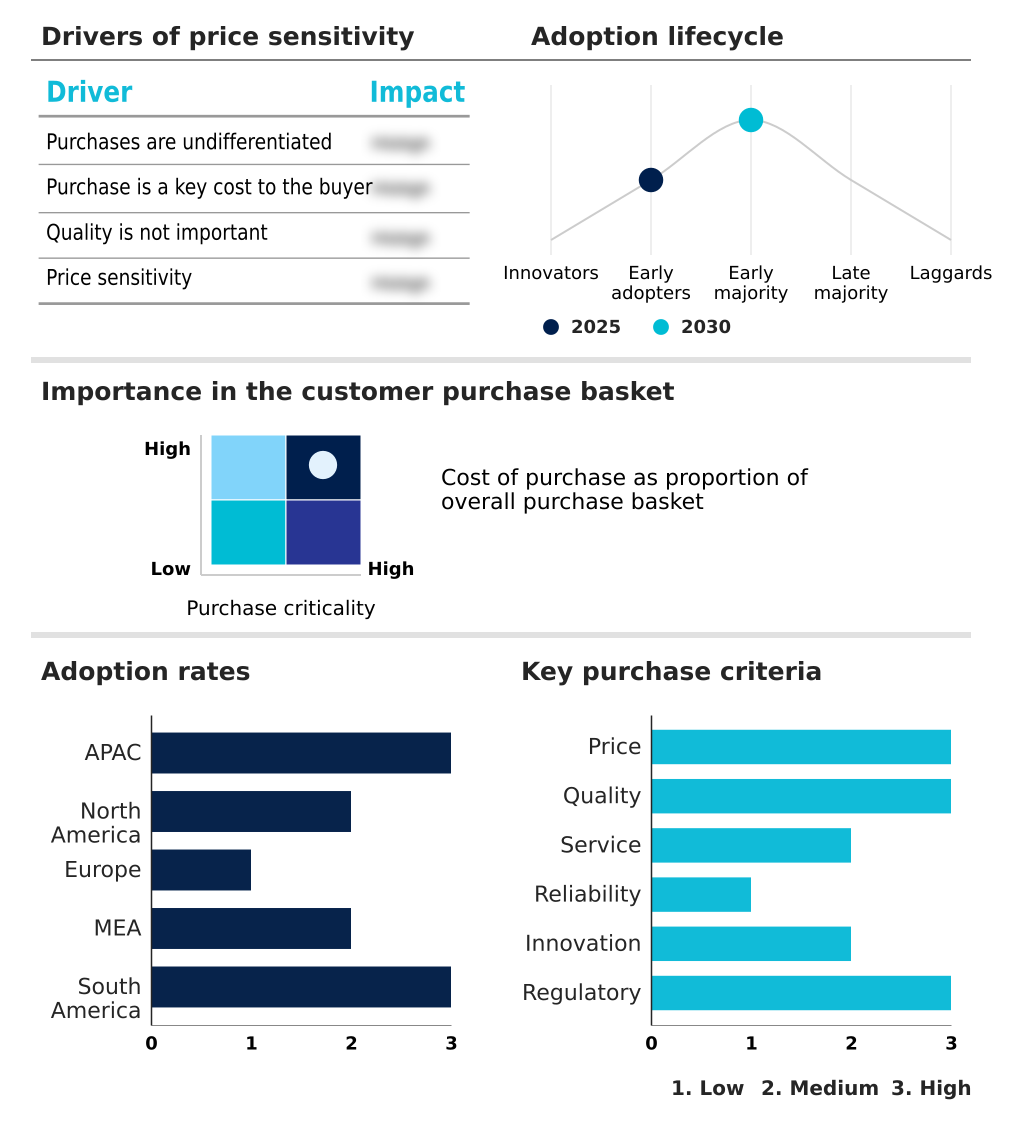
The wall art market forecasting report includes the adoption lifecycle of the market, covering from the innovator’s stage to the laggard’s stage. It focuses on adoption rates in different regions based on penetration. Furthermore, the wall art market report also includes key purchase criteria and drivers of price sensitivity to help companies evaluate and develop their market growth analysis strategies.

Customer Landscape of Wall Art Industry

Competitive Landscape

Companies are implementing various strategies, such as strategic alliances, wall art market forecast, partnerships, mergers and acquisitions, geographical expansion, and product/service launches, to enhance their presence in the industry.

Desenio Group Inc. - Offers accessible, trend-driven Scandinavian-style posters and art prints, providing affordable, curated solutions for modern interior design aesthetics.

The industry research and growth report includes detailed analyses of the competitive landscape of the market and information about key companies, including:

  • Desenio Group Inc.
  • Elephant Stock
  • Etsy Inc.
  • Great Big Canvas
  • iCanvas
  • Inter IKEA Holding BV
  • Leftbank Art
  • LUMAS
  • Marmont Hill INC.
  • Minted LLC
  • Oliver Gal Artist Co.
  • Redbubble Ltd.
  • Shutterfly Inc.
  • Society6 LLC
  • Stupell Home decor
  • Wayfair Inc.
  • Wendover Art Group
  • Zazzle Inc.

Qualitative and quantitative analysis of companies has been conducted to help clients understand the wider business environment as well as the strengths and weaknesses of key industry players. Data is qualitatively analyzed to categorize companies as pure play, category-focused, industry-focused, and diversified; it is quantitatively analyzed to categorize companies as dominant, leading, strong, tentative, and weak.

Recent Development and News in Wall art market

  • In September 2024, Art.com announced a strategic partnership with a leading sustainable materials supplier to launch a new line of eco-friendly framed prints, utilizing recycled wood and non-toxic inks.
  • In December 2024, Vistapic launched an advanced AI-powered design tool allowing users to generate unique wall art compositions from text prompts, enhancing their custom decor offerings.
  • In March 2025, CanvasWorld Inc. completed its acquisition of PhotoFrame Co., a move aimed at integrating custom framing services directly into its online print-on-demand platform.
  • In May 2025, The Global Art Collective opened its new North American distribution center, reducing shipping times for its curated art prints by an average of 40% for customers in the US and Canada.

Dive into Technavio’s robust research methodology, blending expert interviews, extensive data synthesis, and validated models for unparalleled Wall Art Market insights. See full methodology.

Market Scope
Page number 289
Base year 2025
Historic period 2020-2024
Forecast period 2026-2030
Growth momentum & CAGR Accelerate at a CAGR of 10.5%
Market growth 2026-2030 USD 38468.0 million
Market structure Fragmented
YoY growth 2025-2026(%) 9.5%
Key countries China, Japan, India, South Korea, Australia, Indonesia, US, Canada, Mexico, Germany, UK, France, Italy, Spain, The Netherlands, UAE, Saudi Arabia, South Africa, Turkey, Israel, Brazil, Argentina and Colombia
Competitive landscape Leading Companies, Market Positioning of Companies, Competitive Strategies, and Industry Risks

Request Free Sample

Research Analyst Overview

  • The wall art market is defined by a complex interplay of aesthetic innovation and technological disruption. At a strategic level, boardroom decisions are increasingly influenced by the need to balance commercial art procurement with sustainability mandates, shifting sourcing toward eco-friendly canvas and sustainable framing.
  • The adoption of advanced production techniques is critical; for instance, the use of dye-sublimation on metal has increased production throughput by 20% for some manufacturers, enhancing operational efficiency. Key technologies like giclee printing with precise color calibration and archival inks are now standard for producing limited-edition prints on archival paper.
  • As the market expands, so do challenges, necessitating solutions like digital watermarking to protect intellectual property. For consumers, augmented reality visualization is a crucial tool, while print-on-demand services enable mass customization. The offerings are diverse, from stretched canvas with gallery wrapping and upcycled wood pieces to three-dimensional wall art and functional acoustic wall panels, all contributing to interior aesthetic enhancement.
  • This dynamic landscape requires a focus on both custom framing solutions and principles of evidence-based design, especially in specialized areas like biophilic design and cultural heritage artwork.

What are the Key Data Covered in this Wall Art Market Research and Growth Report?

  • What is the expected growth of the Wall Art Market between 2026 and 2030?

    • USD 38.47 billion, at a CAGR of 10.5%

  • What segmentation does the market report cover?

    • The report is segmented by Material (Canvas, Paper, Wood, and Metal), End-user (Residential, and Commercial spaces), Distribution Channel (Offline, and Online) and Geography (APAC, North America, Europe, Middle East and Africa, South America)

  • Which regions are analyzed in the report?

    • APAC, North America, Europe, Middle East and Africa and South America

  • What are the key growth drivers and market challenges?

    • Escalating investments in residential real estate and interior renovation projects. , Vulnerabilities in supply chain networks and fluctuating raw material expenses.

  • Who are the major players in the Wall Art Market?

    • Desenio Group Inc., Elephant Stock, Etsy Inc., Great Big Canvas, iCanvas, Inter IKEA Holding BV, Leftbank Art, LUMAS, Marmont Hill INC., Minted LLC, Oliver Gal Artist Co., Redbubble Ltd., Shutterfly Inc., Society6 LLC, Stupell Home decor, Wayfair Inc., Wendover Art Group and Zazzle Inc.

Market Research Insights

  • The market's dynamics are reshaped by digital platforms that enable direct-to-consumer sales models and deep home interior customization. Online art marketplaces now offer vast curated art collections, empowering consumers to find unique pieces. The integration of technology yields tangible business outcomes; platforms using augmented reality for visualization report up to a 25% lower return rate on items.
  • Furthermore, the shift to print-on-demand services fundamentally alters supply chain economics, allowing retailers to reduce physical inventory holding costs by over 90% compared to traditional brick-and-mortar models, thereby improving profitability and enabling a wider variety of artistic offerings.

We can help! Our analysts can customize this wall art market research report to meet your requirements.

Get in touch

1. Executive Summary

1.1 Market overview

Executive Summary - Chart on Market Overview
Executive Summary - Data Table on Market Overview
Executive Summary - Chart on Global Market Characteristics
Executive Summary - Chart on Market by Geography
Executive Summary - Chart on Market Segmentation by Material
Executive Summary - Chart on Market Segmentation by End-user
Executive Summary - Chart on Market Segmentation by Distribution Channel
Executive Summary - Chart on Incremental Growth
Executive Summary - Data Table on Incremental Growth
Executive Summary - Chart on Company Market Positioning

2. Technavio Analysis

2.1 Analysis of price sensitivity, lifecycle, customer purchase basket, adoption rates, and purchase criteria

2.2 Criticality of inputs and Factors of differentiation

Chart on Overview on criticality of inputs and factors of differentiation

2.3 Factors of disruption

Chart on Overview on factors of disruption

2.4 Impact of drivers and challenges

Chart on Impact of drivers and challenges in 2025 and 2030

3. Market Landscape

3.1 Market ecosystem

Chart on Parent Market
Data Table on - Parent Market

3.2 Market characteristics

Chart on Market characteristics analysis

3.3 Value chain analysis

Chart on Value chain analysis

4. Market Sizing

4.1 Market definition

Data Table on Offerings of companies included in the market definition

4.2 Market segment analysis

Market segments

4.3 Market size 2025

4.4 Market outlook: Forecast for 2025-2030

Chart on Global - Market size and forecast 2025-2030 ($ million)
Data Table on Global - Market size and forecast 2025-2030 ($ million)
Chart on Global Market: Year-over-year growth 2025-2030 (%)
Data Table on Global Market: Year-over-year growth 2025-2030 (%)

5. Historic Market Size

5.1 Global Wall Art Market 2020 - 2024

Historic Market Size - Data Table on Global Wall Art Market 2020 - 2024 ($ million)

5.2 Material segment analysis 2020 - 2024

Historic Market Size - Material Segment 2020 - 2024 ($ million)

5.3 End-user segment analysis 2020 - 2024

Historic Market Size - End-user Segment 2020 - 2024 ($ million)

5.4 Distribution Channel segment analysis 2020 - 2024

Historic Market Size - Distribution Channel Segment 2020 - 2024 ($ million)

5.5 Geography segment analysis 2020 - 2024

Historic Market Size - Geography Segment 2020 - 2024 ($ million)

5.6 Country segment analysis 2020 - 2024

Historic Market Size - Country Segment 2020 - 2024 ($ million)

6. Qualitative Analysis

6.1 Impact of AI on Global Wall Art Market

6.2 Impact of Geopolitical Conflicts on Global Wall Art Market

7. Five Forces Analysis

7.1 Five forces summary

Five forces analysis - Comparison between 2025 and 2030

7.2 Bargaining power of buyers

Bargaining power of buyers - Impact of key factors 2025 and 2030

7.3 Bargaining power of suppliers

Bargaining power of suppliers - Impact of key factors in 2025 and 2030

7.4 Threat of new entrants

Threat of new entrants - Impact of key factors in 2025 and 2030

7.5 Threat of substitutes

Threat of substitutes - Impact of key factors in 2025 and 2030

7.6 Threat of rivalry

Threat of rivalry - Impact of key factors in 2025 and 2030

7.7 Market condition

Chart on Market condition - Five forces 2025 and 2030

8. Market Segmentation by Material

8.1 Market segments

Chart on Material - Market share 2025-2030 (%)
Data Table on Material - Market share 2025-2030 (%)

8.2 Comparison by Material

Chart on Comparison by Material
Data Table on Comparison by Material

8.3 Canvas - Market size and forecast 2025-2030

Chart on Canvas - Market size and forecast 2025-2030 ($ million)
Data Table on Canvas - Market size and forecast 2025-2030 ($ million)
Chart on Canvas - Year-over-year growth 2025-2030 (%)
Data Table on Canvas - Year-over-year growth 2025-2030 (%)

8.4 Paper - Market size and forecast 2025-2030

Chart on Paper - Market size and forecast 2025-2030 ($ million)
Data Table on Paper - Market size and forecast 2025-2030 ($ million)
Chart on Paper - Year-over-year growth 2025-2030 (%)
Data Table on Paper - Year-over-year growth 2025-2030 (%)

8.5 Wood - Market size and forecast 2025-2030

Chart on Wood - Market size and forecast 2025-2030 ($ million)
Data Table on Wood - Market size and forecast 2025-2030 ($ million)
Chart on Wood - Year-over-year growth 2025-2030 (%)
Data Table on Wood - Year-over-year growth 2025-2030 (%)

8.6 Metal - Market size and forecast 2025-2030

Chart on Metal - Market size and forecast 2025-2030 ($ million)
Data Table on Metal - Market size and forecast 2025-2030 ($ million)
Chart on Metal - Year-over-year growth 2025-2030 (%)
Data Table on Metal - Year-over-year growth 2025-2030 (%)

8.7 Market opportunity by Material

Market opportunity by Material ($ million)
Data Table on Market opportunity by Material ($ million)

9. Market Segmentation by End-user

9.1 Market segments

Chart on End-user - Market share 2025-2030 (%)
Data Table on End-user - Market share 2025-2030 (%)

9.2 Comparison by End-user

Chart on Comparison by End-user
Data Table on Comparison by End-user

9.3 Residential - Market size and forecast 2025-2030

Chart on Residential - Market size and forecast 2025-2030 ($ million)
Data Table on Residential - Market size and forecast 2025-2030 ($ million)
Chart on Residential - Year-over-year growth 2025-2030 (%)
Data Table on Residential - Year-over-year growth 2025-2030 (%)

9.4 Commercial spaces - Market size and forecast 2025-2030

Chart on Commercial spaces - Market size and forecast 2025-2030 ($ million)
Data Table on Commercial spaces - Market size and forecast 2025-2030 ($ million)
Chart on Commercial spaces - Year-over-year growth 2025-2030 (%)
Data Table on Commercial spaces - Year-over-year growth 2025-2030 (%)

9.5 Market opportunity by End-user

Market opportunity by End-user ($ million)
Data Table on Market opportunity by End-user ($ million)

10. Market Segmentation by Distribution Channel

10.1 Market segments

Chart on Distribution Channel - Market share 2025-2030 (%)
Data Table on Distribution Channel - Market share 2025-2030 (%)

10.2 Comparison by Distribution Channel

Chart on Comparison by Distribution Channel
Data Table on Comparison by Distribution Channel

10.3 Offline - Market size and forecast 2025-2030

Chart on Offline - Market size and forecast 2025-2030 ($ million)
Data Table on Offline - Market size and forecast 2025-2030 ($ million)
Chart on Offline - Year-over-year growth 2025-2030 (%)
Data Table on Offline - Year-over-year growth 2025-2030 (%)

10.4 Online - Market size and forecast 2025-2030

Chart on Online - Market size and forecast 2025-2030 ($ million)
Data Table on Online - Market size and forecast 2025-2030 ($ million)
Chart on Online - Year-over-year growth 2025-2030 (%)
Data Table on Online - Year-over-year growth 2025-2030 (%)

10.5 Market opportunity by Distribution Channel

Market opportunity by Distribution Channel ($ million)
Data Table on Market opportunity by Distribution Channel ($ million)

11. Customer Landscape

11.1 Customer landscape overview

Analysis of price sensitivity, lifecycle, customer purchase basket, adoption rates, and purchase criteria

12. Geographic Landscape

12.1 Geographic segmentation

Chart on Market share by geography 2025-2030 (%)
Data Table on Market share by geography 2025-2030 (%)

12.2 Geographic comparison

Chart on Geographic comparison
Data Table on Geographic comparison

12.3 APAC - Market size and forecast 2025-2030

Chart on APAC - Market size and forecast 2025-2030 ($ million)
Data Table on APAC - Market size and forecast 2025-2030 ($ million)
Chart on APAC - Year-over-year growth 2025-2030 (%)
Data Table on APAC - Year-over-year growth 2025-2030 (%)
Chart on Regional Comparison - APAC
Data Table on Regional Comparison - APAC

12.3.1 China - Market size and forecast 2025-2030

Chart on China - Market size and forecast 2025-2030 ($ million)
Data Table on China - Market size and forecast 2025-2030 ($ million)
Chart on China - Year-over-year growth 2025-2030 (%)
Data Table on China - Year-over-year growth 2025-2030 (%)

12.3.2 Japan - Market size and forecast 2025-2030

Chart on Japan - Market size and forecast 2025-2030 ($ million)
Data Table on Japan - Market size and forecast 2025-2030 ($ million)
Chart on Japan - Year-over-year growth 2025-2030 (%)
Data Table on Japan - Year-over-year growth 2025-2030 (%)

12.3.3 India - Market size and forecast 2025-2030

Chart on India - Market size and forecast 2025-2030 ($ million)
Data Table on India - Market size and forecast 2025-2030 ($ million)
Chart on India - Year-over-year growth 2025-2030 (%)
Data Table on India - Year-over-year growth 2025-2030 (%)

12.3.4 South Korea - Market size and forecast 2025-2030

Chart on South Korea - Market size and forecast 2025-2030 ($ million)
Data Table on South Korea - Market size and forecast 2025-2030 ($ million)
Chart on South Korea - Year-over-year growth 2025-2030 (%)
Data Table on South Korea - Year-over-year growth 2025-2030 (%)

12.3.5 Australia - Market size and forecast 2025-2030

Chart on Australia - Market size and forecast 2025-2030 ($ million)
Data Table on Australia - Market size and forecast 2025-2030 ($ million)
Chart on Australia - Year-over-year growth 2025-2030 (%)
Data Table on Australia - Year-over-year growth 2025-2030 (%)

12.3.6 Indonesia - Market size and forecast 2025-2030

Chart on Indonesia - Market size and forecast 2025-2030 ($ million)
Data Table on Indonesia - Market size and forecast 2025-2030 ($ million)
Chart on Indonesia - Year-over-year growth 2025-2030 (%)
Data Table on Indonesia - Year-over-year growth 2025-2030 (%)

12.4 North America - Market size and forecast 2025-2030

Chart on North America - Market size and forecast 2025-2030 ($ million)
Data Table on North America - Market size and forecast 2025-2030 ($ million)
Chart on North America - Year-over-year growth 2025-2030 (%)
Data Table on North America - Year-over-year growth 2025-2030 (%)
Chart on Regional Comparison - North America
Data Table on Regional Comparison - North America

12.4.1 US - Market size and forecast 2025-2030

Chart on US - Market size and forecast 2025-2030 ($ million)
Data Table on US - Market size and forecast 2025-2030 ($ million)
Chart on US - Year-over-year growth 2025-2030 (%)
Data Table on US - Year-over-year growth 2025-2030 (%)

12.4.2 Canada - Market size and forecast 2025-2030

Chart on Canada - Market size and forecast 2025-2030 ($ million)
Data Table on Canada - Market size and forecast 2025-2030 ($ million)
Chart on Canada - Year-over-year growth 2025-2030 (%)
Data Table on Canada - Year-over-year growth 2025-2030 (%)

12.4.3 Mexico - Market size and forecast 2025-2030

Chart on Mexico - Market size and forecast 2025-2030 ($ million)
Data Table on Mexico - Market size and forecast 2025-2030 ($ million)
Chart on Mexico - Year-over-year growth 2025-2030 (%)
Data Table on Mexico - Year-over-year growth 2025-2030 (%)

12.5 Europe - Market size and forecast 2025-2030

Chart on Europe - Market size and forecast 2025-2030 ($ million)
Data Table on Europe - Market size and forecast 2025-2030 ($ million)
Chart on Europe - Year-over-year growth 2025-2030 (%)
Data Table on Europe - Year-over-year growth 2025-2030 (%)
Chart on Regional Comparison - Europe
Data Table on Regional Comparison - Europe

12.5.1 Germany - Market size and forecast 2025-2030

Chart on Germany - Market size and forecast 2025-2030 ($ million)
Data Table on Germany - Market size and forecast 2025-2030 ($ million)
Chart on Germany - Year-over-year growth 2025-2030 (%)
Data Table on Germany - Year-over-year growth 2025-2030 (%)

12.5.2 UK - Market size and forecast 2025-2030

Chart on UK - Market size and forecast 2025-2030 ($ million)
Data Table on UK - Market size and forecast 2025-2030 ($ million)
Chart on UK - Year-over-year growth 2025-2030 (%)
Data Table on UK - Year-over-year growth 2025-2030 (%)

12.5.3 France - Market size and forecast 2025-2030

Chart on France - Market size and forecast 2025-2030 ($ million)
Data Table on France - Market size and forecast 2025-2030 ($ million)
Chart on France - Year-over-year growth 2025-2030 (%)
Data Table on France - Year-over-year growth 2025-2030 (%)

12.5.4 Italy - Market size and forecast 2025-2030

Chart on Italy - Market size and forecast 2025-2030 ($ million)
Data Table on Italy - Market size and forecast 2025-2030 ($ million)
Chart on Italy - Year-over-year growth 2025-2030 (%)
Data Table on Italy - Year-over-year growth 2025-2030 (%)

12.5.5 Spain - Market size and forecast 2025-2030

Chart on Spain - Market size and forecast 2025-2030 ($ million)
Data Table on Spain - Market size and forecast 2025-2030 ($ million)
Chart on Spain - Year-over-year growth 2025-2030 (%)
Data Table on Spain - Year-over-year growth 2025-2030 (%)

12.5.6 The Netherlands - Market size and forecast 2025-2030

Chart on The Netherlands - Market size and forecast 2025-2030 ($ million)
Data Table on The Netherlands - Market size and forecast 2025-2030 ($ million)
Chart on The Netherlands - Year-over-year growth 2025-2030 (%)
Data Table on The Netherlands - Year-over-year growth 2025-2030 (%)

12.6 Middle East and Africa - Market size and forecast 2025-2030

Chart on Middle East and Africa - Market size and forecast 2025-2030 ($ million)
Data Table on Middle East and Africa - Market size and forecast 2025-2030 ($ million)
Chart on Middle East and Africa - Year-over-year growth 2025-2030 (%)
Data Table on Middle East and Africa - Year-over-year growth 2025-2030 (%)
Chart on Regional Comparison - Middle East and Africa
Data Table on Regional Comparison - Middle East and Africa

12.6.1 UAE - Market size and forecast 2025-2030

Chart on UAE - Market size and forecast 2025-2030 ($ million)
Data Table on UAE - Market size and forecast 2025-2030 ($ million)
Chart on UAE - Year-over-year growth 2025-2030 (%)
Data Table on UAE - Year-over-year growth 2025-2030 (%)

12.6.2 Saudi Arabia - Market size and forecast 2025-2030

Chart on Saudi Arabia - Market size and forecast 2025-2030 ($ million)
Data Table on Saudi Arabia - Market size and forecast 2025-2030 ($ million)
Chart on Saudi Arabia - Year-over-year growth 2025-2030 (%)
Data Table on Saudi Arabia - Year-over-year growth 2025-2030 (%)

12.6.3 South Africa - Market size and forecast 2025-2030

Chart on South Africa - Market size and forecast 2025-2030 ($ million)
Data Table on South Africa - Market size and forecast 2025-2030 ($ million)
Chart on South Africa - Year-over-year growth 2025-2030 (%)
Data Table on South Africa - Year-over-year growth 2025-2030 (%)

12.6.4 Turkey - Market size and forecast 2025-2030

Chart on Turkey - Market size and forecast 2025-2030 ($ million)
Data Table on Turkey - Market size and forecast 2025-2030 ($ million)
Chart on Turkey - Year-over-year growth 2025-2030 (%)
Data Table on Turkey - Year-over-year growth 2025-2030 (%)

12.6.5 Israel - Market size and forecast 2025-2030

Chart on Israel - Market size and forecast 2025-2030 ($ million)
Data Table on Israel - Market size and forecast 2025-2030 ($ million)
Chart on Israel - Year-over-year growth 2025-2030 (%)
Data Table on Israel - Year-over-year growth 2025-2030 (%)

12.7 South America - Market size and forecast 2025-2030

Chart on South America - Market size and forecast 2025-2030 ($ million)
Data Table on South America - Market size and forecast 2025-2030 ($ million)
Chart on South America - Year-over-year growth 2025-2030 (%)
Data Table on South America - Year-over-year growth 2025-2030 (%)
Chart on Regional Comparison - South America
Data Table on Regional Comparison - South America

12.7.1 Brazil - Market size and forecast 2025-2030

Chart on Brazil - Market size and forecast 2025-2030 ($ million)
Data Table on Brazil - Market size and forecast 2025-2030 ($ million)
Chart on Brazil - Year-over-year growth 2025-2030 (%)
Data Table on Brazil - Year-over-year growth 2025-2030 (%)

12.7.2 Argentina - Market size and forecast 2025-2030

Chart on Argentina - Market size and forecast 2025-2030 ($ million)
Data Table on Argentina - Market size and forecast 2025-2030 ($ million)
Chart on Argentina - Year-over-year growth 2025-2030 (%)
Data Table on Argentina - Year-over-year growth 2025-2030 (%)

12.7.3 Colombia - Market size and forecast 2025-2030

Chart on Colombia - Market size and forecast 2025-2030 ($ million)
Data Table on Colombia - Market size and forecast 2025-2030 ($ million)
Chart on Colombia - Year-over-year growth 2025-2030 (%)
Data Table on Colombia - Year-over-year growth 2025-2030 (%)

12.8 Market opportunity by geography

Market opportunity by geography ($ million)
Data Tables on Market opportunity by geography ($ million)

13. Drivers, Challenges, and Opportunity

13.1 Market drivers

Escalating investments in residential real estate and interior renovation projects.
Digital transformation and expansion of electronic commerce infrastructures.
Escalating consumer demand for customization and personalized decor solutions

13.2 Market challenges

Vulnerabilities in supply chain networks and fluctuating raw material expenses.
Intellectual property infringement and proliferation of counterfeit reproductions.
Stringent environmental regulations and transition toward sustainable practices.

13.3 Impact of drivers and challenges

Impact of drivers and challenges in 2025 and 2030

13.4 Market opportunities

Adoption of sustainable and environmentally responsible material compositions
Incorporation of biophilic design elements in corporate and healthcare facilities
Rising preference for culturally authentic and heritage inspired artisan creations

14. Competitive Landscape

14.1 Overview

14.2

Overview on criticality of inputs and factors of differentiation

14.3 Landscape disruption

Overview on factors of disruption

14.4 Industry risks

Impact of key risks on business

15. Competitive Analysis

15.1 Companies profiled

Companies covered

15.2 Company ranking index

15.3 Market positioning of companies

Matrix on companies position and classification

15.4 Desenio Group Inc.

Desenio Group Inc. - Overview
Desenio Group Inc. - Product / Service
Desenio Group Inc. - Key offerings
SWOT

15.5 Great Big Canvas

Great Big Canvas - Overview
Great Big Canvas - Product / Service
Great Big Canvas - Key offerings
SWOT

15.6 iCanvas

iCanvas - Overview
iCanvas - Product / Service
iCanvas - Key offerings
SWOT

15.7 Inter IKEA Holding BV

Inter IKEA Holding BV - Overview
Inter IKEA Holding BV - Product / Service
Inter IKEA Holding BV - Key offerings
SWOT

15.8 Leftbank Art

Leftbank Art - Overview
Leftbank Art - Product / Service
Leftbank Art - Key offerings
SWOT

15.9 LUMAS

LUMAS - Overview
LUMAS - Product / Service
LUMAS - Key offerings
SWOT

15.10 Minted LLC

Minted LLC - Overview
Minted LLC - Product / Service
Minted LLC - Key offerings
SWOT

15.11 Oliver Gal Artist Co.

Oliver Gal Artist Co. - Overview
Oliver Gal Artist Co. - Product / Service
Oliver Gal Artist Co. - Key offerings
SWOT

15.12 Redbubble Ltd.

Redbubble Ltd. - Overview
Redbubble Ltd. - Product / Service
Redbubble Ltd. - Key offerings
SWOT

15.13 Shutterfly Inc.

Shutterfly Inc. - Overview
Shutterfly Inc. - Product / Service
Shutterfly Inc. - Key offerings
SWOT

15.14 Society6 LLC

Society6 LLC - Overview
Society6 LLC - Product / Service
Society6 LLC - Key offerings
SWOT

15.15 Stupell Home decor

Stupell Home decor - Overview
Stupell Home decor - Product / Service
Stupell Home decor - Key offerings
SWOT

15.16 Wayfair Inc.

Wayfair Inc. - Overview
Wayfair Inc. - Business segments
Wayfair Inc. - Key offerings
Wayfair Inc. - Segment focus
SWOT

15.17 Wendover Art Group

Wendover Art Group - Overview
Wendover Art Group - Product / Service
Wendover Art Group - Key offerings
SWOT

15.18 Zazzle Inc.

Zazzle Inc. - Overview
Zazzle Inc. - Product / Service
Zazzle Inc. - Key offerings
SWOT

16. Appendix

16.1 Scope of the report

Market definition
Objectives
Notes and caveats

16.2 Inclusions and exclusions checklist

Inclusions checklist
Exclusions checklist

16.3 Currency conversion rates for US$

16.4 Research methodology

16.5 Data procurement

Information sources

16.6 Data validation

16.7 Validation techniques employed for market sizing

16.8 Data synthesis

16.9 360 degree market analysis

16.10 List of abbreviations

Research Methodology

Technavio presents a detailed picture of the market by way of study, synthesis, and summation of data from multiple sources. The analysts have presented the various facets of the market with a particular focus on identifying the key industry influencers. The data thus presented is comprehensive, reliable, and the result of extensive research, both primary and secondary.

INFORMATION SOURCES

Primary sources

  • Manufacturers and suppliers
  • Channel partners
  • Industry experts
  • Strategic decision makers

Secondary sources

  • Industry journals and periodicals
  • Government data
  • Financial reports of key industry players
  • Historical data
  • Press releases

DATA ANALYSIS

Data Synthesis

  • Collation of data
  • Estimation of key figures
  • Analysis of derived insights

Data Validation

  • Triangulation with data models
  • Reference against proprietary databases
  • Corroboration with industry experts

REPORT WRITING

Qualitative

  • Market drivers
  • Market challenges
  • Market trends
  • Five forces analysis

Quantitative

  • Market size and forecast
  • Market segmentation
  • Geographical insights
  • Competitive landscape

Interested in this report?

Get your sample now to see our research methodology and insights!

Download Now

Frequently Asked Questions

Wall Art market growth will increase by USD 38468.0 million during 2026-2030.

The Wall Art market is expected to grow at a CAGR of 10.5% during 2026-2030.

Wall Art market is segmented by Material (Canvas, Paper, Wood, Metal) End-user (Residential, Commercial spaces) Distribution channel (Offline, Online)

Desenio Group Inc., Elephant Stock, Etsy Inc., Great Big Canvas, iCanvas, Inter IKEA Holding BV, Leftbank Art, LUMAS, Marmont Hill INC., Minted LLC, Oliver Gal Artist Co., Redbubble Ltd., Shutterfly Inc., Society6 LLC, Stupell Home decor, Wayfair Inc., Wendover Art Group, Zazzle Inc. are a few of the key vendors in the Wall Art market.

APAC will register the highest growth rate of 49.1% among the other regions. Therefore, the Wall Art market in APAC is expected to garner significant business opportunities for the vendors during the forecast period.

China, Japan, India, South Korea, Australia, Indonesia, US, Canada, Mexico, Germany, UK, France, Italy, Spain, The Netherlands, UAE, Saudi Arabia, South Africa, Turkey, Israel, Brazil, Argentina, Colombia

  • Escalating investments in residential real estate and interior renovation projects. is the driving factor this market.

The Wall Art market vendors should focus on grabbing business opportunities from the Material segment as it accounted for the largest market share in the base year.
RIA - Research AI Assistant
Ask RIA