Zinc Methionine Chelates Market Analysis APAC, Europe, North America, Middle East and Africa, South America - US, China, Japan, India, Germany - Size and Forecast 2024-2028

Zinc Methionine Chelates Market Analysis APAC, Europe, North America, Middle East and Africa, South America - US, China, Japan, India, Germany - Size and Forecast 2024-2028

Published: Jan 2024 151 Pages SKU: IRTNTR77184

Market Overview at a Glance

$6.12 K
Market Opportunity
6.89%
CAGR
6.33
YoY growth 2023-2024(%)

Zinc Methionine Chelates Market 2024-2028

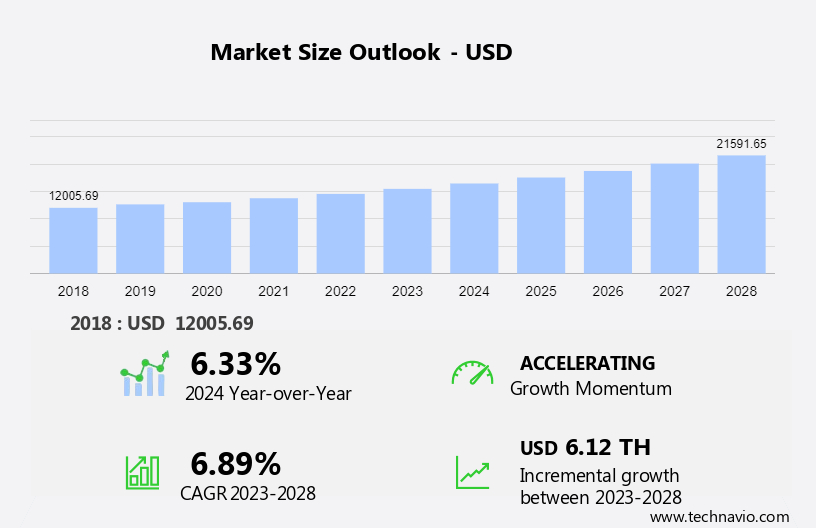
The zinc methionine chelates market size is forecast to increase by USD 6,117.21 at a CAGR of 6.89% between 2023 and 2028. The market growth and forecasting depend on several factors, including the rise in global meat consumption, the mergers and acquisitions among market players, and the frequent zinc methionine chelates product launches. 

The report includes a comprehensive outlook on the Zinc Methionine Chelates Market, offering forecasts for the industry segmented by Form Factor, which comprises powder, tablets, and granules. Additionally, it categorizes Type into swine, poultry, bovine, and others, and covers Regions, including APAC, Europe, North America, Middle East and Africa, and South America. The market research report provides market size, historical data spanning from 2018 to 2022, and future projections, all presented in terms of value for each of the mentioned segments.

What will be the Zinc Methionine Chelates Market Size During the Forecast Period?

Zinc Methionine Chelates Market Size

Request Free Sample in PDF

Zinc Methionine Chelates Market Definition 

Zinc methionine chelate refers to a compound formed by chemically bonding zinc, an essential mineral, with the amino acid methionine. This chelation process results in the creation of a complex where zinc is tightly bound to methionine, forming a stable and bioavailable form of zinc.

To Know more about the Market Report  Request Free Sample

Zinc Methionine Chelates Market: Key Drivers, Trends, Challenges

Key Zinc Methionine Chelates Market Driver

The rise in global meat consumption is the key factor driving market growth. The global per capita consumption of meat has grown at a steady rate in the past decade. According to the Organization for Economic Co-operation and Development (OECD), the global production of meat (beef, poultry, and pork) in 2021 was 340 million tons compared with nearly 248 million in 2018. The rise in the population also drives the global meat market and has increased production capacity and supply. 

In addition, rapid urbanization and changing consumer preferences regarding the consumption of meat have also led to an increase in the demand for zinc methionine chelates as producers aim to improve the efficiency and quality of their production processes. The majority of the global rise in meat production and consumption is from APAC and MEA. The healthy economic growth in these regions has boosted the production and consumption of meat, which, in turn, is expected to drive market growth during the forecast period.

Significant Zinc Methionine Chelates Market Trends

Increased focus on animal health is the primary trend shaping market growth. The surging popularity and demand for zinc methionine chelate in the market are closely tied to the increasing focus on animal health and wellness, reflecting current market trends and analysis. Zinc plays a key role in the immune system of animals. A well-functioning immune system is essential for disease resistance and overall health. Zinc methionine chelate, by providing a highly absorbable form of zinc, supports better immune function in livestock. 

Furthermore, the increased focus on animal health has led to a greater demand for feed additives and supplements that support better nutrition, immunity, and overall well-being of livestock. As a result, specialized products such as zinc methionine, known for their positive impact on animal health, have seen increased demand within the feed industry, which, in turn, will drive market growth during the forecast period.

Major Zinc Methionine Chelates Market Challenge

The high cost associated with chelated minerals is a challenge that affects market growth. Chelated minerals often come at a higher cost compared with inorganic sources. This cost difference can pose a challenge for widespread adoption, especially in regions or industries with tight budget constraints. The higher cost of chelated minerals, including zinc methionine, might make them less competitive compared with cheaper alternatives such as inorganic zinc sources. This can hinder their widespread adoption, particularly in markets where cost is a significant factor in decision-making.

In addition, livestock producers and animal feed manufacturers often operate within tight budget constraints. The increased cost of zinc methionine chelates might negatively impact the economic feasibility of incorporating these supplements into animal feed formulations, especially in larger-scale operations. Hence, the high cost of producing zinc methionine chelates may impede market growth during the forecast period.

Zinc Methionine Chelates Market Segmentation by Form Factor, Type, and Geography 

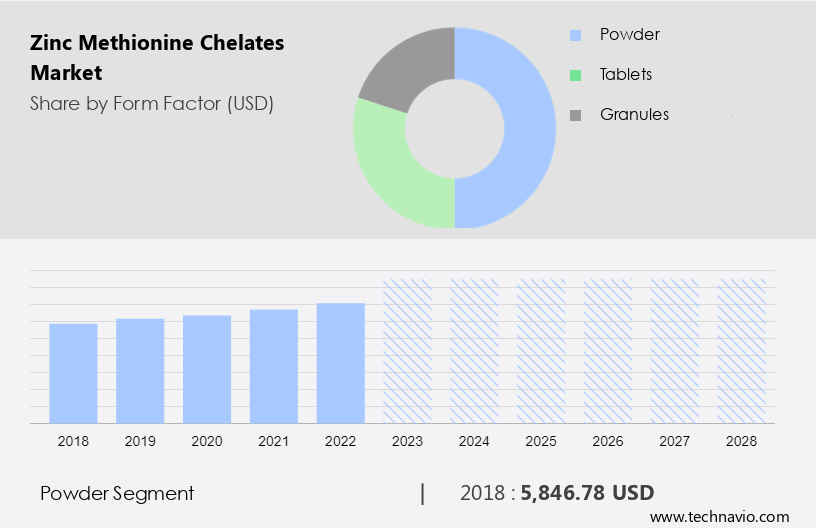
Zinc Methionine Chelates Market Form Factor Analysis 

The market share growth by the powder segment will be significant during the forecast period. The demand for zinc methionine chelate powder has been increasing steadily due to its advantages over other forms of zinc supplements. Zinc methionine chelate offers improved bioavailability and absorption compared with other zinc supplements. This enhanced absorption means that a higher percentage of the supplemented zinc is utilized by the body or animals, making it a more efficient source of the mineral.

Zinc Methionine Chelates Market Size

Get a glance at the market contribution of the End User  segment Request Free Sample

The powder segment accounted for USD 5,846.78 in 2018. Zinc is an essential mineral required for various bodily functions. It plays a crucial role in immune function, growth, wound healing, and reproductive health in both humans and animals. The demand for high-quality nutritional supplements that offer optimal absorption of zinc drives the need for chelated forms such as zinc methionine, which, in turn, will fuel the growth of the global zinc methionine chelates market during the forecast period.

Zinc Methionine Chelates Market Type Analysis 

Swine nutritionists and farmers seek to optimize the diet of pigs to enhance growth, productivity, and overall health. Zinc is an essential micronutrient for swine, crucial for various physiological functions, including growth, immune response, and reproduction. Moreover, swine producers are increasingly focused on improving animal health and productivity. Zinc methionine chelate is believed to support immune function, reducing the incidence of diseases and aiding in better growth performance. Furthermore, the combination of these factors contributes to the increasing preference and demand for zinc methionine chelate in swine feed as a way to optimize nutrition, promote healthier swine, and meet regulatory and consumer expectations, which, in turn, will fuel market growth during the forecast period.

Zinc Methionine Chelates Market Region Analysis

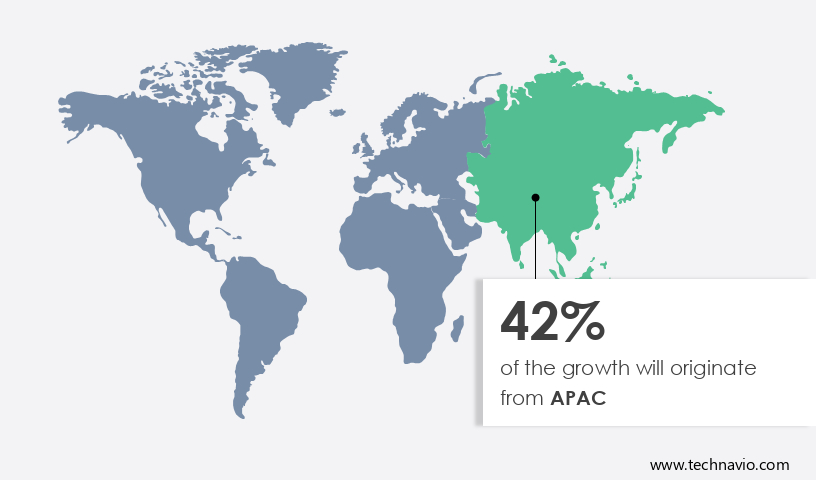
APAC is estimated to contribute 42% to the growth of the global market during the forecast period. Technavio’s analysts have elaborately explained the regional trends and drivers that shape the market during the forecast period.

Zinc Methionine Chelates Market Share by Geography

For more insights on the market share of various regions Request Free Sample

APAC has a significant and growing livestock industry, particularly in countries such as China and India. Swine, poultry, and other livestock farming are extensive, driving the demand for high-quality feed additives such as zinc methionine chelate. Livestock farmers in Asia are increasingly focusing on optimizing animal nutrition to improve growth rates, reproductive performance, and overall health. Zinc methionine chelate is sought after due to its enhanced bioavailability and ability to meet the zinc needs of animals more efficiently.

Furthermore, with the globalization of agricultural practices, the demand for high-quality feed additives, including zinc methionine chelate, is also influenced by global trade patterns and the adoption of international standards in animal husbandry. The combination of these factors indicates a growing market for zinc methionine chelate in Asia, driven by the need for improved animal nutrition, compliance with regulations, and meeting the expectations of both producers and consumers in the region's expanding livestock industry.

Key Zinc Methionine Chelates Market Companies

Companies are implementing various strategies by analyzing factors such as strategic alliances, partnerships, mergers and acquisitions, geographical expansion, and product or service launches, to enhance their presence in the market.

  • Balchem Inc.: The company offers zinc methionine chelates such as Albion Chelated Zinc which is absorbed intact and breaks apart in the intestinal cell for transport.

The report also includes detailed analyses of the competitive landscape of the market and information about 11 market companies, including: 

American Elements, Brihans Laboratories, Chengdu Sustar Feed Co. Ltd., Global Animal Products, JH Biotech Inc., Lonza Group Ltd., Novus International Inc., Priya Chemicals, UNO Vetchem, and Zinpro Corp.

Qualitative and quantitative analysis of companies has been conducted to help clients understand the wider business environment as well as the strengths and weaknesses of key market players. Data is qualitatively analyzed to categorize companies as pure play, category-focused, industry-focused, and diversified; it is quantitatively analyzed to categorize companies as dominant, leading, strong, tentative, and weak.

Segment Overview

The market analysis and report forecasts market growth analysis by revenue at global, regional & country levels and provides an analysis of the latest market growth and trends from 2018-2028. 

  • Foam Factor Outlook 
    • Powder
    • Tablets
    • Granules
  • Type Outlook
    • Swine
    • Poultry
    • Bovine
    • Others
  • Region Outlook 
    • North America
      • The U.S.
      • Canada
    • Europe
      • U.K.
      • Germany
      • France
      • Rest of Europe
    • APAC
      • China
      • India
    • South America
      • Chile
      • Brazil
      • Argentina
    • Middle East & Africa
      • Saudi Arabia
      • South Africa
      • Rest of the Middle East & Africa

Zinc Methionine Chelates Market Scope

Report Coverage

Details

Page number

151

Base year

2023

Historic period

2018-2022

Market forecasting period

2024-2028

Growth momentum & CAGR

Accelerate at a CAGR of 6.89%

Market Growth 2024-2028

USD 6,117.21

Market structure

Concentrated

YoY growth 2023-2024(%)

6.33

Regional analysis

APAC, Europe, North America, Middle East and Africa, and South America

Performing market contribution

APAC at 42%

Key countries

US, China, Japan, India, and Germany

Competitive landscape

Leading Companies, Market Positioning of Companies, Competitive Strategies, and Industry Risks

Key companies profiled

American Elements, Balchem Inc., Brihans Laboratories, Chengdu Sustar Feed Co. Ltd., Global Animal Products, JH Biotech Inc., Lonza Group Ltd., Novus International Inc., Priya Chemicals, UNO Vetchem, and Zinpro Corp.

Market dynamics

Parent market analysis, market research and growth inducers and obstacles, Fast-growing and slow-growing segment analysis, COVID-19 impact and recovery analysis and future consumer dynamics, and Market condition analysis for the forecast period. 

Customization purview

If our report has not included the data that you are looking for, you can reach out to our analysts and get segments customized.

Request Free Sample

What are the Key Data Covered in this Zinc Methionine Chelates Market Report?

  • CAGR of the market during the forecast period
  • Detailed information on factors that will drive the growth of the market forecast between 2024 and 2028
  • Precise estimation of the market size and its contribution to the market in focus on the parent market
  • Accurate predictions about upcoming trends and changes in consumer behavior
  • Growth of the market across APAC, Europe, North America, Middle East and Africa, and South America
  • A thorough analysis of the market’s competitive landscape and detailed information about companies
  • Comprehensive analysis of factors that will challenge the growth of zinc methionine chelates market companies

We can help! Our analysts can customize this report to meet your requirements. Get in touch


1 Executive Summary

  • 1.1 Market overview
    • Exhibit 01: Executive Summary – Chart on Market Overview
    • Exhibit 02: Executive Summary – Data Table on Market Overview
    • Exhibit 03: Executive Summary – Chart on Global Market Characteristics
    • Exhibit 04: Executive Summary – Chart on Market by Geography
    • Exhibit 05: Executive Summary – Chart on Market Segmentation by Form Factor
    • Exhibit 06: Executive Summary – Chart on Market Segmentation by Type
    • Exhibit 07: Executive Summary – Chart on Incremental Growth
    • Exhibit 08: Executive Summary – Data Table on Incremental Growth
    • Exhibit 09: Executive Summary – Chart on Vendor Market Positioning

2 Market Landscape

  • 2.1 Market ecosystem
    • Exhibit 10: Parent market
    • Exhibit 11: Market Characteristics

3 Market Sizing

  • 3.1 Market definition
    • Exhibit 12: Offerings of vendors included in the market definition
  • 3.2 Market segment analysis
    • Exhibit 13: Market segments
  • 3.3 Market size 2023
    • 3.4 Market outlook: Forecast for 2023-2028
      • Exhibit 14: Chart on Global - Market size and forecast 2023-2028 ($ thousand)
      • Exhibit 15: Data Table on Global - Market size and forecast 2023-2028 ($ thousand)
      • Exhibit 16: Chart on Global Market: Year-over-year growth 2023-2028 (%)
      • Exhibit 17: Data Table on Global Market: Year-over-year growth 2023-2028 (%)

    4 Historic Market Size

    • 4.1 Global zinc methionine chelates market 2018 - 2022
      • Exhibit 18: Historic Market Size – Data Table on global zinc methionine chelates market 2018 - 2022 ($ thousand)
    • 4.2 Form Factor Segment Analysis 2018 - 2022
      • Exhibit 19: Historic Market Size – Form Factor Segment 2018 - 2022 ($ thousand)
    • 4.3 Type Segment Analysis 2018 - 2022
      • Exhibit 20: Historic Market Size – Type Segment 2018 - 2022 ($ thousand)
    • 4.4 Geography Segment Analysis 2018 - 2022
      • Exhibit 21: Historic Market Size – Geography Segment 2018 - 2022 ($ thousand)
    • 4.5 Country Segment Analysis 2018 - 2022
      • Exhibit 22: Historic Market Size – Country Segment 2018 - 2022 ($ thousand)

    5 Five Forces Analysis

    • 5.1 Five forces summary
      • Exhibit 23: Five forces analysis - Comparison between 2023 and 2028
    • 5.2 Bargaining power of buyers
      • Exhibit 24: Chart on Bargaining power of buyers – Impact of key factors 2023 and 2028
    • 5.3 Bargaining power of suppliers
      • Exhibit 25: Bargaining power of suppliers – Impact of key factors in 2023 and 2028
    • 5.4 Threat of new entrants
      • Exhibit 26: Threat of new entrants – Impact of key factors in 2023 and 2028
    • 5.5 Threat of substitutes
      • Exhibit 27: Threat of substitutes – Impact of key factors in 2023 and 2028
    • 5.6 Threat of rivalry
      • Exhibit 28: Threat of rivalry – Impact of key factors in 2023 and 2028
    • 5.7 Market condition
      • Exhibit 29: Chart on Market condition - Five forces 2023 and 2028

    6 Market Segmentation by Form Factor

    • 6.1 Market segments
      • Exhibit 30: Chart on Form Factor - Market share 2023-2028 (%)
      • Exhibit 31: Data Table on Form Factor - Market share 2023-2028 (%)
    • 6.2 Comparison by Form Factor
      • Exhibit 32: Chart on Comparison by Form Factor
      • Exhibit 33: Data Table on Comparison by Form Factor
    • 6.3 Powder - Market size and forecast 2023-2028
      • Exhibit 34: Chart on Powder - Market size and forecast 2023-2028 ($ thousand)
      • Exhibit 35: Data Table on Powder - Market size and forecast 2023-2028 ($ thousand)
      • Exhibit 36: Chart on Powder - Year-over-year growth 2023-2028 (%)
      • Exhibit 37: Data Table on Powder - Year-over-year growth 2023-2028 (%)
    • 6.4 Tablets - Market size and forecast 2023-2028
      • Exhibit 38: Chart on Tablets - Market size and forecast 2023-2028 ($ thousand)
      • Exhibit 39: Data Table on Tablets - Market size and forecast 2023-2028 ($ thousand)
      • Exhibit 40: Chart on Tablets - Year-over-year growth 2023-2028 (%)
      • Exhibit 41: Data Table on Tablets - Year-over-year growth 2023-2028 (%)
    • 6.5 Granules - Market size and forecast 2023-2028
      • Exhibit 42: Chart on Granules - Market size and forecast 2023-2028 ($ thousand)
      • Exhibit 43: Data Table on Granules - Market size and forecast 2023-2028 ($ thousand)
      • Exhibit 44: Chart on Granules - Year-over-year growth 2023-2028 (%)
      • Exhibit 45: Data Table on Granules - Year-over-year growth 2023-2028 (%)
    • 6.6 Market opportunity by Form Factor
      • Exhibit 46: Market opportunity by Form Factor ($ thousand)
      • Exhibit 47: Data Table on Market opportunity by Form Factor ($ thousand)

    7 Market Segmentation by Type

    • 7.1 Market segments
      • Exhibit 48: Chart on Type - Market share 2023-2028 (%)
      • Exhibit 49: Data Table on Type - Market share 2023-2028 (%)
    • 7.2 Comparison by Type
      • Exhibit 50: Chart on Comparison by Type
      • Exhibit 51: Data Table on Comparison by Type
    • 7.3 Swine - Market size and forecast 2023-2028
      • Exhibit 52: Chart on Swine - Market size and forecast 2023-2028 ($ thousand)
      • Exhibit 53: Data Table on Swine - Market size and forecast 2023-2028 ($ thousand)
      • Exhibit 54: Chart on Swine - Year-over-year growth 2023-2028 (%)
      • Exhibit 55: Data Table on Swine - Year-over-year growth 2023-2028 (%)
    • 7.4 Poultry - Market size and forecast 2023-2028
      • Exhibit 56: Chart on Poultry - Market size and forecast 2023-2028 ($ thousand)
      • Exhibit 57: Data Table on Poultry - Market size and forecast 2023-2028 ($ thousand)
      • Exhibit 58: Chart on Poultry - Year-over-year growth 2023-2028 (%)
      • Exhibit 59: Data Table on Poultry - Year-over-year growth 2023-2028 (%)
    • 7.5 Bovine - Market size and forecast 2023-2028
      • Exhibit 60: Chart on Bovine - Market size and forecast 2023-2028 ($ thousand)
      • Exhibit 61: Data Table on Bovine - Market size and forecast 2023-2028 ($ thousand)
      • Exhibit 62: Chart on Bovine - Year-over-year growth 2023-2028 (%)
      • Exhibit 63: Data Table on Bovine - Year-over-year growth 2023-2028 (%)
    • 7.6 Others - Market size and forecast 2023-2028
      • Exhibit 64: Chart on Others - Market size and forecast 2023-2028 ($ thousand)
      • Exhibit 65: Data Table on Others - Market size and forecast 2023-2028 ($ thousand)
      • Exhibit 66: Chart on Others - Year-over-year growth 2023-2028 (%)
      • Exhibit 67: Data Table on Others - Year-over-year growth 2023-2028 (%)
    • 7.7 Market opportunity by Type
      • Exhibit 68: Market opportunity by Type ($ thousand)
      • Exhibit 69: Data Table on Market opportunity by Type ($ thousand)

    8 Customer Landscape

    • 8.1 Customer landscape overview
      • Exhibit 70: Analysis of price sensitivity, lifecycle, customer purchase basket, adoption rates, and purchase criteria

    9 Geographic Landscape

    • 9.1 Geographic segmentation
      • Exhibit 71: Chart on Market share by geography 2023-2028 (%)
      • Exhibit 72: Data Table on Market share by geography 2023-2028 (%)
    • 9.2 Geographic comparison
      • Exhibit 73: Chart on Geographic comparison
      • Exhibit 74: Data Table on Geographic comparison
    • 9.3 APAC - Market size and forecast 2023-2028
      • Exhibit 75: Chart on APAC - Market size and forecast 2023-2028 ($ thousand)
      • Exhibit 76: Data Table on APAC - Market size and forecast 2023-2028 ($ thousand)
      • Exhibit 77: Chart on APAC - Year-over-year growth 2023-2028 (%)
      • Exhibit 78: Data Table on APAC - Year-over-year growth 2023-2028 (%)
    • 9.4 Europe - Market size and forecast 2023-2028
      • Exhibit 79: Chart on Europe - Market size and forecast 2023-2028 ($ thousand)
      • Exhibit 80: Data Table on Europe - Market size and forecast 2023-2028 ($ thousand)
      • Exhibit 81: Chart on Europe - Year-over-year growth 2023-2028 (%)
      • Exhibit 82: Data Table on Europe - Year-over-year growth 2023-2028 (%)
    • 9.5 North America - Market size and forecast 2023-2028
      • Exhibit 83: Chart on North America - Market size and forecast 2023-2028 ($ thousand)
      • Exhibit 84: Data Table on North America - Market size and forecast 2023-2028 ($ thousand)
      • Exhibit 85: Chart on North America - Year-over-year growth 2023-2028 (%)
      • Exhibit 86: Data Table on North America - Year-over-year growth 2023-2028 (%)
    • 9.6 Middle East and Africa - Market size and forecast 2023-2028
      • Exhibit 87: Chart on Middle East and Africa - Market size and forecast 2023-2028 ($ thousand)
      • Exhibit 88: Data Table on Middle East and Africa - Market size and forecast 2023-2028 ($ thousand)
      • Exhibit 89: Chart on Middle East and Africa - Year-over-year growth 2023-2028 (%)
      • Exhibit 90: Data Table on Middle East and Africa - Year-over-year growth 2023-2028 (%)
    • 9.7 South America - Market size and forecast 2023-2028
      • Exhibit 91: Chart on South America - Market size and forecast 2023-2028 ($ thousand)
      • Exhibit 92: Data Table on South America - Market size and forecast 2023-2028 ($ thousand)
      • Exhibit 93: Chart on South America - Year-over-year growth 2023-2028 (%)
      • Exhibit 94: Data Table on South America - Year-over-year growth 2023-2028 (%)
    • 9.8 China - Market size and forecast 2023-2028
      • Exhibit 95: Chart on China - Market size and forecast 2023-2028 ($ thousand)
      • Exhibit 96: Data Table on China - Market size and forecast 2023-2028 ($ thousand)
      • Exhibit 97: Chart on China - Year-over-year growth 2023-2028 (%)
      • Exhibit 98: Data Table on China - Year-over-year growth 2023-2028 (%)
    • 9.9 US - Market size and forecast 2023-2028
      • Exhibit 99: Chart on US - Market size and forecast 2023-2028 ($ thousand)
      • Exhibit 100: Data Table on US - Market size and forecast 2023-2028 ($ thousand)
      • Exhibit 101: Chart on US - Year-over-year growth 2023-2028 (%)
      • Exhibit 102: Data Table on US - Year-over-year growth 2023-2028 (%)
    • 9.10 Germany - Market size and forecast 2023-2028
      • Exhibit 103: Chart on Germany - Market size and forecast 2023-2028 ($ thousand)
      • Exhibit 104: Data Table on Germany - Market size and forecast 2023-2028 ($ thousand)
      • Exhibit 105: Chart on Germany - Year-over-year growth 2023-2028 (%)
      • Exhibit 106: Data Table on Germany - Year-over-year growth 2023-2028 (%)
    • 9.11 Japan - Market size and forecast 2023-2028
      • Exhibit 107: Chart on Japan - Market size and forecast 2023-2028 ($ thousand)
      • Exhibit 108: Data Table on Japan - Market size and forecast 2023-2028 ($ thousand)
      • Exhibit 109: Chart on Japan - Year-over-year growth 2023-2028 (%)
      • Exhibit 110: Data Table on Japan - Year-over-year growth 2023-2028 (%)
    • 9.12 India - Market size and forecast 2023-2028
      • Exhibit 111: Chart on India - Market size and forecast 2023-2028 ($ thousand)
      • Exhibit 112: Data Table on India - Market size and forecast 2023-2028 ($ thousand)
      • Exhibit 113: Chart on India - Year-over-year growth 2023-2028 (%)
      • Exhibit 114: Data Table on India - Year-over-year growth 2023-2028 (%)
    • 9.13 Market opportunity by geography
      • Exhibit 115: Market opportunity by geography ($ thousand)
      • Exhibit 116: Data Tables on Market opportunity by geography ($ thousand)

    10 Drivers, Challenges, and Trends

    • 10.1 Market drivers
      • 10.2 Market challenges
        • 10.3 Impact of drivers and challenges
          • Exhibit 117: Impact of drivers and challenges in 2023 and 2028
        • 10.4 Market trends

          11 Vendor Landscape

          • 11.1 Overview
            • 11.2 Vendor landscape
              • Exhibit 118: Overview on Criticality of inputs and Factors of differentiation
            • 11.3 Landscape disruption
              • Exhibit 119: Overview on factors of disruption
            • 11.4 Industry risks
              • Exhibit 120: Impact of key risks on business

            12 Vendor Analysis

            • 12.1 Vendors covered
              • Exhibit 121: Vendors covered
            • 12.2 Market positioning of vendors
              • Exhibit 122: Matrix on vendor position and classification
            • 12.3 American Elements
              • Exhibit 123: American Elements - Overview
              • Exhibit 124: American Elements - Product / Service
              • Exhibit 125: American Elements - Key offerings
            • 12.4 Balchem Inc.
              • Exhibit 126: Balchem Inc. - Overview
              • Exhibit 127: Balchem Inc. - Business segments
              • Exhibit 128: Balchem Inc. - Key offerings
              • Exhibit 129: Balchem Inc. - Segment focus
            • 12.5 Brihans Laboratories
              • Exhibit 130: Brihans Laboratories - Overview
              • Exhibit 131: Brihans Laboratories - Product / Service
              • Exhibit 132: Brihans Laboratories - Key offerings
            • 12.6 Chengdu Sustar Feed Co. Ltd.
              • Exhibit 133: Chengdu Sustar Feed Co. Ltd. - Overview
              • Exhibit 134: Chengdu Sustar Feed Co. Ltd. - Product / Service
              • Exhibit 135: Chengdu Sustar Feed Co. Ltd. - Key offerings
            • 12.7 Global Animal Products
              • Exhibit 136: Global Animal Products - Overview
              • Exhibit 137: Global Animal Products - Product / Service
              • Exhibit 138: Global Animal Products - Key offerings
            • 12.8 JH Biotech Inc.
              • Exhibit 139: JH Biotech Inc. - Overview
              • Exhibit 140: JH Biotech Inc. - Product / Service
              • Exhibit 141: JH Biotech Inc. - Key offerings
            • 12.9 Lonza Group Ltd.
              • Exhibit 142: Lonza Group Ltd. - Overview
              • Exhibit 143: Lonza Group Ltd. - Business segments
              • Exhibit 144: Lonza Group Ltd. - Key news
              • Exhibit 145: Lonza Group Ltd. - Key offerings
              • Exhibit 146: Lonza Group Ltd. - Segment focus
            • 12.10 Novus International Inc.
              • Exhibit 147: Novus International Inc. - Overview
              • Exhibit 148: Novus International Inc. - Product / Service
              • Exhibit 149: Novus International Inc. - Key offerings
            • 12.11 Priya Chemicals
              • Exhibit 150: Priya Chemicals - Overview
              • Exhibit 151: Priya Chemicals - Product / Service
              • Exhibit 152: Priya Chemicals - Key offerings
            • 12.12 UNO Vetchem
              • Exhibit 153: UNO Vetchem - Overview
              • Exhibit 154: UNO Vetchem - Product / Service
              • Exhibit 155: UNO Vetchem - Key offerings
            • 12.13 Zinpro Corp.
              • Exhibit 156: Zinpro Corp. - Overview
              • Exhibit 157: Zinpro Corp. - Product / Service
              • Exhibit 158: Zinpro Corp. - Key offerings

            13 Appendix

            • 13.1 Scope of the report
              • 13.2 Inclusions and exclusions checklist
                • Exhibit 159: Inclusions checklist
                • Exhibit 160: Exclusions checklist
              • 13.3 Currency conversion rates for US$
                • Exhibit 161: Currency conversion rates for US$
              • 13.4 Research methodology
                • Exhibit 162: Research methodology
                • Exhibit 163: Validation techniques employed for market sizing
                • Exhibit 164: Information sources
              • 13.5 List of abbreviations
                • Exhibit 165: List of abbreviations

              Research Methodology

              Technavio presents a detailed picture of the market by way of study, synthesis, and summation of data from multiple sources. The analysts have presented the various facets of the market with a particular focus on identifying the key industry influencers. The data thus presented is comprehensive, reliable, and the result of extensive research, both primary and secondary.

              INFORMATION SOURCES

              Primary sources

              • Manufacturers and suppliers
              • Channel partners
              • Industry experts
              • Strategic decision makers

              Secondary sources

              • Industry journals and periodicals
              • Government data
              • Financial reports of key industry players
              • Historical data
              • Press releases

              DATA ANALYSIS

              Data Synthesis

              • Collation of data
              • Estimation of key figures
              • Analysis of derived insights

              Data Validation

              • Triangulation with data models
              • Reference against proprietary databases
              • Corroboration with industry experts

              REPORT WRITING

              Qualitative

              • Market drivers
              • Market challenges
              • Market trends
              • Five forces analysis

              Quantitative

              • Market size and forecast
              • Market segmentation
              • Geographical insights
              • Competitive landscape

              Interested in this report?

              Get your sample now to see our research methodology and insights!

              Download Now

              Frequently Asked Questions

              Zinc Methionine Chelates market growth will increase by $ 6.12 th during 2024-2028 .

              The Zinc Methionine Chelates market is expected to grow at a CAGR of 6.89% during 2024-2028 .

              Zinc Methionine Chelates market is segmented by Form Factor( Powder, Tablets, Granules) Type( Swine, Poultry, Bovine, Others)

              American Elements, Balchem Inc., Brihans Laboratories, Chengdu Sustar Feed Co. Ltd., Global Animal Products, JH Biotech Inc., Lonza Group Ltd., Novus International Inc., Priya Chemicals, UNO Vetchem, Zinpro Corp. are a few of the key vendors in the Zinc Methionine Chelates market.

              APAC will register the highest growth rate of 42% among the other regions. Therefore, the Zinc Methionine Chelates market in APAC is expected to garner significant business opportunities for the vendors during the forecast period.

              US, China, Japan, India, Germany

              • Rise in global meat consumptionThe steady increase in the consumption of meat is a major factor driving the feed additives including zinc methionine chelates. The global per capita consumption of meat has grown at a steady rate in the past decade. According to the Organization for Economic Co-operation and Development (OECD) is the driving factor this market.
              • the global production of meat (beef is the driving factor this market.
              • poultry is the driving factor this market.
              • and pork) in 2021 was 340 million tons compared with nearly 248 million in 2018. The rise in the population also drives the global meat market and has increased production capacity and supply. Moreover is the driving factor this market.
              • people have become more conscious about protein intake in their daily diet. This has led to an increase in meat consumption. The consumption of meat products has become a vital factor as nutrition boosts the well-being of people.  There has been a significant increase in meat production and consumption is the driving factor this market.
              • particularly in developing countries such as China and India. Rapid urbanization and changing consumer preferences regarding the consumption of meat have also led to an increase in the demand for zinc methionine chelates as producers aim to improve the efficiency and quality of their production processes. The majority of the global rise in meat production and consumption is from APAC and MEA. The healthy economic growth in these regions has boosted the production and consumption of meat is the driving factor this market.
              • which is the driving factor this market.
              • in turn is the driving factor this market.
              • is expected to drive the growth of the global zinc methionine chelates market during the forecast period. is the driving factor this market.

              The Zinc Methionine Chelates market vendors should focus on grabbing business opportunities from the Powder segment as it accounted for the largest market share in the base year.