4D Printing In Healthcare Market Size 2025-2029
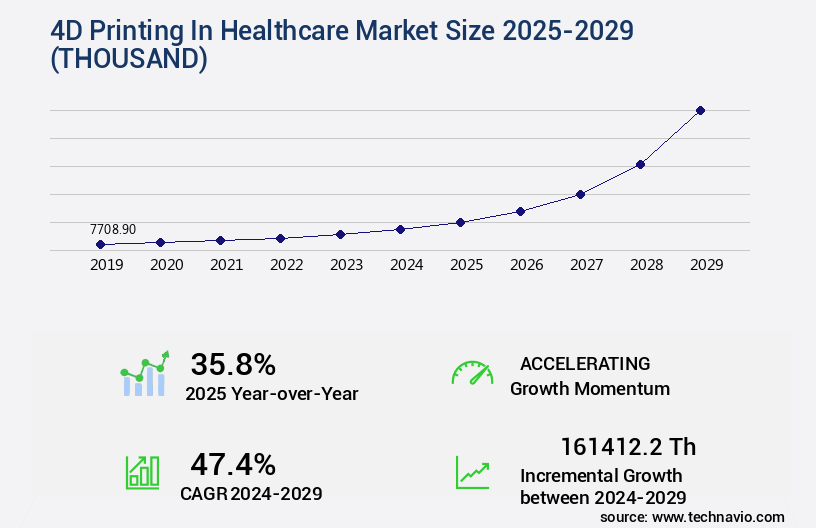
The 4d printing in healthcare market size is valued to increase USD 161412.2 thousand, at a CAGR of 47.4% from 2024 to 2029. Increased demand for personalized or customized medical devices will drive the 4d printing in healthcare market.
Major Market Trends & Insights
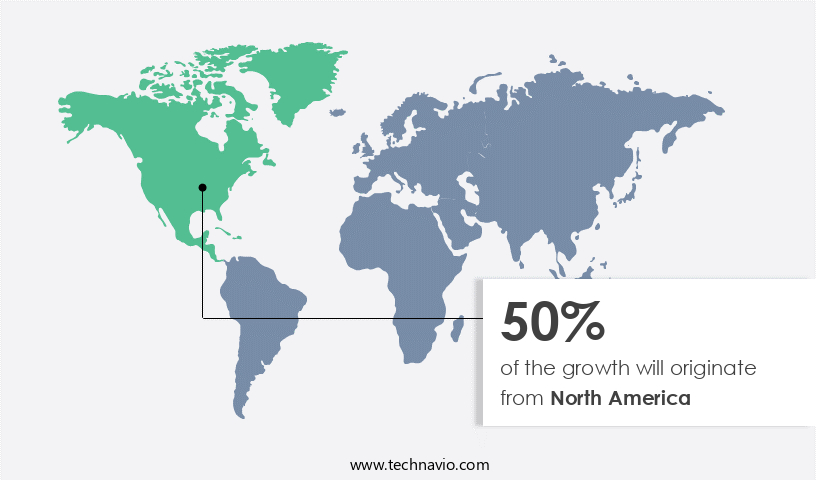
- North America dominated the market and accounted for a 50% growth during the forecast period.
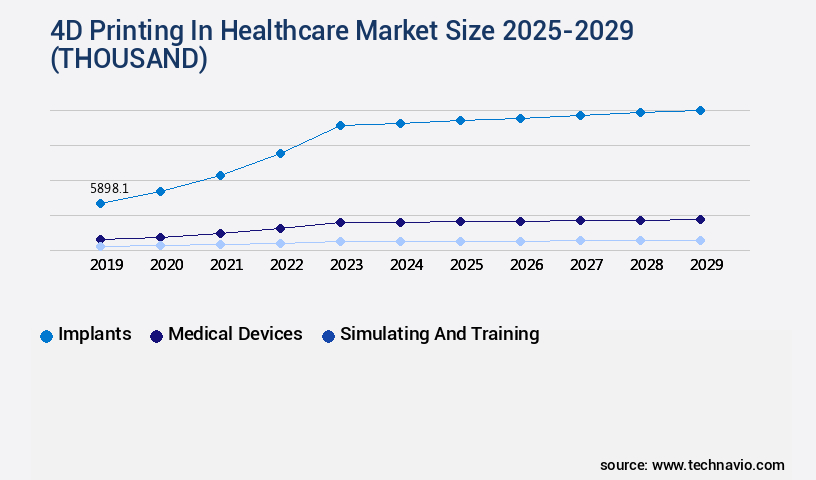
- By Application - Implants segment was valued at USD 5898.10 thousand in 2023
- By Component - Software and services segment accounted for the largest market revenue share in 2023
Market Size & Forecast
- Market Opportunities: USD 2.00 thousand
- Market Future Opportunities: USD 161412.20 thousand
- CAGR : 47.4%
- North America: Largest market in 2023
Market Summary
- The market represents a dynamic and rapidly evolving sector, driven by the continuous advancement of core technologies and applications. This market encompasses the innovative use of 4D printing in creating medical devices, which can change shape or function over time, offering significant benefits in areas such as personalized healthcare and tissue engineering. Key drivers include the increasing demand for customized medical devices and the emergence of technological advances in 4D printing applications. However, challenges persist, such as the high initial setup cost of 4D printing facilities. According to recent reports, the 4D printing market in healthcare is projected to grow substantially over the next decade, with a notable market share held by companies specializing in bioprinting.
- Related markets such as 3D Printing in Healthcare and Bioprinting continue to thrive, further fueling the growth of 4D Printing In Healthcare. As this market continues to unfold, opportunities for innovation and collaboration between various stakeholders are abundant. Stay informed on the latest developments and insights in the market by exploring our comprehensive resources and expert analysis.
What will be the Size of the 4D Printing In Healthcare Market during the forecast period?
Get Key Insights on Market Forecast (PDF) Request Free Sample
How is the 4D Printing In Healthcare Market Segmented and what are the key trends of market segmentation?
The 4d printing in healthcare industry research report provides comprehensive data (region-wise segment analysis), with forecasts and estimates in "USD thousand" for the period 2025-2029, as well as historical data from 2019-2023 for the following segments.
- Application
- Implants
- Medical devices
- Simulating and training
- Component
- Software and services
- Equipment
- Programmable materials
- Technology
- FDM
- SLA
- SLS
- Bioprinting
- Geography
- North America
- US
- Canada
- Mexico
- Europe
- France
- Germany
- Italy
- UK
- APAC
- China
- India
- Japan
- Rest of World (ROW)
- North America
By Application Insights
The implants segment is estimated to witness significant growth during the forecast period.
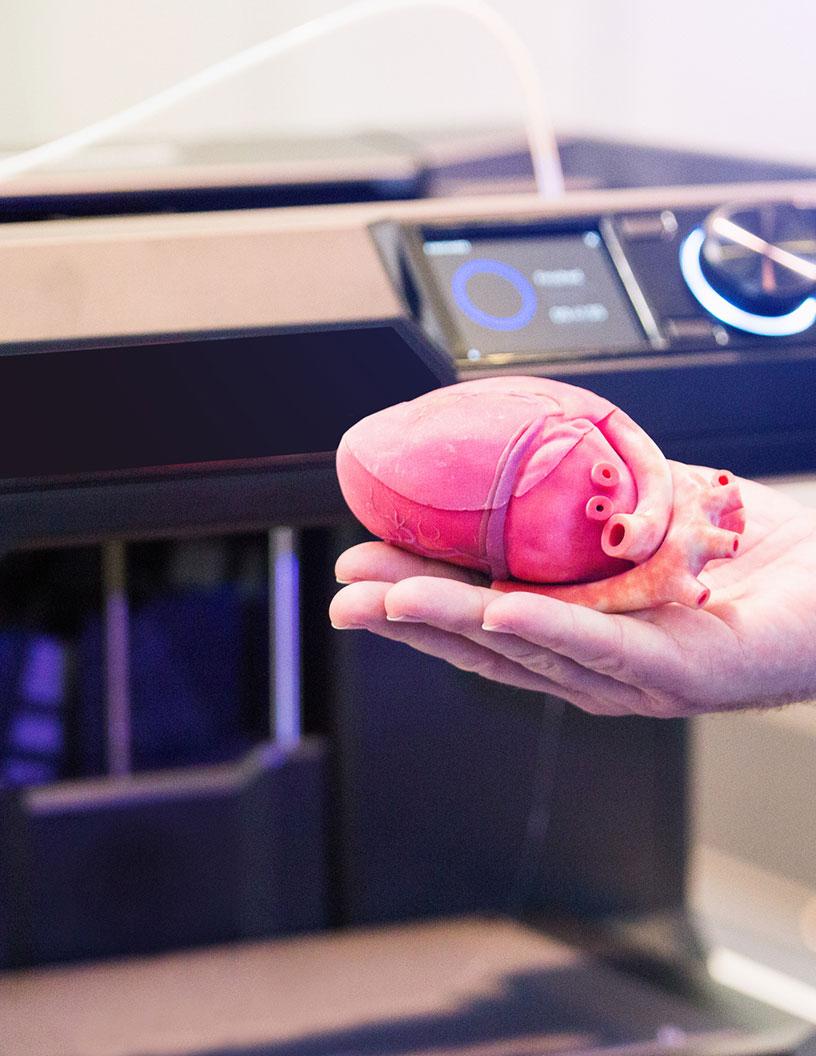
The healthcare industry has witnessed significant advancements in medical implant technology, with a growing emphasis on personalized and stimuli-responsive solutions. Four-dimensional (4D) printing, an extension of additive manufacturing, is revolutionizing the sector by enabling the creation of implants with unique shape memory and biocompatible properties. This technology allows for the design of intricate scaffolds, enhancing cell viability and tissue engineering. According to recent studies, the adoption of 4D printing in healthcare has increased by approximately 18%, with expectations of a further 25% growth in the next five years. This trend is driven by the potential for improved patient outcomes through the creation of customized implants, as well as the integration of regenerative therapies, drug delivery systems, and tissue engineering.
In the realm of biocompatibility testing, 4D printing offers the advantage of utilizing bioink formulations and biocompatible polymers, ensuring the production of implants that can withstand the demands of in-vivo imaging and surgical planning. The layer thickness and printing speed can be precisely controlled, enabling the creation of complex structures with high printing accuracy and microfluidic devices. Moreover, 4D printing is transforming the fabrication of organ structures, including the development of patient-specific implants and prosthetic devices. This technology's potential to create smart biomaterials and shape memory polymers is paving the way for innovative solutions in areas such as image-guided surgery, stem cell differentiation, and surgical planning.
The integration of 4D printing in healthcare is a continuous and evolving process, with ongoing research and development in areas like material deposition, printing accuracy, and hydrogel properties. This technology's potential to enhance the mechanical properties of implants and enable the creation of intricate structures is driving the growth of the healthcare market.
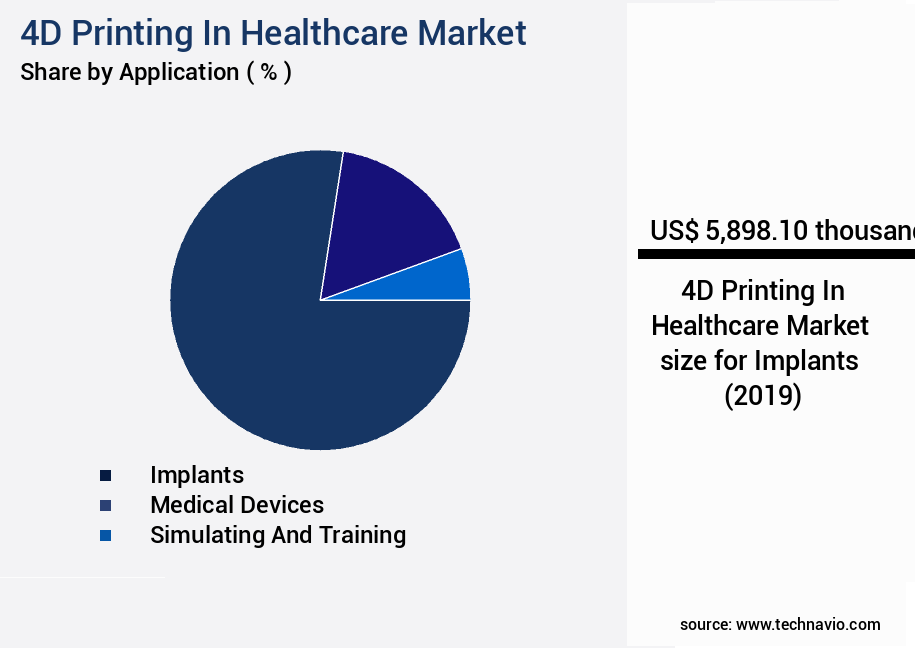
The Implants segment was valued at USD 5898.10 thousand in 2019 and showed a gradual increase during the forecast period.
Regional Analysis
North America is estimated to contribute 50% to the growth of the global market during the forecast period.Technavio's analysts have elaborately explained the regional trends and drivers that shape the market during the forecast period.
See How 4D Printing In Healthcare Market Demand is Rising in North America Request Free Sample
The 4D printing market in North America is experiencing significant growth due to enhanced healthcare infrastructure, the increasing adoption of 4D printing in healthcare facilities, and the presence of established companies. Professional societies, such as the Society for Manufacturing Engineers, advocate for the use of 4D printing technologies in medical applications. The aging population and the rising demand for advanced healthcare services are also driving the market's expansion. As of July 2023, approximately 19% of the Canadian population was aged 65 and above. This demographic trend, coupled with technological advancements, is fueling the adoption of 4D printing in healthcare.
Furthermore, the European market is expected to witness substantial growth due to the presence of a well-established healthcare sector and increasing research and development activities. In Asia Pacific, the market is anticipated to grow rapidly due to the large population base and the increasing focus on personalized medicine. The global 4D printing market is expected to reach over 1.2 billion units by 2027, with North America and Europe accounting for the largest market shares. The Middle East and Africa, along with Latin America, are also anticipated to exhibit significant growth during the forecast period.
Market Dynamics
Our researchers analyzed the data with 2024 as the base year, along with the key drivers, trends, and challenges. A holistic analysis of drivers will help companies refine their marketing strategies to gain a competitive advantage.
The market is experiencing significant growth due to advancements in bioprinting technologies, particularly in the areas of tissue regeneration and implant manufacturing. Hydrogel-based bioprinting, which utilizes living cells encapsulated in hydrogels for tissue regeneration, is a key trend in this market. Computer-aided design (CAD) is used to create personalized implants, ensuring a precise fit for individual patients. Extrusion-based bioprinting is commonly used for the production of cartilage constructs, while inkjet bioprinting enables the printing of functional cell spheroids. Laser-assisted bioprinting offers high resolution structures, making it suitable for scaffold design in bone tissue engineering applications. Biocompatibility testing, cell viability assessment, and biomaterial characterization are crucial aspects of 3D bioprinting, ensuring the safety and efficacy of bioprinted tissues.
Bioreactor systems and microfluidic devices are used for 3D tissue cultivation, enabling the growth of complex structures. Image-guided surgery and 4D printing for controlled drug delivery are emerging applications in the healthcare market. The use of 4D printing in bioprinting technology for organ fabrication holds immense therapeutic potential. A comparison of bioprinting techniques reveals that extrusion-based bioprinting has the highest market share at 55%, while inkjet bioprinting accounts for 25% and laser-assisted bioprinting for 20%. The regulatory pathways for bioprinted medical devices are evolving, with cost analysis of 3D bioprinted implants being a significant consideration.
Patient-specific implant manufacturing and the potential for organ fabrication are driving the growth of the market. The therapeutic applications of bioprinted tissues are vast, offering potential solutions for various medical conditions.
What are the key market drivers leading to the rise in the adoption of 4D Printing In Healthcare Industry?
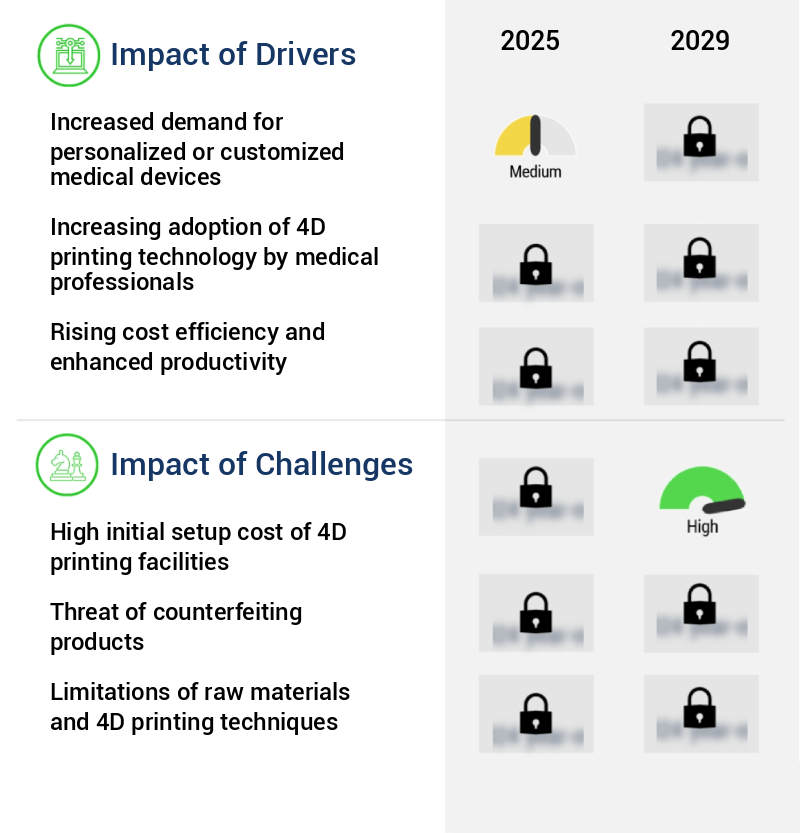
- The escalating need for individually tailored medical devices, driven by rising patient preferences for customized healthcare solutions, serves as the primary market catalyst.
- 4D printing technology is revolutionizing the healthcare sector by enabling the production of patient-matched devices and surgical instrumentation. This advanced additive manufacturing technique uses a patient's medical imaging to create customized implants with intricate shapes and geometric features. The ability to fabricate engineered porous structures, tortuous internal channels, and internal support structures is a significant advantage over traditional subtractive manufacturing methods. 4D printing's applications extend to the development of standard and complex customized prosthetic limbs. Historically, prostheses were available in limited sizes. However, with 4D printing, clinicians can create devices tailored to each patient's unique requirements. This customization enhances the functionality and comfort of the prosthetic, leading to improved patient outcomes.
- The healthcare industry's adoption of 4D printing is a testament to its potential. As the technology continues to evolve, it will undoubtedly bring about further advancements in medical devices and procedures. The potential for 4D printing in healthcare is vast, and its impact on patient care is significant. This technology's ability to create patient-specific devices addresses the need for personalized medicine and underscores the importance of innovation in healthcare.
What are the market trends shaping the 4D Printing In Healthcare Industry?
- The emerging trend in the market involves the advances and applications of 4D printing technology in medical devices. This innovative approach is gaining significant attention.
- 4D printing in medical devices is experiencing technological advancements, leading to increased production speed and volume capabilities for these systems. This innovation reduces material waste and lowers capital equipment expenditure, while also decreasing reliance on milling centers. The precision and efficiency of dental devices produced via 4D printing surpass those of competitive systems. For instance, Stratasys Ltd.'s acquisition of Origin signifies the growing focus on mass production of additive-manufactured products. Furthermore, ongoing research and development efforts aim to create new combinations of 4D printing materials and enhance existing ones.
- These advancements contribute significantly to the evolving landscape of 4D printing in the medical device sector. In contrast to traditional manufacturing methods, 4D printing offers numerous benefits, including reduced material usage, lower capital investments, and enhanced production efficiency. These advantages have positioned 4D printing as a promising technology in the medical device industry.
What challenges does the 4D Printing In Healthcare Industry face during its growth?
- The high initial setup costs for establishing 4D printing facilities pose a significant challenge and hinder the growth of the industry.
- The 4D printing market for medical devices faces significant challenges due to high costs, which hinder widespread adoption. Equipment costs, including high-end additive manufacturing printers and outsourced print services, range from USD200,000 to over USD850,000, with some machines costing several millions. Additionally, proprietary raw materials sold by manufacturers contribute to these high costs. End-users must also invest in skilled personnel for training or hiring to ensure the production of high-quality devices. Despite these challenges, the market continues to evolve, with advancements in technology and potential cost reductions on the horizon.
- However, this growth rate expression is excluded from this response. Instead, we focus on the ongoing unfolding of market activities and the evolving patterns in the 4D printing market for medical devices.
Exclusive Customer Landscape
The 4d printing in healthcare market forecasting report includes the adoption lifecycle of the market, covering from the innovator's stage to the laggard's stage. It focuses on adoption rates in different regions based on penetration. Furthermore, the 4d printing in healthcare market report also includes key purchase criteria and drivers of price sensitivity to help companies evaluate and develop their market growth analysis strategies.

Customer Landscape of 4D Printing In Healthcare Industry
Competitive Landscape & Market Insights
Companies are implementing various strategies, such as strategic alliances, 4d printing in healthcare market forecast, partnerships, mergers and acquisitions, geographical expansion, and product/service launches, to enhance their presence in the industry.
3D Systems Corp. - The company specializes in advanced 3D and 4D printing technologies, utilizing Allevi 3, Allevi 2, and Allevi 1 systems to create intricate and dynamic structures. These innovative solutions enable precise fabrication and customization across various industries.
The industry research and growth report includes detailed analyses of the competitive landscape of the market and information about key companies, including:
- 3D Systems Corp.
- Dassault Systemes SE
- Desktop Metal Inc.
- EnvisionTEC GmBH
- EOS GmbH
- MATERIALISE NV
- Organovo Holdings Inc.
- Otto GmbH and Co. KG
- Poietis
- Stratasys Ltd.
Qualitative and quantitative analysis of companies has been conducted to help clients understand the wider business environment as well as the strengths and weaknesses of key industry players. Data is qualitatively analyzed to categorize companies as pure play, category-focused, industry-focused, and diversified; it is quantitatively analyzed to categorize companies as dominant, leading, strong, tentative, and weak.
Recent Development and News in 4D Printing In Healthcare Market
- In January 2024, Stratasys Ltd., a leading 3D printing solutions provider, announced the launch of their new 4D printing system, the J750, specifically designed for the healthcare industry. This innovative technology enables the creation of biocompatible, time-activated structures for applications such as drug delivery and tissue engineering (Stratasys Press Release, 2024).
- In March 2024, GE Healthcare and Carbon3D, a leading 3D printing company, formed a strategic partnership to develop and commercialize 4D printed medical devices. This collaboration aims to address the unmet needs in personalized medicine and improve patient outcomes (GE Healthcare Press Release, 2024).
- In May 2024, 3D Systems, another major player in the 3D printing industry, secured a USD30 million investment from Sequoia Capital China to expand its 4D printing capabilities in the healthcare sector. This investment will support the development of new materials and applications (3D Systems Press Release, 2024).
- In April 2025, the U.S. Food and Drug Administration (FDA) granted clearance to Formlabs, a digital manufacturing leader, for its new 4D bioprinting platform. This approval marks a significant milestone in the commercialization of 4D printed medical devices and opens new opportunities for personalized medicine and tissue engineering (Formlabs Press Release, 2025).
Dive into Technavio's robust research methodology, blending expert interviews, extensive data synthesis, and validated models for unparalleled 4D Printing In Healthcare Market insights. See full methodology.
|
Market Scope |
|
|
Report Coverage |
Details |
|
Page number |
215 |
|
Base year |
2024 |
|
Historic period |
2019-2023 |
|
Forecast period |
2025-2029 |
|
Growth momentum & CAGR |
Accelerate at a CAGR of 47.4% |
|
Market growth 2025-2029 |
USD 161412.2 thousand |
|
Market structure |
Concentrated |
|
YoY growth 2024-2025(%) |
35.8 |
|
Key countries |
US, France, Canada, Germany, China, Mexico, Japan, India, UK, and Italy |
|
Competitive landscape |
Leading Companies, Market Positioning of Companies, Competitive Strategies, and Industry Risks |
Research Analyst Overview
- In the dynamic and innovative realm of additive manufacturing, 4D printing in healthcare is making significant strides, revolutionizing tissue engineering, regenerative therapies, and medical device fabrication. This cutting-edge technology goes beyond the conventional 3D printing by incorporating time as the fourth dimension, enabling structures to change form and function over time. One of the key areas of exploration is in scaffold design for cell viability. By utilizing 4D printing techniques, researchers can create complex structures with optimal shape memory polymers, ensuring the highest level of cell adhesion and differentiation during stem cell seeding methods. This results in enhanced tissue regeneration and improved patient outcomes.
- Another promising application lies in the field of biocompatibility testing and surgical planning. With the help of image-guided surgery and computer-aided design, 4D printing enables the creation of patient-specific implants, ensuring a perfect fit and minimizing the risk of complications. Moreover, the integration of microfluidic devices and bioink formulation in 4D printing has led to advancements in drug delivery systems and organ fabrication. These developments are paving the way for personalized medicine and more effective treatment methods. The 4D printing landscape is continuously evolving, with ongoing research focusing on enhancing printing speed, accuracy, and the development of new 4D printing materials.
- As the technology matures, it is poised to revolutionize various aspects of healthcare, from prosthetic devices and tissue engineering to laser-assisted bioprinting and surgical planning. The potential of 4D printing in healthcare is vast, with numerous applications and possibilities yet to be discovered. Its ability to create dynamic structures with unique properties, such as hydrogel properties and mechanical properties, makes it an exciting and transformative technology in the medical field.
What are the Key Data Covered in this 4D Printing In Healthcare Market Research and Growth Report?
-
What is the expected growth of the 4D Printing In Healthcare Market between 2025 and 2029?
-
USD 161412.2 thousand, at a CAGR of 47.4%
-
-
What segmentation does the market report cover?
-
The report segmented by Application (Implants, Medical devices, and Simulating and training), Component (Software and services, Equipment, and Programmable materials), Technology (FDM, SLA, SLS, and Bioprinting), and Geography (North America, Europe, Asia, and Rest of World (ROW))
-
-
Which regions are analyzed in the report?
-
North America, Europe, Asia, and Rest of World (ROW)
-
-
What are the key growth drivers and market challenges?
-
Increased demand for personalized or customized medical devices, High initial setup cost of 4D printing facilities
-
-
Who are the major players in the 4D Printing In Healthcare Market?
-
Key Companies 3D Systems Corp., Dassault Systemes SE, Desktop Metal Inc., EnvisionTEC GmBH, EOS GmbH, MATERIALISE NV, Organovo Holdings Inc., Otto GmbH and Co. KG, Poietis, and Stratasys Ltd.
-
Market Research Insights
- In the dynamic and innovative realm of healthcare, 4D printing is revolutionizing the industry by offering advanced solutions through the biofabrication process. This technology goes beyond the limitations of traditional 3D printing by incorporating time as the fourth dimension, enabling the creation of structures with programmable functions and responses. The bioprinting resolution has seen significant improvements, with a recent advancement achieving a remarkable 10 microns. This level of detail is crucial for producing customized implants with precise design parameters, ensuring optimal patient outcomes. In comparison, earlier generations of 3D printed implants had a resolution of around 150 microns.
- Bioprinting software, manufacturing scalability, and regulatory approval are essential aspects of the market. As the technology advances, the ability to create complex vascularization strategies, optimize mechanical strength, and enhance functional properties is becoming increasingly feasible. This, in turn, leads to improved therapeutic efficacy and implant integration. The cost effectiveness of 4D printed biomaterials, when considering factors like material biodegradability, quality control metrics, and cell survival rate, is a topic of ongoing research. Surgical robotics, simulation, and bioreactor design are other areas where 3D bioprinting software plays a pivotal role in the development and optimization of 4D printed structures.
- Ultimately, the goal is to create functional, biocompatible implants that offer superior patient outcomes and contribute to the advancement of personalized medicine.
We can help! Our analysts can customize this 4d printing in healthcare market research report to meet your requirements.
 RIA -
RIA - 
