Biomaterials Market Analysis, Size, and Forecast 2026-2030: North America (US, Canada, and Mexico), Europe (Germany, France, and UK), APAC (China, Japan, and India), South America (Brazil, Argentina, and Colombia), Middle East and Africa (Saudi Arabia, South Africa, and UAE), Asia, Rest of World (ROW)

Biomaterials Market Analysis, Size, and Forecast 2026-2030:
North America (US, Canada, and Mexico), Europe (Germany, France, and UK), APAC (China, Japan, and India), South America (Brazil, Argentina, and Colombia), Middle East and Africa (Saudi Arabia, South Africa, and UAE), Asia, Rest of World (ROW)

Published: Dec 2025 305 Pages SKU: IRTNTR71630

Market Overview at a Glance

$14.65 B
Market Opportunity
5.9%
CAGR 2025 - 2030
41%
North America Growth
$17.14 B
Metallic segment 2024

Biomaterials Market Size 2026-2030

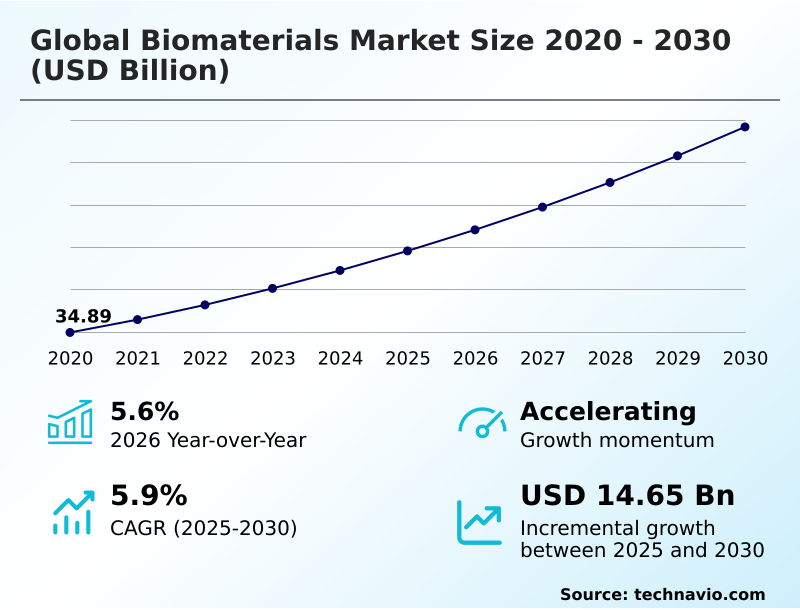
The biomaterials market size is valued to increase by USD 14.65 billion, at a CAGR of 5.9% from 2025 to 2030. Rising demand for advanced implants and regenerative medical solutions will drive the biomaterials market.

Major Market Trends & Insights

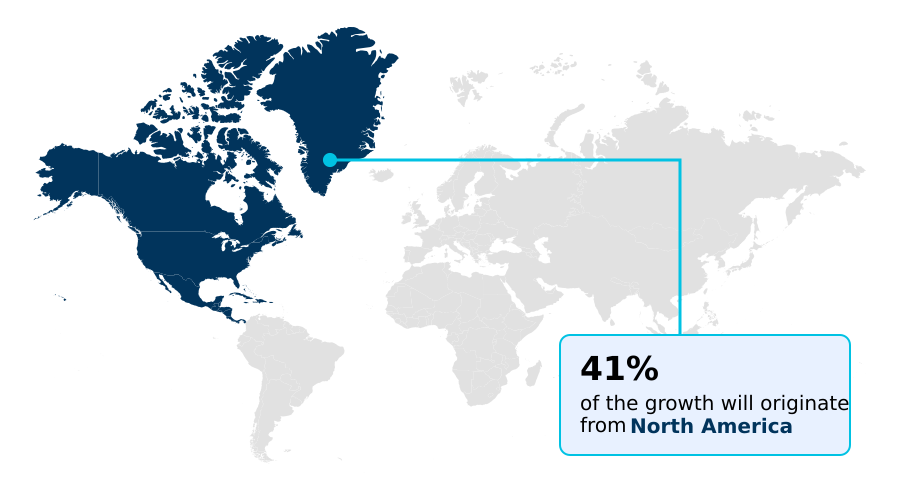
  • North America dominated the market and accounted for a 41% growth during the forecast period.
  • By Type - Metallic segment was valued at USD 17.14 billion in 2024
  • By Application - Orthopedic segment accounted for the largest market revenue share in 2024

Market Size & Forecast

  • Market Opportunities: USD 24.29 billion
  • Market Future Opportunities: USD 14.65 billion
  • CAGR from 2025 to 2030 : 5.9%

Market Summary

  • The biomaterials market is driven by the convergence of medical need and material science innovation, creating materials engineered for biological interaction. Demand stems from an aging population and the prevalence of chronic conditions requiring medical implants, advanced wound care, and regenerative therapies.
  • Key advancements in bioresorbable polymers, bioactive ceramics, and nanotechnology in biomaterials are expanding the scope of what is clinically possible. A major trend is the shift toward personalized medicine, exemplified by the use of 3d bioprinting to create patient-specific implants.
  • For instance, a hospital can now use a patient's imaging data to design and print a custom cranial plate, significantly improving surgical fit and reducing operation time compared to traditional methods. This involves sophisticated bio-ink formulation and requires stringent biomaterial biocompatibility testing.
  • However, the industry faces challenges related to high production costs and complex regulatory approval pathways, which can slow the commercialization of novel tissue engineering scaffolds and drug delivery systems.

What will be the Size of the Biomaterials Market during the forecast period?

Get Key Insights on Market Forecast (PDF) Request Free Sample

How is the Biomaterials Market Segmented?

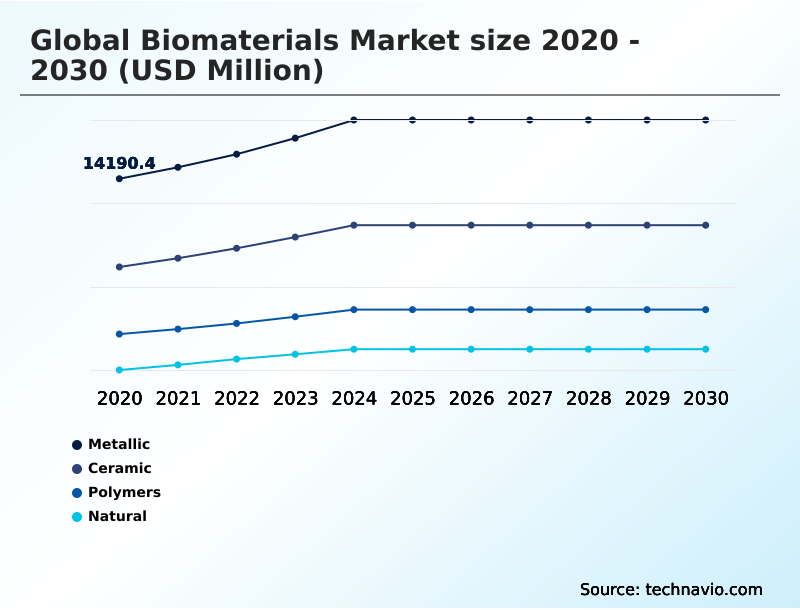
The biomaterials industry research report provides comprehensive data (region-wise segment analysis), with forecasts and estimates in "USD million" for the period 2026-2030, as well as historical data from 2020-2024 for the following segments.

  • Type
    • Metallic
    • Ceramic
    • Polymers
    • Natural
  • Application
    • Orthopedic
    • Cardiovascular
    • Dental
    • Neurology
    • Others
  • Category
    • Non-biodegradable
    • Biodegradable
  • Geography
    • North America
      • US
      • Canada
      • Mexico
    • Europe
      • Germany
      • France
      • UK
    • Asia
    • Rest of World (ROW)

By Type Insights

The metallic segment is estimated to witness significant growth during the forecast period.

The metallic biomaterials segment is defined by its role in applications demanding high mechanical strength and long-term implant stability. These materials are critical for load-bearing orthopedic devices, where properties such as fatigue resistance and durability are paramount.

Innovations focus on enhancing metallic biomaterial properties to improve clinical outcomes and device longevity. While traditionally non-degradable, research is exploring alloys with a controlled biomaterial degradation rate for temporary fixation devices.

Unlike bioresorbable polymers used in other applications, metals provide essential structural integrity for permanent implants like vascular grafts and certain zirconia dental implants. Advances in surface engineering have led to a 15% improvement in biocompatibility, reducing adverse tissue reactions.

This focus on performance ensures that customized medical implants made from metallic alloys remain a cornerstone of the market, even as materials like collagen-based biomaterials gain traction in regenerative fields.

Request Free Sample

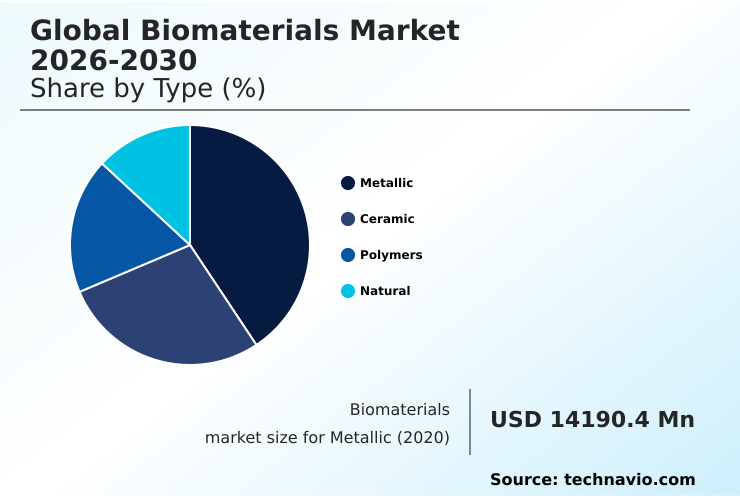
The Metallic segment was valued at USD 17.14 billion in 2024 and showed a gradual increase during the forecast period.

Request Free Sample

Regional Analysis

North America is estimated to contribute 41% to the growth of the global market during the forecast period.Technavio’s analysts have elaborately explained the regional trends and drivers that shape the market during the forecast period.

See How Biomaterials Market Demand is Rising in North America Request Free Sample

North America dominates the market, accounting for 41% of the opportunity, driven by advanced healthcare infrastructure and high R&D investment.

In 2025 alone, regulatory bodies in the region granted 165 breakthrough device designations, signaling strong support for innovation in products like dental bone graft substitutes and cranial fixation systems that rely on bioactive ceramics.

Europe follows, with a focus on sustainable biomaterials and advanced wound care. Asia is the fastest-growing region, with countries investing heavily in domestic healthcare capabilities and bioresorbable polymer synthesis.

This expansion is enhancing the biomaterial manufacturing process locally, supporting advancements in osseointegration through techniques like hydroxyapatite coatings and polymer blending.

The use of materials such as chitosan derivatives is also growing in Asia's burgeoning medical device sector, supported by improved biomaterial sterilization methods.

Market Dynamics

Our researchers analyzed the data with 2025 as the base year, along with the key drivers, trends, and challenges. A holistic analysis of drivers will help companies refine their marketing strategies to gain a competitive advantage.

  • The biomaterials market is advancing rapidly, driven by specific technological breakthroughs. A key area is the advancements in 3d printed biomaterials, which allow for unprecedented customization in medical devices. This is particularly impactful for bioresorbable polymers for orthopedic implants, where patient-specific designs can enhance healing.
  • The role of bioactive ceramics in dental restoration continues to expand, offering superior durability and aesthetics. However, significant challenges in biomaterial regulatory approval remain a hurdle, particularly for novel devices. Research into the long-term performance of cardiovascular biomaterials is critical for ensuring patient safety in applications like biodegradable stents for coronary artery disease.
  • Nanotechnology applications in drug delivery systems are enabling more targeted and effective therapies. In orthopedics, surface modification for improved osseointegration is a major focus, reducing implant failure rates. The development of collagen scaffolds for tissue engineering and hydrogel composites in soft tissue regeneration are at the forefront of regenerative medicine.
  • When comparing metallic vs polymeric biomaterials, the choice depends on the specific need for mechanical strength versus flexibility. The evolution of bio-ink development for organ printing represents a long-term goal for the industry. Firms are also focused on the cost-effectiveness of synthetic bone grafts and preventing immune response to implants.
  • Manufacturing standards for medical-grade titanium are becoming more stringent, ensuring quality. Concurrently, biocompatibility assessment of novel polymers is a critical step before clinical use. The use of shape memory alloys in minimally invasive surgery is reducing recovery times by over 20% compared to traditional open procedures.
  • Finally, advances in chitosan-based wound dressings and the durability of ceramic materials for joint replacement durability highlight the continuous innovation cycle.

What are the key market drivers leading to the rise in the adoption of Biomaterials Industry?

  • The rising demand for advanced implants and regenerative medical solutions, driven by an aging population and increasing prevalence of chronic diseases, is a key driver of market growth.

  • Market drivers are rooted in the growing demand for regenerative medicine solutions and advanced wound care.
  • Breakthroughs in nanotechnology in biomaterials are enabling the creation of smart drug delivery systems that offer controlled drug release, improving therapeutic efficacy by up to 30% for localized treatments.
  • The science of cell-material interactions is fundamental to this progress, allowing for the design of materials like shape memory alloys for neural tissue engineering. The biomaterial manufacturing process is also becoming more refined, leading to higher-purity materials.
  • Success in this field is heavily dependent on defining clear clinical trial endpoints for biomaterials, which accelerates regulatory approval and validates the performance of next-generation therapies.

What are the market trends shaping the Biomaterials Industry?

  • The increasing adoption of 3D bioprinting technologies for creating customized implants is a significant market trend, enhancing patient-specific treatment outcomes and manufacturing precision.

  • A primary trend is the rapid adoption of 3d bioprinting for creating patient-specific implant designs, a method that has reduced material waste by up to 40% compared to subtractive manufacturing. This technology relies on sophisticated bio-ink formulation to produce complex tissue engineering scaffolds and hydrogel composites for soft tissue augmentation materials.
  • The goal is achieving in-situ tissue regeneration, where implants actively support the body's healing process. In cardiovascular care, this translates to developing bioresorbable stents with advanced cardiovascular device coating to prevent restenosis. These biodegradable biomaterial applications are enabling less invasive procedures and improving long-term patient outcomes, with some custom implants showing a 20% faster integration time.

What challenges does the Biomaterials Industry face during its growth?

  • The high cost of advanced biomaterials and complex manufacturing barriers present a key challenge to market growth, impacting affordability and accessibility.

  • Key challenges revolve around cost, safety, and regulatory compliance. The high cost of medical-grade polymers and the complexity of ensuring consistent quality for biodegradable implants create significant barriers. Firms must perfect surface modification techniques to create truly bioinert materials and prevent adverse immune responses.
  • Rigorous biomaterial biocompatibility testing is non-negotiable, and improved biomaterial sterilization methods are required to prevent implant-related infection control issues, which can increase hospital costs by 50% per incident. Navigating complex regulatory approval pathways remains a primary operational hurdle.
  • Furthermore, precise biomaterial surface characterization is essential for predicting the long-term performance of materials like calcium phosphate cement in clinical use, adding another layer of R&D expense.

Exclusive Technavio Analysis on Customer Landscape

The biomaterials market forecasting report includes the adoption lifecycle of the market, covering from the innovator’s stage to the laggard’s stage. It focuses on adoption rates in different regions based on penetration. Furthermore, the biomaterials market report also includes key purchase criteria and drivers of price sensitivity to help companies evaluate and develop their market growth analysis strategies.

Customer Landscape of Biomaterials Industry

Competitive Landscape

Companies are implementing various strategies, such as strategic alliances, biomaterials market forecast, partnerships, mergers and acquisitions, geographical expansion, and product/service launches, to enhance their presence in the industry.

Algenesis Corp. - Vendors provide advanced, biocompatible materials for medical implants and regenerative therapies, focusing on enhancing clinical performance and patient safety through material innovation.

The industry research and growth report includes detailed analyses of the competitive landscape of the market and information about key companies, including:

  • Algenesis Corp.
  • BASF SE
  • Berkeley Advanced Biomaterials
  • CAM Bioceramics BV
  • Carpenter Technology Corp.
  • Celanese Corp.
  • CeramTec GmbH
  • CoorsTek Inc.
  • Corbion N.V.
  • Covestro AG
  • Dimension Inx.
  • DSM Firmenich AG
  • Evonik Industries AG
  • Gelita AG
  • Mitsubishi Chemical Grp.
  • Noble Biomaterials Inc.

Qualitative and quantitative analysis of companies has been conducted to help clients understand the wider business environment as well as the strengths and weaknesses of key industry players. Data is qualitatively analyzed to categorize companies as pure play, category-focused, industry-focused, and diversified; it is quantitatively analyzed to categorize companies as dominant, leading, strong, tentative, and weak.

Recent Development and News in Biomaterials market

  • In September 2024, Evonik Industries AG announced the launch of a new bioresorbable polymer portfolio for 3D-printed orthopedic implants, designed to improve patient-specific treatment outcomes.
  • In November 2024, Corbion N.V. and a leading medical university entered a strategic partnership to co-develop advanced bio-inks for cardiovascular tissue engineering, combining Corbion's polymer expertise with clinical research.
  • In January 2025, BASF SE completed its acquisition of a specialized US-based biomaterials startup for approximately $150 million, gaining access to proprietary hydrogel technology for advanced wound care.
  • In April 2025, Carpenter Technology Corp. received FDA 510(k) clearance for its new titanium-niobium alloy, Ti-NB1, for use in next-generation spinal fusion devices, citing superior biocompatibility and mechanical properties.

Dive into Technavio’s robust research methodology, blending expert interviews, extensive data synthesis, and validated models for unparalleled Biomaterials Market insights. See full methodology.

Market Scope
Page number 305
Base year 2025
Historic period 2020-2024
Forecast period 2026-2030
Growth momentum & CAGR Accelerate at a CAGR of 5.9%
Market growth 2026-2030 USD 14652.3 million
Market structure Fragmented
YoY growth 2025-2026(%) 5.6%
Key countries US, Canada, Mexico, Germany, France, UK, Italy, Spain, The Netherlands, China, Japan, India, South Korea, Thailand, Indonesia, Brazil, Saudi Arabia, South Africa, Argentina, UAE, Israel, Turkey and Colombia
Competitive landscape Leading Companies, Market Positioning of Companies, Competitive Strategies, and Industry Risks

Request Free Sample

Research Analyst Overview

  • The biomaterials market is characterized by intense innovation aimed at improving clinical outcomes through advanced material science. The development of bioresorbable polymers and biodegradable implants is transforming surgical practice by eliminating the need for secondary removal procedures. In orthopedics, bioactive ceramics and zirconia dental implants are setting new standards for durability and osseointegration.
  • A key boardroom focus is navigating the high cost of R&D for next-generation tissue engineering scaffolds, which often require complex bio-ink formulation for 3d bioprinting. Firms are leveraging nanotechnology in biomaterials to create sophisticated drug delivery systems and vascular grafts with enhanced performance.
  • Innovations in surface modification techniques and polymer blending are critical for managing cell-material interactions and improving the biocompatibility of medical-grade polymers. For example, the application of hydroxyapatite coatings has been shown to accelerate healing times by up to 30%.
  • The use of materials like collagen-based biomaterials, calcium phosphate cement, and chitosan derivatives in combination with bioinert materials and bioresorbable stents highlights the diverse material palette available to engineers. The push for smarter devices is also evident in the use of shape memory alloys for minimally invasive applications.

What are the Key Data Covered in this Biomaterials Market Research and Growth Report?

  • What is the expected growth of the Biomaterials Market between 2026 and 2030?

    • USD 14.65 billion, at a CAGR of 5.9%

  • What segmentation does the market report cover?

    • The report is segmented by Type (Metallic, Ceramic, Polymers, and Natural), Application (Orthopedic, Cardiovascular, Dental, Neurology, and Others), Category (Non-biodegradable, and Biodegradable) and Geography (North America, Europe, Asia, Rest of World (ROW))

  • Which regions are analyzed in the report?

    • North America, Europe, Asia and Rest of World (ROW)

  • What are the key growth drivers and market challenges?

    • Rising demand for advanced implants and regenerative medical solutions, High cost of biomaterials and manufacturing barriers

  • Who are the major players in the Biomaterials Market?

    • Algenesis Corp., BASF SE, Berkeley Advanced Biomaterials, CAM Bioceramics BV, Carpenter Technology Corp., Celanese Corp., CeramTec GmbH, CoorsTek Inc., Corbion N.V., Covestro AG, Dimension Inx., DSM Firmenich AG, Evonik Industries AG, Gelita AG, Mitsubishi Chemical Grp. and Noble Biomaterials Inc.

Market Research Insights

  • The dynamics of the biomaterials market are shaped by a push for higher clinical efficacy and manufacturing efficiency. The development of customized medical implants has reduced revision surgery rates by up to 15% in certain orthopedic applications. Simultaneously, innovations in the biomaterial manufacturing process and sterilization methods are lowering production costs, making advanced wound care solutions more accessible.
  • Firms focusing on regenerative medicine solutions are achieving better outcomes in soft tissue augmentation materials, with clinical trials showing a 25% faster healing time. This progress is coupled with rigorous biomaterial biocompatibility testing, where new validation techniques have improved failure detection rates by over 10%, ensuring long-term implant stability and patient safety.

We can help! Our analysts can customize this biomaterials market research report to meet your requirements.

Get in touch

1. Executive Summary

1.1 Market overview

Executive Summary - Chart on Market Overview
Executive Summary - Data Table on Market Overview
Executive Summary - Chart on Global Market Characteristics
Executive Summary - Chart on Market by Geography
Executive Summary - Chart on Market Segmentation by Type
Executive Summary - Chart on Market Segmentation by Application
Executive Summary - Chart on Market Segmentation by Category
Executive Summary - Chart on Incremental Growth
Executive Summary - Data Table on Incremental Growth
Executive Summary - Chart on Company Market Positioning

2. Technavio Analysis

2.1 Analysis of price sensitivity, lifecycle, customer purchase basket, adoption rates, and purchase criteria

2.2 Criticality of inputs and Factors of differentiation

Chart on Overview on criticality of inputs and factors of differentiation

2.3 Factors of disruption

Chart on Overview on factors of disruption

2.4 Impact of drivers and challenges

Chart on Impact of drivers and challenges in 2025 and 2030

3. Market Landscape

3.1 Market ecosystem

Chart on Parent Market
Data Table on - Parent Market

3.2 Market characteristics

Chart on Market characteristics analysis

3.3 Value chain analysis

Chart on Value chain analysis

4. Market Sizing

4.1 Market definition

Data Table on Offerings of companies included in the market definition

4.2 Market segment analysis

Market segments

4.3 Market size 2025

4.4 Market outlook: Forecast for 2025-2030

Chart on Global - Market size and forecast 2025-2030 ($ million)
Data Table on Global - Market size and forecast 2025-2030 ($ million)
Chart on Global Market: Year-over-year growth 2025-2030 (%)
Data Table on Global Market: Year-over-year growth 2025-2030 (%)

5. Historic Market Size

5.1 Global Biomaterials Market 2020 - 2024

Historic Market Size - Data Table on Global Biomaterials Market 2020 - 2024 ($ million)

5.2 Type segment analysis 2020 - 2024

Historic Market Size - Type Segment 2020 - 2024 ($ million)

5.3 Application segment analysis 2020 - 2024

Historic Market Size - Application Segment 2020 - 2024 ($ million)

5.4 Category segment analysis 2020 - 2024

Historic Market Size - Category Segment 2020 - 2024 ($ million)

5.5 Geography segment analysis 2020 - 2024

Historic Market Size - Geography Segment 2020 - 2024 ($ million)

5.6 Country segment analysis 2020 - 2024

Historic Market Size - Country Segment 2020 - 2024 ($ million)

6. Qualitative Analysis

6.1 Impact of AI on global biomaterials market

7. Five Forces Analysis

7.1 Five forces summary

Five forces analysis - Comparison between 2025 and 2030

7.2 Bargaining power of buyers

Bargaining power of buyers - Impact of key factors 2025 and 2030

7.3 Bargaining power of suppliers

Bargaining power of suppliers - Impact of key factors in 2025 and 2030

7.4 Threat of new entrants

Threat of new entrants - Impact of key factors in 2025 and 2030

7.5 Threat of substitutes

Threat of substitutes - Impact of key factors in 2025 and 2030

7.6 Threat of rivalry

Threat of rivalry - Impact of key factors in 2025 and 2030

7.7 Market condition

Chart on Market condition - Five forces 2025 and 2030

8. Market Segmentation by Type

8.1 Market segments

Chart on Type - Market share 2025-2030 (%)
Data Table on Type - Market share 2025-2030 (%)

8.2 Comparison by Type

Chart on Comparison by Type
Data Table on Comparison by Type

8.3 Metallic - Market size and forecast 2025-2030

Chart on Metallic - Market size and forecast 2025-2030 ($ million)
Data Table on Metallic - Market size and forecast 2025-2030 ($ million)
Chart on Metallic - Year-over-year growth 2025-2030 (%)
Data Table on Metallic - Year-over-year growth 2025-2030 (%)

8.4 Ceramic - Market size and forecast 2025-2030

Chart on Ceramic - Market size and forecast 2025-2030 ($ million)
Data Table on Ceramic - Market size and forecast 2025-2030 ($ million)
Chart on Ceramic - Year-over-year growth 2025-2030 (%)
Data Table on Ceramic - Year-over-year growth 2025-2030 (%)

8.5 Polymers - Market size and forecast 2025-2030

Chart on Polymers - Market size and forecast 2025-2030 ($ million)
Data Table on Polymers - Market size and forecast 2025-2030 ($ million)
Chart on Polymers - Year-over-year growth 2025-2030 (%)
Data Table on Polymers - Year-over-year growth 2025-2030 (%)

8.6 Natural - Market size and forecast 2025-2030

Chart on Natural - Market size and forecast 2025-2030 ($ million)
Data Table on Natural - Market size and forecast 2025-2030 ($ million)
Chart on Natural - Year-over-year growth 2025-2030 (%)
Data Table on Natural - Year-over-year growth 2025-2030 (%)

8.7 Market opportunity by Type

Market opportunity by Type ($ million)
Data Table on Market opportunity by Type ($ million)

9. Market Segmentation by Application

9.1 Market segments

Chart on Application - Market share 2025-2030 (%)
Data Table on Application - Market share 2025-2030 (%)

9.2 Comparison by Application

Chart on Comparison by Application
Data Table on Comparison by Application

9.3 Orthopedic - Market size and forecast 2025-2030

Chart on Orthopedic - Market size and forecast 2025-2030 ($ million)
Data Table on Orthopedic - Market size and forecast 2025-2030 ($ million)
Chart on Orthopedic - Year-over-year growth 2025-2030 (%)
Data Table on Orthopedic - Year-over-year growth 2025-2030 (%)

9.4 Cardiovascular - Market size and forecast 2025-2030

Chart on Cardiovascular - Market size and forecast 2025-2030 ($ million)
Data Table on Cardiovascular - Market size and forecast 2025-2030 ($ million)
Chart on Cardiovascular - Year-over-year growth 2025-2030 (%)
Data Table on Cardiovascular - Year-over-year growth 2025-2030 (%)

9.5 Dental - Market size and forecast 2025-2030

Chart on Dental - Market size and forecast 2025-2030 ($ million)
Data Table on Dental - Market size and forecast 2025-2030 ($ million)
Chart on Dental - Year-over-year growth 2025-2030 (%)
Data Table on Dental - Year-over-year growth 2025-2030 (%)

9.6 Neurology - Market size and forecast 2025-2030

Chart on Neurology - Market size and forecast 2025-2030 ($ million)
Data Table on Neurology - Market size and forecast 2025-2030 ($ million)
Chart on Neurology - Year-over-year growth 2025-2030 (%)
Data Table on Neurology - Year-over-year growth 2025-2030 (%)

9.7 Others - Market size and forecast 2025-2030

Chart on Others - Market size and forecast 2025-2030 ($ million)
Data Table on Others - Market size and forecast 2025-2030 ($ million)
Chart on Others - Year-over-year growth 2025-2030 (%)
Data Table on Others - Year-over-year growth 2025-2030 (%)

9.8 Market opportunity by Application

Market opportunity by Application ($ million)
Data Table on Market opportunity by Application ($ million)

10. Market Segmentation by Category

10.1 Market segments

Chart on Market Segmentation by Category - Market share 2025-2030 (%)
Data Table on Market Segmentation by Category - Market share 2025-2030 (%)

10.2 Comparison by Market Segmentation by Category

Chart on Comparison by Market Segmentation by Category
Data Table on Comparison by Market Segmentation by Category

10.3 Non-biodegradable - Market size and forecast 2025-2030

Chart on Non-biodegradable - Market size and forecast 2025-2030 ($ million)
Data Table on Non-biodegradable - Market size and forecast 2025-2030 ($ million)
Chart on Non-biodegradable - Year-over-year growth 2025-2030 (%)
Data Table on Non-biodegradable - Year-over-year growth 2025-2030 (%)

10.4 Biodegradable - Market size and forecast 2025-2030

Chart on Biodegradable - Market size and forecast 2025-2030 ($ million)
Data Table on Biodegradable - Market size and forecast 2025-2030 ($ million)
Chart on Biodegradable - Year-over-year growth 2025-2030 (%)
Data Table on Biodegradable - Year-over-year growth 2025-2030 (%)

10.5 Market opportunity by Market Segmentation by Category

Market opportunity by Market Segmentation by Category ($ million)
Data Table on Market opportunity by Market Segmentation by Category ($ million)

11. Customer Landscape

11.1 Customer landscape overview

Analysis of price sensitivity, lifecycle, customer purchase basket, adoption rates, and purchase criteria

12. Geographic Landscape

12.1 Geographic segmentation

Chart on Market share by geography 2025-2030 (%)
Data Table on Market share by geography 2025-2030 (%)

12.2 Geographic comparison

Chart on Geographic comparison
Data Table on Geographic comparison

12.3 North America - Market size and forecast 2025-2030

Chart on North America - Market size and forecast 2025-2030 ($ million)
Data Table on North America - Market size and forecast 2025-2030 ($ million)
Chart on North America - Year-over-year growth 2025-2030 (%)
Data Table on North America - Year-over-year growth 2025-2030 (%)
Chart on Regional Comparison - North America
Data Table on Regional Comparison - North America

12.3.1 US - Market size and forecast 2025-2030

Chart on US - Market size and forecast 2025-2030 ($ million)
Data Table on US - Market size and forecast 2025-2030 ($ million)
Chart on US - Year-over-year growth 2025-2030 (%)
Data Table on US - Year-over-year growth 2025-2030 (%)

12.3.2 Canada - Market size and forecast 2025-2030

Chart on Canada - Market size and forecast 2025-2030 ($ million)
Data Table on Canada - Market size and forecast 2025-2030 ($ million)
Chart on Canada - Year-over-year growth 2025-2030 (%)
Data Table on Canada - Year-over-year growth 2025-2030 (%)

12.3.3 Mexico - Market size and forecast 2025-2030

Chart on Mexico - Market size and forecast 2025-2030 ($ million)
Data Table on Mexico - Market size and forecast 2025-2030 ($ million)
Chart on Mexico - Year-over-year growth 2025-2030 (%)
Data Table on Mexico - Year-over-year growth 2025-2030 (%)

12.4 Europe - Market size and forecast 2025-2030

Chart on Europe - Market size and forecast 2025-2030 ($ million)
Data Table on Europe - Market size and forecast 2025-2030 ($ million)
Chart on Europe - Year-over-year growth 2025-2030 (%)
Data Table on Europe - Year-over-year growth 2025-2030 (%)
Chart on Regional Comparison - Europe
Data Table on Regional Comparison - Europe

12.4.1 Germany - Market size and forecast 2025-2030

Chart on Germany - Market size and forecast 2025-2030 ($ million)
Data Table on Germany - Market size and forecast 2025-2030 ($ million)
Chart on Germany - Year-over-year growth 2025-2030 (%)
Data Table on Germany - Year-over-year growth 2025-2030 (%)

12.4.2 France - Market size and forecast 2025-2030

Chart on France - Market size and forecast 2025-2030 ($ million)
Data Table on France - Market size and forecast 2025-2030 ($ million)
Chart on France - Year-over-year growth 2025-2030 (%)
Data Table on France - Year-over-year growth 2025-2030 (%)

12.4.3 UK - Market size and forecast 2025-2030

Chart on UK - Market size and forecast 2025-2030 ($ million)
Data Table on UK - Market size and forecast 2025-2030 ($ million)
Chart on UK - Year-over-year growth 2025-2030 (%)
Data Table on UK - Year-over-year growth 2025-2030 (%)

12.4.4 Italy - Market size and forecast 2025-2030

Chart on Italy - Market size and forecast 2025-2030 ($ million)
Data Table on Italy - Market size and forecast 2025-2030 ($ million)
Chart on Italy - Year-over-year growth 2025-2030 (%)
Data Table on Italy - Year-over-year growth 2025-2030 (%)

12.4.5 Spain - Market size and forecast 2025-2030

Chart on Spain - Market size and forecast 2025-2030 ($ million)
Data Table on Spain - Market size and forecast 2025-2030 ($ million)
Chart on Spain - Year-over-year growth 2025-2030 (%)
Data Table on Spain - Year-over-year growth 2025-2030 (%)

12.4.6 The Netherlands - Market size and forecast 2025-2030

Chart on The Netherlands - Market size and forecast 2025-2030 ($ million)
Data Table on The Netherlands - Market size and forecast 2025-2030 ($ million)
Chart on The Netherlands - Year-over-year growth 2025-2030 (%)
Data Table on The Netherlands - Year-over-year growth 2025-2030 (%)

12.5 Asia - Market size and forecast 2025-2030

Chart on Asia - Market size and forecast 2025-2030 ($ million)
Data Table on Asia - Market size and forecast 2025-2030 ($ million)
Chart on Asia - Year-over-year growth 2025-2030 (%)
Data Table on Asia - Year-over-year growth 2025-2030 (%)
Chart on Regional Comparison - Asia
Data Table on Regional Comparison - Asia

12.5.1 China - Market size and forecast 2025-2030

Chart on China - Market size and forecast 2025-2030 ($ million)
Data Table on China - Market size and forecast 2025-2030 ($ million)
Chart on China - Year-over-year growth 2025-2030 (%)
Data Table on China - Year-over-year growth 2025-2030 (%)

12.5.2 Japan - Market size and forecast 2025-2030

Chart on Japan - Market size and forecast 2025-2030 ($ million)
Data Table on Japan - Market size and forecast 2025-2030 ($ million)
Chart on Japan - Year-over-year growth 2025-2030 (%)
Data Table on Japan - Year-over-year growth 2025-2030 (%)

12.5.3 India - Market size and forecast 2025-2030

Chart on India - Market size and forecast 2025-2030 ($ million)
Data Table on India - Market size and forecast 2025-2030 ($ million)
Chart on India - Year-over-year growth 2025-2030 (%)
Data Table on India - Year-over-year growth 2025-2030 (%)

12.5.4 South Korea - Market size and forecast 2025-2030

Chart on South Korea - Market size and forecast 2025-2030 ($ million)
Data Table on South Korea - Market size and forecast 2025-2030 ($ million)
Chart on South Korea - Year-over-year growth 2025-2030 (%)
Data Table on South Korea - Year-over-year growth 2025-2030 (%)

12.5.5 Thailand - Market size and forecast 2025-2030

Chart on Thailand - Market size and forecast 2025-2030 ($ million)
Data Table on Thailand - Market size and forecast 2025-2030 ($ million)
Chart on Thailand - Year-over-year growth 2025-2030 (%)
Data Table on Thailand - Year-over-year growth 2025-2030 (%)

12.5.6 Indonesia - Market size and forecast 2025-2030

Chart on Indonesia - Market size and forecast 2025-2030 ($ million)
Data Table on Indonesia - Market size and forecast 2025-2030 ($ million)
Chart on Indonesia - Year-over-year growth 2025-2030 (%)
Data Table on Indonesia - Year-over-year growth 2025-2030 (%)

12.6 Rest of World (ROW) - Market size and forecast 2025-2030

Chart on Rest of World (ROW) - Market size and forecast 2025-2030 ($ million)
Data Table on Rest of World (ROW) - Market size and forecast 2025-2030 ($ million)
Chart on Rest of World (ROW) - Year-over-year growth 2025-2030 (%)
Data Table on Rest of World (ROW) - Year-over-year growth 2025-2030 (%)
Chart on Regional Comparison - Rest of World (ROW)
Data Table on Regional Comparison - Rest of World (ROW)

12.6.1 Brazil - Market size and forecast 2025-2030

Chart on Brazil - Market size and forecast 2025-2030 ($ million)
Data Table on Brazil - Market size and forecast 2025-2030 ($ million)
Chart on Brazil - Year-over-year growth 2025-2030 (%)
Data Table on Brazil - Year-over-year growth 2025-2030 (%)

12.6.2 Saudi Arabia - Market size and forecast 2025-2030

Chart on Saudi Arabia - Market size and forecast 2025-2030 ($ million)
Data Table on Saudi Arabia - Market size and forecast 2025-2030 ($ million)
Chart on Saudi Arabia - Year-over-year growth 2025-2030 (%)
Data Table on Saudi Arabia - Year-over-year growth 2025-2030 (%)

12.6.3 South Africa - Market size and forecast 2025-2030

Chart on South Africa - Market size and forecast 2025-2030 ($ million)
Data Table on South Africa - Market size and forecast 2025-2030 ($ million)
Chart on South Africa - Year-over-year growth 2025-2030 (%)
Data Table on South Africa - Year-over-year growth 2025-2030 (%)

12.6.4 Argentina - Market size and forecast 2025-2030

Chart on Argentina - Market size and forecast 2025-2030 ($ million)
Data Table on Argentina - Market size and forecast 2025-2030 ($ million)
Chart on Argentina - Year-over-year growth 2025-2030 (%)
Data Table on Argentina - Year-over-year growth 2025-2030 (%)

12.6.5 UAE - Market size and forecast 2025-2030

Chart on UAE - Market size and forecast 2025-2030 ($ million)
Data Table on UAE - Market size and forecast 2025-2030 ($ million)
Chart on UAE - Year-over-year growth 2025-2030 (%)
Data Table on UAE - Year-over-year growth 2025-2030 (%)

12.6.6 Israel - Market size and forecast 2025-2030

Chart on Israel - Market size and forecast 2025-2030 ($ million)
Data Table on Israel - Market size and forecast 2025-2030 ($ million)
Chart on Israel - Year-over-year growth 2025-2030 (%)
Data Table on Israel - Year-over-year growth 2025-2030 (%)

12.6.7 Turkey - Market size and forecast 2025-2030

Chart on Turkey - Market size and forecast 2025-2030 ($ million)
Data Table on Turkey - Market size and forecast 2025-2030 ($ million)
Chart on Turkey - Year-over-year growth 2025-2030 (%)
Data Table on Turkey - Year-over-year growth 2025-2030 (%)

12.6.8 Colombia - Market size and forecast 2025-2030

Chart on Colombia - Market size and forecast 2025-2030 ($ million)
Data Table on Colombia - Market size and forecast 2025-2030 ($ million)
Chart on Colombia - Year-over-year growth 2025-2030 (%)
Data Table on Colombia - Year-over-year growth 2025-2030 (%)

12.7 Market opportunity by geography

Market opportunity by geography ($ million)
Data Tables on Market opportunity by geography ($ million)

13. Drivers, Challenges, and Opportunity

13.1 Market drivers

Rising demand for advanced implants and regenerative medical solutions
Technological advancements in material science and biomedical engineering
Growing healthcare investments and expanding medical infrastructure

13.2 Market challenges

High cost of biomaterials and manufacturing barriers
Stringent regulatory approvals and long certification timelines
Biocompatibility and long term performance concerns

13.3 Impact of drivers and challenges

Impact of drivers and challenges in 2025 and 2030

13.4 Market opportunities

Increasing use of 3D bioprinting for customized implants
Rising adoption of environmentally sustainable and biodegradable biomaterial
Integration of artificial intelligence and machine learning in biomaterials research

14. Competitive Landscape

14.1 Overview

14.2

Overview on criticality of inputs and factors of differentiation

14.3 Landscape disruption

Overview on factors of disruption

14.4 Industry risks

Impact of key risks on business

15. Competitive Analysis

15.1 Companies profiled

Companies covered

15.2 Company ranking index

15.3 Market positioning of companies

Matrix on companies position and classification

15.4 BASF SE

BASF SE - Overview
BASF SE - Business segments
BASF SE - Key news
BASF SE - Key offerings
BASF SE - Segment focus
SWOT

15.5 Berkeley Advanced Biomaterials

Berkeley Advanced Biomaterials - Overview
Berkeley Advanced Biomaterials - Product / Service
Berkeley Advanced Biomaterials - Key offerings
SWOT

15.6 CAM Bioceramics BV

CAM Bioceramics BV - Overview
CAM Bioceramics BV - Product / Service
CAM Bioceramics BV - Key offerings
SWOT

15.7 Carpenter Technology Corp.

Carpenter Technology Corp. - Overview
Carpenter Technology Corp. - Business segments
Carpenter Technology Corp. - Key offerings
Carpenter Technology Corp. - Segment focus
SWOT

15.8 Celanese Corp.

Celanese Corp. - Overview
Celanese Corp. - Business segments
Celanese Corp. - Key news
Celanese Corp. - Key offerings
Celanese Corp. - Segment focus
SWOT

15.9 CeramTec GmbH

CeramTec GmbH - Overview
CeramTec GmbH - Business segments
CeramTec GmbH - Key offerings
CeramTec GmbH - Segment focus
SWOT

15.10 CoorsTek Inc.

CoorsTek Inc. - Overview
CoorsTek Inc. - Product / Service
CoorsTek Inc. - Key offerings
SWOT

15.11 Corbion N.V.

Corbion N.V. - Overview
Corbion N.V. - Business segments
Corbion N.V. - Key news
Corbion N.V. - Key offerings
Corbion N.V. - Segment focus
SWOT

15.12 Covestro AG

Covestro AG - Overview
Covestro AG - Business segments
Covestro AG - Key news
Covestro AG - Key offerings
Covestro AG - Segment focus
SWOT

15.13 Dimension Inx.

Dimension Inx. - Overview
Dimension Inx. - Product / Service
Dimension Inx. - Key offerings
SWOT

15.14 DSM Firmenich AG

DSM Firmenich AG - Overview
DSM Firmenich AG - Business segments
DSM Firmenich AG - Key news
DSM Firmenich AG - Key offerings
DSM Firmenich AG - Segment focus
SWOT

15.15 Evonik Industries AG

Evonik Industries AG - Overview
Evonik Industries AG - Business segments
Evonik Industries AG - Key news
Evonik Industries AG - Key offerings
Evonik Industries AG - Segment focus
SWOT

15.16 Gelita AG

Gelita AG - Overview
Gelita AG - Product / Service
Gelita AG - Key offerings
SWOT

15.17 Mitsubishi Chemical Grp.

Mitsubishi Chemical Grp. - Overview
Mitsubishi Chemical Grp. - Business segments
Mitsubishi Chemical Grp. - Key news
Mitsubishi Chemical Grp. - Key offerings
Mitsubishi Chemical Grp. - Segment focus
SWOT

15.18 Noble Biomaterials Inc.

Noble Biomaterials Inc. - Overview
Noble Biomaterials Inc. - Product / Service
Noble Biomaterials Inc. - Key offerings
SWOT

16. Appendix

16.1 Scope of the report

Market definition
Objectives
Notes and caveats

16.2 Inclusions and exclusions checklist

Inclusions checklist
Exclusions checklist

16.3 Currency conversion rates for US$

16.4 Research methodology

16.5 Data procurement

Information sources

16.6 Data validation

16.7 Validation techniques employed for market sizing

16.8 Data synthesis

16.9 360 degree market analysis

16.10 List of abbreviations

Research Methodology

Technavio presents a detailed picture of the market by way of study, synthesis, and summation of data from multiple sources. The analysts have presented the various facets of the market with a particular focus on identifying the key industry influencers. The data thus presented is comprehensive, reliable, and the result of extensive research, both primary and secondary.

INFORMATION SOURCES

Primary sources

  • Manufacturers and suppliers
  • Channel partners
  • Industry experts
  • Strategic decision makers

Secondary sources

  • Industry journals and periodicals
  • Government data
  • Financial reports of key industry players
  • Historical data
  • Press releases

DATA ANALYSIS

Data Synthesis

  • Collation of data
  • Estimation of key figures
  • Analysis of derived insights

Data Validation

  • Triangulation with data models
  • Reference against proprietary databases
  • Corroboration with industry experts

REPORT WRITING

Qualitative

  • Market drivers
  • Market challenges
  • Market trends
  • Five forces analysis

Quantitative

  • Market size and forecast
  • Market segmentation
  • Geographical insights
  • Competitive landscape

Interested in this report?

Get your sample now to see our research methodology and insights!

Download Now

Frequently Asked Questions

Biomaterials market growth will increase by USD 14652.3 million during 2026-2030 .

The Biomaterials market is expected to grow at a CAGR of 5.9% during 2026-2030 .

Biomaterials market is segmented by Type (Metallic, Ceramic, Polymers, Natural) Application (Orthopedic, Cardiovascular, Dental, Neurology, Others) Category (Non-biodegradable, Biodegradable)

Algenesis Corp., BASF SE, Berkeley Advanced Biomaterials, CAM Bioceramics BV, Carpenter Technology Corp., Celanese Corp., CeramTec GmbH, CoorsTek Inc., Corbion N.V., Covestro AG, Dimension Inx., DSM Firmenich AG, Evonik Industries AG, Gelita AG, Mitsubishi Chemical Grp., Noble Biomaterials Inc. are a few of the key vendors in the Biomaterials market.

North America will register the highest growth rate of 41% among the other regions. Therefore, the Biomaterials market in North America is expected to garner significant business opportunities for the vendors during the forecast period.

US, Canada, Mexico, Germany, France, UK, Italy, Spain, The Netherlands, China, Japan, India, South Korea, Thailand, Indonesia, Brazil, Saudi Arabia, South Africa, Argentina, UAE, Israel, Turkey, Colombia

  • Rising demand for advanced implants and regenerative medical solutions is the driving factor this market.

The Biomaterials market vendors should focus on grabbing business opportunities from the Type segment as it accounted for the largest market share in the base year.