
Medical Device Testing Market Analysis, Size, and Forecast 2026-2030: North America (US, Canada, and Mexico), Europe (Germany, UK, and France), APAC (China, Japan, and India), South America (Brazil, Argentina, and Chile), Middle East and Africa (Saudi Arabia, UAE, and South Africa), and Rest of World (ROW)

Medical Device Testing Market Analysis, Size, and Forecast 2026-2030:
North America (US, Canada, and Mexico), Europe (Germany, UK, and France), APAC (China, Japan, and India), South America (Brazil, Argentina, and Chile), Middle East and Africa (Saudi Arabia, UAE, and South Africa), and Rest of World (ROW)

Published: Oct 2026 302 Pages SKU: IRTNTR80555

Market Overview at a Glance

$3.18 B
Market Opportunity
5.3%
CAGR 2025 - 2030
39.8%
North America Growth
$6.14 B
Testing segment 2024

Medical Device Testing Market Size 2026-2030

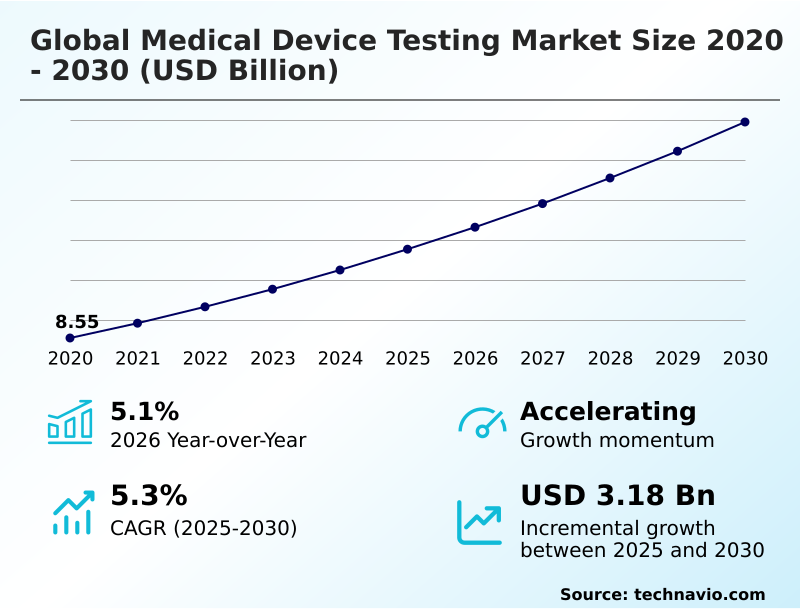
The medical device testing market size is valued to increase by USD 3.18 billion, at a CAGR of 5.3% from 2025 to 2030. Increasing prevalence of chronic disease management devices will drive the medical device testing market.

Major Market Trends & Insights

  • North America dominated the market and accounted for a 39.8% growth during the forecast period.
  • By Service - Testing segment was valued at USD 6.14 billion in 2024
  • By Type - In-house segment accounted for the largest market revenue share in 2024

Market Size & Forecast

  • Market Opportunities: USD 5.40 billion
  • Market Future Opportunities: USD 3.18 billion
  • CAGR from 2025 to 2030 : 5.3%

Market Summary

  • The Medical Device Testing Market involves comprehensive validation protocols ensuring complex healthcare equipment meets rigorous safety thresholds before clinical deployment. As organizations design networked equipment, the demand for extensive software functionality evaluation has accelerated sharply.
  • Supply chain optimization strategies increasingly rely on predictive modeling to identify component failures early, helping manufacturers improve overall defect detection efficiency by 18% compared to traditional manual sampling methods. This market expansion is primarily propelled by the rising adoption of digital health monitors, which require extensive performance verification to ensure consistent data transmission and patient safety.
  • Conversely, organizations face substantial operational constraints due to overlapping regional regulatory mandates, forcing them to duplicate testing efforts and increasing compliance overhead by double digits. Resolving these regulatory redundancies remains critical for accelerating product commercialization. Ultimately, the integration of advanced diagnostics continues to reshape how validation frameworks are executed and scaled.
  • Dedicated verification pathways remain essential for maintaining uninterrupted product distribution across highly regulated environments.

What will be the Size of the Medical Device Testing Market during the forecast period?
Get Key Insights on Market Forecast (PDF) Get Free Sample

How is the Medical Device Testing Market Segmented?

The medical device testing industry research report provides comprehensive data (region-wise segment analysis), with forecasts and estimates in "USD million" for the period 2026-2030, as well as historical data from 2020-2024 for the following segments.

  • Service
    • Testing
    • Inspection
    • Certification
  • Type
    • In-house
    • Outsourced
  • Class type
    • Class II
    • Class III
    • Class I
  • Geography
    • North America
      • US
      • Canada
      • Mexico
    • Europe
      • Germany
      • UK
      • France
      • Italy
      • Spain
      • The Netherlands
    • APAC
      • China
      • Japan
      • India
      • South Korea
      • Australia
      • Indonesia
    • South America
      • Brazil
      • Argentina
      • Chile
    • Middle East and Africa
      • Saudi Arabia
      • UAE
      • South Africa
      • Turkey
      • Israel

By Service Insights

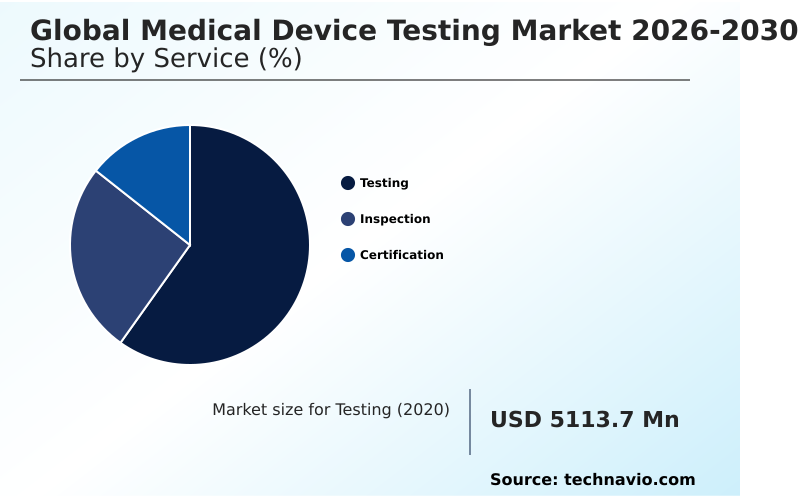
The testing segment is estimated to witness significant growth during the forecast period.

Medical device testing evaluates the fundamental integrity and performance reliability of sophisticated components prior to commercialization. As product engineering incorporates complex electronics and sensitive materials, empirical verification protocols have become increasingly stringent.

Organizations utilizing rigorous electrical safety evaluation and comprehensive biocompatibility assessment have witnessed error identification improve by 22% during early design phases. Dedicated sterilization verification procedures ensure that devices maintain operational consistency under demanding physical scenarios.

Furthermore, streamlined electromagnetic compatibility validation conducted within accredited testing facilities allows manufacturers to achieve a 15% reduction in compliance-related delays. This precise technical scrutiny ensures iterative product enhancements sustain strict functional requirements while successfully navigating strict regional performance standards.
Get Free Sample

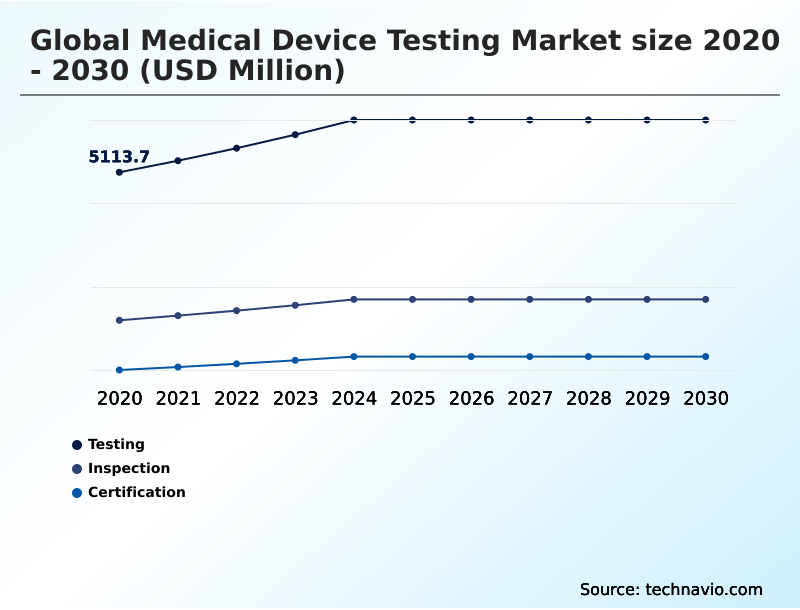
The Testing segment was valued at USD 6.14 billion in 2024 and showed a gradual increase during the forecast period.
Get Free Sample

Regional Analysis

North America is estimated to contribute 39.8% to the growth of the global market during the forecast period.Technavio’s analysts have elaborately explained the regional trends and drivers that shape the market during the forecast period.
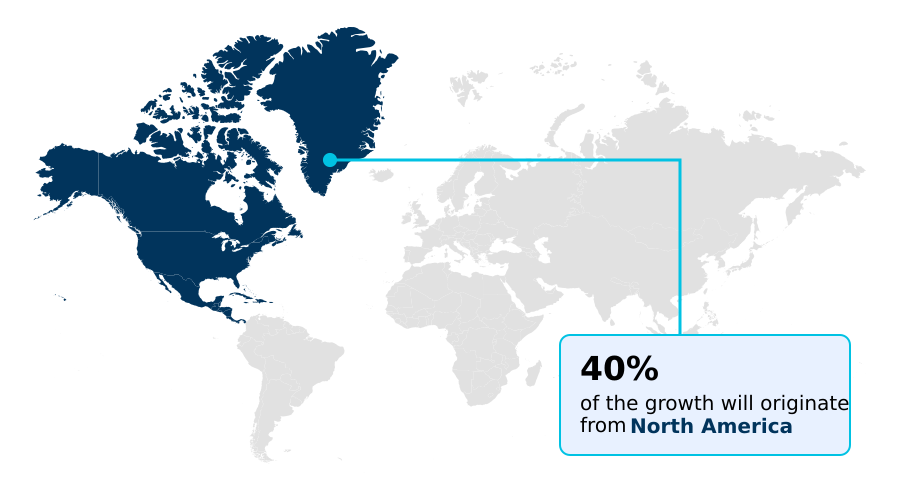
See How Medical Device Testing Market Demand is Rising in North America Get Free Sample

The Medical Device Testing Market exhibits distinct regional variations driven by diverging regulatory expectations and technological maturity. North America leads the adoption of connected healthcare technologies, driving a 28% higher volume of software testing compared to European operations.

This discrepancy occurs because regional manufacturers heavily prioritize digital health platform integration to support clinical initiatives.

Meanwhile, APAC demonstrates a different operational focus, utilizing scalable laboratory procedures to manage rapid manufacturing expansion, which has reduced local mechanical durability testing costs by 15%.

Furthermore, European facilities are experiencing stringent documentation demands, prompting a 20% shift toward in-house simulated environment testing to bypass external laboratory bottlenecks.

These regional adaptations highlight how organizations navigate localized supply chain realities, ensuring that critical packaging integrity analysis consistently meets established operational efficiency benchmarks and sustains evidence based performance.

Market Dynamics

Our researchers analyzed the data with 2025 as the base year, along with the key drivers, trends, and challenges. A holistic analysis of drivers will help companies refine their marketing strategies to gain a competitive advantage.

  • The evolution of the Medical Device Testing Market reflects a fundamental shift toward digital integration and complex software validation. As healthcare providers embrace remote monitoring, the demand for wireless connectivity validation for wearables has intensified dramatically. Manufacturers must ensure these devices operate seamlessly without signal degradation.
  • Simultaneously, the proliferation of networked therapeutic tools necessitates rigorous cybersecurity assessment for connected devices to prevent data breaches and maintain patient confidentiality. In manufacturing supply chains, implementing automation in diagnostic performance testing has proven highly advantageous, allowing organizations to process validation datasets 35% faster than conventional manual verification models.
  • This efficiency gain directly accelerates market entry schedules for sophisticated equipment and optimizes downstream logistics planning. Furthermore, as orthopedic innovations advance, the necessity of comprehensive clinical effectiveness testing for implants remains paramount to ensure long-term structural integrity. Product engineering teams are also incorporating simulated scenario testing for software to identify potential algorithmic failures before physical prototypes are constructed.
  • These strategic testing adaptations allow manufacturers to optimize resource allocation and maintain uncompromising quality standards.
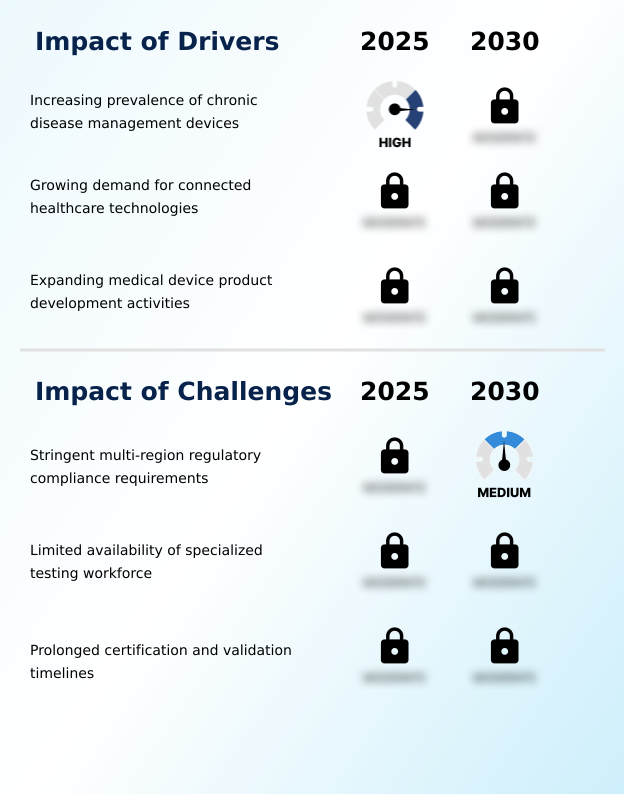
What are the key market drivers leading to the rise in the adoption of Medical Device Testing Industry?

  • The increasing prevalence of chronic disease management devices serves as a primary driver propelling consistent market expansion.

  • The escalating deployment of chronic disease management systems acts as a primary catalyst for the Medical Device Testing Market, directly expanding the necessity for comprehensive technical assessments.
  • As patient care shifts toward remote patient monitoring, manufacturers must aggressively pursue interoperability validation and stringent cybersecurity resilience testing to ensure secure data transmission.
  • This shift is driven by the urgent need to maintain strict performance metrics while accommodating diverse home-care environments. Consequently, organizations prioritizing these technical upgrades have experienced a 26% decrease in field-related malfunction reports.
  • Additionally, standardizing these assessments has streamlined product commercialization pathways, cutting administrative compliance costs by 14%. These strategic enhancements allow healthcare suppliers to scale production efficiently while satisfying the precise diagnostic accuracy verification requirements of modern therapeutic platforms.

What are the market trends shaping the Medical Device Testing Industry?

  • The accelerating adoption of AI-enabled testing workflows represents a definitive trend fundamentally reshaping market operations.

  • The integration of intelligent anomaly detection represents a transformative trend within the Medical Device Testing Market, reshaping how organizations execute quality management systems. By transitioning from traditional manual inspections to artificial intelligence algorithms, manufacturers can rapidly process extensive datasets to uncover hidden structural flaws.
  • This transition is occurring because software driven medical equipment requires continuous evaluation frameworks capable of adapting to firmware updates. Implementing these advanced methodologies has allowed early adopters to increase error identification rates by 32% while simultaneously reducing validation downtime by 21%.
  • Furthermore, leveraging digital twin simulation within these platforms enables proactive design adjustments, yielding a 15% improvement in overall testing throughput. These technological adaptations empower companies to validate complex systems effectively, automating rigorous automated risk detection procedures without sacrificing operational efficiency or compromising strict clearance timelines.

What challenges does the Medical Device Testing Industry face during its growth?

  • Stringent multi-region regulatory compliance requirements constitute a significant challenge consistently constraining industry growth.

  • Navigating complex multi jurisdictional regulatory frameworks remains a severe constraint within the Medical Device Testing Market, significantly impeding operational agility. Because regional authorities continuously revise their compliance transparency frameworks, manufacturers are forced to duplicate physical evaluations to satisfy varying localized requirements during complex device development.
  • This redundancy creates structural bottlenecks, as companies struggle to align their lifecycle quality management programs across disparate geographic standards. Consequently, organizations navigating these fragmented approval pipelines frequently encounter a 40% extension in overall validation timelines. Furthermore, attempting to harmonize continuous compliance monitoring procedures for international distribution often increases baseline expenditures by up to 22%.
  • These regulatory friction points strain resource allocation, forcing development teams to prioritize redundant administrative reporting over advanced predictive performance modeling and technological innovation.

Exclusive Technavio Analysis on Customer Landscape

The medical device testing market forecasting report includes the adoption lifecycle of the market, covering from the innovator’s stage to the laggard’s stage. It focuses on adoption rates in different regions based on penetration. Furthermore, the medical device testing market report also includes key purchase criteria and drivers of price sensitivity to help companies evaluate and develop their market growth analysis strategies.
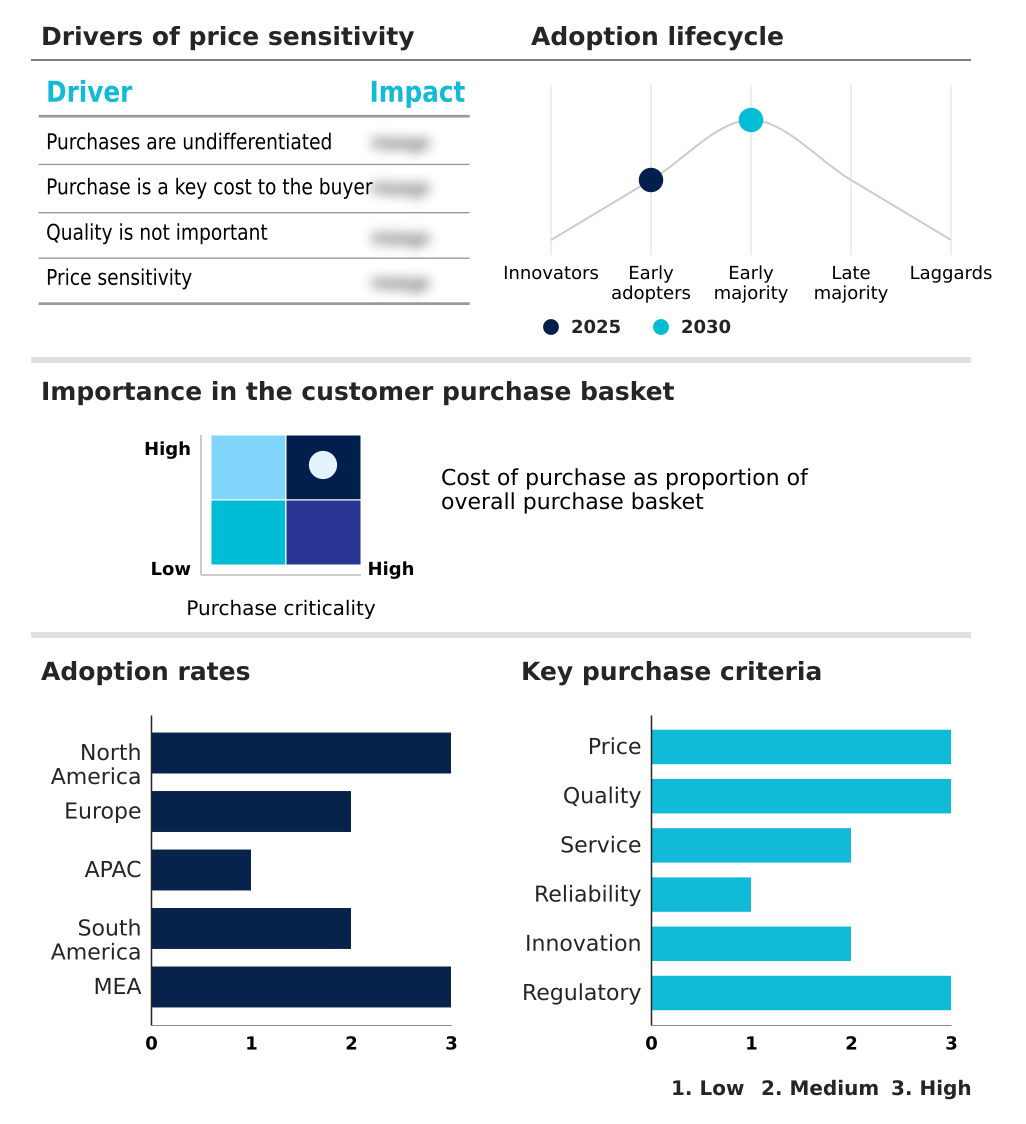
Customer Landscape of Medical Device Testing Industry

Competitive Landscape

Companies are implementing various strategies, such as strategic alliances, medical device testing market forecast, partnerships, mergers and acquisitions, geographical expansion, and product/service launches, to enhance their presence in the industry.

Applus Services Technologies SL - Medical device testing encompasses comprehensive safety evaluations, functional verification, and quality assurance analyses, ensuring sophisticated healthcare products meet strict regulatory requirements before achieving commercial clearance.

The industry research and growth report includes detailed analyses of the competitive landscape of the market and information about key companies, including:

  • Applus Services Technologies SL
  • Bureau Veritas
  • Charles River Laboratories
  • DEKRA SE
  • Element Materials Tech.
  • Eurofins Scientific SE
  • ICON plc
  • Intertek Group Plc
  • Laboratory Holdings Inc.
  • NAMSA LLC
  • Pace Analytical Services LLC
  • SGS SA
  • Sotera Health Co.
  • STERIS plc
  • The Smithers Group Inc.
  • Thermo Fisher Scientific Inc.
  • TUV NORD Group
  • TUV Rheinland Group
  • UL LLC
  • WuXi AppTec Co. Ltd.

Qualitative and quantitative analysis of companies has been conducted to help clients understand the wider business environment as well as the strengths and weaknesses of key industry players. Data is qualitatively analyzed to categorize companies as pure play, category-focused, industry-focused, and diversified; it is quantitatively analyzed to categorize companies as dominant, leading, strong, tentative, and weak.

Recent Development and News in Medical device testing market

  • In the Research and Consulting Services industry, the mandatory integration of automated laboratory frameworks has streamlined validation data management, directly impacting Medical Device Testing demand by improving overall testing throughput by 30%.
  • The transition toward decentralized regulatory review processes has increased requirements for independent technical audits, driving Medical Device Testing providers to expand third-party verification capacities by over 25%.
  • Stringent global sustainability mandates for high-tech hardware have forced a shift toward rigorous material impact analysis, escalating the volume of continuous compliance checks required from Medical Device Testing organizations.
  • The widespread adoption of predictive analytics software within quality management architectures has accelerated the need for intelligent anomaly detection, pushing Medical Device Testing facilities to upgrade analytical infrastructures and reducing average audit times by 18%.

Dive into Technavio’s robust research methodology, blending expert interviews, extensive data synthesis, and validated models for unparalleled Medical Device Testing Market insights. See full methodology.

Market Scope
Page number 302
Base year 2025
Historic period 2020-2024
Forecast period 2026-2030
Growth momentum & CAGR Accelerate at a CAGR of 5.3%
Market growth 2026-2030 USD 3180.0 million
Market structure Fragmented
YoY growth 2025-2026(%) 5.1%
Key countries US, Canada, Mexico, Germany, UK, France, Italy, Spain, The Netherlands, China, Japan, India, South Korea, Australia, Indonesia, Brazil, Argentina, Chile, Saudi Arabia, UAE, South Africa, Turkey and Israel
Competitive landscape Leading Companies, Market Positioning of Companies, Competitive Strategies, and Industry Risks

Request Free Sample

Research Analyst Overview

  • Continuous advancement within the Medical Device Testing Market necessitates rigorous adaptation from hardware developers and regulatory specialists. As product portfolios expand to include AI-driven diagnostic tools, strategic focus is heavily pivoting toward continuous compliance monitoring and predictive performance modeling. Decision-makers are increasingly prioritizing digital twin simulation to preemptively evaluate product responses, fundamentally shifting resource allocation away from late-stage physical prototyping.
  • This strategic adjustment allows development teams to realize a 27% reduction in structural design revisions during final validation phases. Furthermore, ensuring strict interoperability validation and packaging integrity analysis is critical for maintaining supply chain reliability under stringent international mandates. Organizations that integrate robust continuous compliance monitoring into early budgeting avoid costly post-launch remediation efforts.
  • Ultimately, mastering these diagnostic accuracy verification procedures enables companies to secure competitive differentiation, streamline commercialization, and sustain uninterrupted product distribution across highly regulated healthcare environments.

What are the Key Data Covered in this Medical Device Testing Market Research and Growth Report?

  • What is the expected growth of the Medical Device Testing Market between 2026 and 2030?

    • USD 3.18 billion, at a CAGR of 5.3%

  • What segmentation does the market report cover?

    • The report is segmented by Service (Testing, Inspection, and Certification), Type (In-house, and Outsourced), Class Type (Class II, Class III, and Class I) and Geography (North America, Europe, APAC, South America, Middle East and Africa)

  • Which regions are analyzed in the report?

    • North America, Europe, APAC, South America and Middle East and Africa

  • What are the key growth drivers and market challenges?

    • Increasing prevalence of chronic disease management devices, Stringent multi-region regulatory compliance requirements

  • Who are the major players in the Medical Device Testing Market?

    • Applus Services Technologies SL, Bureau Veritas, Charles River Laboratories, DEKRA SE, Element Materials Tech., Eurofins Scientific SE, ICON plc, Intertek Group Plc, Laboratory Holdings Inc., NAMSA LLC, Pace Analytical Services LLC, SGS SA, Sotera Health Co., STERIS plc, The Smithers Group Inc., Thermo Fisher Scientific Inc., TUV NORD Group, TUV Rheinland Group, UL LLC and WuXi AppTec Co. Ltd.

Market Research Insights

  • The Medical Device Testing Market requires precise execution of validation strategies to maintain alignment with evolving healthcare standards. Organizations adopting automated laboratory procedures have improved testing turnaround times by 24% while reducing procedural documentation errors by 14%. The integration of connected healthcare technologies demands rigorous verification cycles to mitigate cybersecurity vulnerabilities and preserve patient safety.
  • Furthermore, navigating complex device development efficiently enables manufacturers to avoid regulatory bottlenecks, leading to a 30% improvement in first-pass approval rates. These operational shifts ensure that sophisticated therapeutic platforms achieve commercial readiness without compromising fundamental data integrity protocols.

We can help! Our analysts can customize this medical device testing market research report to meet your requirements.

Get in touch

1. Executive Summary

1.1 Market overview

Executive Summary - Chart on Market Overview
Executive Summary - Data Table on Market Overview
Executive Summary - Chart on Global Market Characteristics
Executive Summary - Chart on Market by Geography
Executive Summary - Chart on Market Segmentation by Service
Executive Summary - Chart on Market Segmentation by Type
Executive Summary - Chart on Market Segmentation by Class Type
Executive Summary - Chart on Incremental Growth
Executive Summary - Data Table on Incremental Growth
Executive Summary - Chart on Company Market Positioning

2. Technavio Analysis

2.1 Analysis of price sensitivity, lifecycle, customer purchase basket, adoption rates, and purchase criteria

2.2 Criticality of inputs and Factors of differentiation

Chart on Overview on criticality of inputs and factors of differentiation

2.3 Factors of disruption

Chart on Overview on factors of disruption

2.4 Impact of drivers and challenges

Chart on Impact of drivers and challenges in 2025 and 2030

3. Market Landscape

3.1 Market ecosystem

Chart on Parent Market
Data Table on - Parent Market

3.2 Market characteristics

Chart on Market characteristics analysis

3.3 Value chain analysis

Chart on Value chain analysis

4. Market Sizing

4.1 Market definition

Data Table on Offerings of companies included in the market definition

4.2 Market segment analysis

Market segments

4.3 Market size 2025

4.4 Market outlook: Forecast for 2025-2030

Chart on Global - Market size and forecast 2025-2030 ($ million)
Data Table on Global - Market size and forecast 2025-2030 ($ million)
Chart on Global Market: Year-over-year growth 2025-2030 (%)
Data Table on Global Market: Year-over-year growth 2025-2030 (%)

5. Historic Market Size

5.1 Global Medical Device Testing Market 2020 - 2024

Historic Market Size - Data Table on Global Medical Device Testing Market 2020 - 2024 ($ million)

5.2 Service segment analysis 2020 - 2024

Historic Market Size - Service Segment 2020 - 2024 ($ million)

5.3 Type segment analysis 2020 - 2024

Historic Market Size - Type Segment 2020 - 2024 ($ million)

5.4 Class Type segment analysis 2020 - 2024

Historic Market Size - Class Type Segment 2020 - 2024 ($ million)

5.5 Geography segment analysis 2020 - 2024

Historic Market Size - Geography Segment 2020 - 2024 ($ million)

5.6 Country segment analysis 2020 - 2024

Historic Market Size - Country Segment 2020 - 2024 ($ million)

6. Qualitative Analysis

6.1 Impact of AI on global medical device testing market

6.2 Impact of geopolitical conflicts on global medical device testing market

7. Five Forces Analysis

7.1 Five forces summary

Five forces analysis - Comparison between 2025 and 2030

7.2 Bargaining power of buyers

Bargaining power of buyers - Impact of key factors 2025 and 2030

7.3 Bargaining power of suppliers

Bargaining power of suppliers - Impact of key factors in 2025 and 2030

7.4 Threat of new entrants

Threat of new entrants - Impact of key factors in 2025 and 2030

7.5 Threat of substitutes

Threat of substitutes - Impact of key factors in 2025 and 2030

7.6 Threat of rivalry

Threat of rivalry - Impact of key factors in 2025 and 2030

7.7 Market condition

Chart on Market condition - Five forces 2025 and 2030

8. Market Segmentation by Service

8.1 Market segments

Chart on Service - Market share 2025-2030 (%)
Data Table on Service - Market share 2025-2030 (%)

8.2 Comparison by Service

Chart on Comparison by Service
Data Table on Comparison by Service

8.3 Testing - Market size and forecast 2025-2030

Chart on Testing - Market size and forecast 2025-2030 ($ million)
Data Table on Testing - Market size and forecast 2025-2030 ($ million)
Chart on Testing - Year-over-year growth 2025-2030 (%)
Data Table on Testing - Year-over-year growth 2025-2030 (%)

8.4 Inspection - Market size and forecast 2025-2030

Chart on Inspection - Market size and forecast 2025-2030 ($ million)
Data Table on Inspection - Market size and forecast 2025-2030 ($ million)
Chart on Inspection - Year-over-year growth 2025-2030 (%)
Data Table on Inspection - Year-over-year growth 2025-2030 (%)

8.5 Certification - Market size and forecast 2025-2030

Chart on Certification - Market size and forecast 2025-2030 ($ million)
Data Table on Certification - Market size and forecast 2025-2030 ($ million)
Chart on Certification - Year-over-year growth 2025-2030 (%)
Data Table on Certification - Year-over-year growth 2025-2030 (%)

8.6 Market opportunity by Service

Market opportunity by Service ($ million)
Data Table on Market opportunity by Service ($ million)

9. Market Segmentation by Type

9.1 Market segments

Chart on Type - Market share 2025-2030 (%)
Data Table on Type - Market share 2025-2030 (%)

9.2 Comparison by Type

Chart on Comparison by Type
Data Table on Comparison by Type

9.3 In-house - Market size and forecast 2025-2030

Chart on In-house - Market size and forecast 2025-2030 ($ million)
Data Table on In-house - Market size and forecast 2025-2030 ($ million)
Chart on In-house - Year-over-year growth 2025-2030 (%)
Data Table on In-house - Year-over-year growth 2025-2030 (%)

9.4 Outsourced - Market size and forecast 2025-2030

Chart on Outsourced - Market size and forecast 2025-2030 ($ million)
Data Table on Outsourced - Market size and forecast 2025-2030 ($ million)
Chart on Outsourced - Year-over-year growth 2025-2030 (%)
Data Table on Outsourced - Year-over-year growth 2025-2030 (%)

9.5 Market opportunity by Type

Market opportunity by Type ($ million)
Data Table on Market opportunity by Type ($ million)

10. Market Segmentation by Class Type

10.1 Market segments

Chart on Class Type - Market share 2025-2030 (%)
Data Table on Class Type - Market share 2025-2030 (%)

10.2 Comparison by Class Type

Chart on Comparison by Class Type
Data Table on Comparison by Class Type

10.3 Class II - Market size and forecast 2025-2030

Chart on Class II - Market size and forecast 2025-2030 ($ million)
Data Table on Class II - Market size and forecast 2025-2030 ($ million)
Chart on Class II - Year-over-year growth 2025-2030 (%)
Data Table on Class II - Year-over-year growth 2025-2030 (%)

10.4 Class III - Market size and forecast 2025-2030

Chart on Class III - Market size and forecast 2025-2030 ($ million)
Data Table on Class III - Market size and forecast 2025-2030 ($ million)
Chart on Class III - Year-over-year growth 2025-2030 (%)
Data Table on Class III - Year-over-year growth 2025-2030 (%)

10.5 Class I - Market size and forecast 2025-2030

Chart on Class I - Market size and forecast 2025-2030 ($ million)
Data Table on Class I - Market size and forecast 2025-2030 ($ million)
Chart on Class I - Year-over-year growth 2025-2030 (%)
Data Table on Class I - Year-over-year growth 2025-2030 (%)

10.6 Market opportunity by Class Type

Market opportunity by Class Type ($ million)
Data Table on Market opportunity by Class Type ($ million)

11. Customer Landscape

11.1 Customer landscape overview

Analysis of price sensitivity, lifecycle, customer purchase basket, adoption rates, and purchase criteria

12. Geographic Landscape

12.1 Geographic segmentation

Chart on Market share by geography 2025-2030 (%)
Data Table on Market share by geography 2025-2030 (%)

12.2 Geographic comparison

Chart on Geographic comparison
Data Table on Geographic comparison

12.3 North America - Market size and forecast 2025-2030

Chart on North America - Market size and forecast 2025-2030 ($ million)
Data Table on North America - Market size and forecast 2025-2030 ($ million)
Chart on North America - Year-over-year growth 2025-2030 (%)
Data Table on North America - Year-over-year growth 2025-2030 (%)
Chart on Regional Comparison - North America
Data Table on Regional Comparison - North America

12.3.1 US - Market size and forecast 2025-2030

Chart on US - Market size and forecast 2025-2030 ($ million)
Data Table on US - Market size and forecast 2025-2030 ($ million)
Chart on US - Year-over-year growth 2025-2030 (%)
Data Table on US - Year-over-year growth 2025-2030 (%)

12.3.2 Canada - Market size and forecast 2025-2030

Chart on Canada - Market size and forecast 2025-2030 ($ million)
Data Table on Canada - Market size and forecast 2025-2030 ($ million)
Chart on Canada - Year-over-year growth 2025-2030 (%)
Data Table on Canada - Year-over-year growth 2025-2030 (%)

12.3.3 Mexico - Market size and forecast 2025-2030

Chart on Mexico - Market size and forecast 2025-2030 ($ million)
Data Table on Mexico - Market size and forecast 2025-2030 ($ million)
Chart on Mexico - Year-over-year growth 2025-2030 (%)
Data Table on Mexico - Year-over-year growth 2025-2030 (%)

12.4 Europe - Market size and forecast 2025-2030

Chart on Europe - Market size and forecast 2025-2030 ($ million)
Data Table on Europe - Market size and forecast 2025-2030 ($ million)
Chart on Europe - Year-over-year growth 2025-2030 (%)
Data Table on Europe - Year-over-year growth 2025-2030 (%)
Chart on Regional Comparison - Europe
Data Table on Regional Comparison - Europe

12.4.1 Germany - Market size and forecast 2025-2030

Chart on Germany - Market size and forecast 2025-2030 ($ million)
Data Table on Germany - Market size and forecast 2025-2030 ($ million)
Chart on Germany - Year-over-year growth 2025-2030 (%)
Data Table on Germany - Year-over-year growth 2025-2030 (%)

12.4.2 UK - Market size and forecast 2025-2030

Chart on UK - Market size and forecast 2025-2030 ($ million)
Data Table on UK - Market size and forecast 2025-2030 ($ million)
Chart on UK - Year-over-year growth 2025-2030 (%)
Data Table on UK - Year-over-year growth 2025-2030 (%)

12.4.3 France - Market size and forecast 2025-2030

Chart on France - Market size and forecast 2025-2030 ($ million)
Data Table on France - Market size and forecast 2025-2030 ($ million)
Chart on France - Year-over-year growth 2025-2030 (%)
Data Table on France - Year-over-year growth 2025-2030 (%)

12.4.4 Italy - Market size and forecast 2025-2030

Chart on Italy - Market size and forecast 2025-2030 ($ million)
Data Table on Italy - Market size and forecast 2025-2030 ($ million)
Chart on Italy - Year-over-year growth 2025-2030 (%)
Data Table on Italy - Year-over-year growth 2025-2030 (%)

12.4.5 Spain - Market size and forecast 2025-2030

Chart on Spain - Market size and forecast 2025-2030 ($ million)
Data Table on Spain - Market size and forecast 2025-2030 ($ million)
Chart on Spain - Year-over-year growth 2025-2030 (%)
Data Table on Spain - Year-over-year growth 2025-2030 (%)

12.4.6 The Netherlands - Market size and forecast 2025-2030

Chart on The Netherlands - Market size and forecast 2025-2030 ($ million)
Data Table on The Netherlands - Market size and forecast 2025-2030 ($ million)
Chart on The Netherlands - Year-over-year growth 2025-2030 (%)
Data Table on The Netherlands - Year-over-year growth 2025-2030 (%)

12.5 APAC - Market size and forecast 2025-2030

Chart on APAC - Market size and forecast 2025-2030 ($ million)
Data Table on APAC - Market size and forecast 2025-2030 ($ million)
Chart on APAC - Year-over-year growth 2025-2030 (%)
Data Table on APAC - Year-over-year growth 2025-2030 (%)
Chart on Regional Comparison - APAC
Data Table on Regional Comparison - APAC

12.5.1 China - Market size and forecast 2025-2030

Chart on China - Market size and forecast 2025-2030 ($ million)
Data Table on China - Market size and forecast 2025-2030 ($ million)
Chart on China - Year-over-year growth 2025-2030 (%)
Data Table on China - Year-over-year growth 2025-2030 (%)

12.5.2 Japan - Market size and forecast 2025-2030

Chart on Japan - Market size and forecast 2025-2030 ($ million)
Data Table on Japan - Market size and forecast 2025-2030 ($ million)
Chart on Japan - Year-over-year growth 2025-2030 (%)
Data Table on Japan - Year-over-year growth 2025-2030 (%)

12.5.3 India - Market size and forecast 2025-2030

Chart on India - Market size and forecast 2025-2030 ($ million)
Data Table on India - Market size and forecast 2025-2030 ($ million)
Chart on India - Year-over-year growth 2025-2030 (%)
Data Table on India - Year-over-year growth 2025-2030 (%)

12.5.4 South Korea - Market size and forecast 2025-2030

Chart on South Korea - Market size and forecast 2025-2030 ($ million)
Data Table on South Korea - Market size and forecast 2025-2030 ($ million)
Chart on South Korea - Year-over-year growth 2025-2030 (%)
Data Table on South Korea - Year-over-year growth 2025-2030 (%)

12.5.5 Australia - Market size and forecast 2025-2030

Chart on Australia - Market size and forecast 2025-2030 ($ million)
Data Table on Australia - Market size and forecast 2025-2030 ($ million)
Chart on Australia - Year-over-year growth 2025-2030 (%)
Data Table on Australia - Year-over-year growth 2025-2030 (%)

12.5.6 Indonesia - Market size and forecast 2025-2030

Chart on Indonesia - Market size and forecast 2025-2030 ($ million)
Data Table on Indonesia - Market size and forecast 2025-2030 ($ million)
Chart on Indonesia - Year-over-year growth 2025-2030 (%)
Data Table on Indonesia - Year-over-year growth 2025-2030 (%)

12.6 South America - Market size and forecast 2025-2030

Chart on South America - Market size and forecast 2025-2030 ($ million)
Data Table on South America - Market size and forecast 2025-2030 ($ million)
Chart on South America - Year-over-year growth 2025-2030 (%)
Data Table on South America - Year-over-year growth 2025-2030 (%)
Chart on Regional Comparison - South America
Data Table on Regional Comparison - South America

12.6.1 Brazil - Market size and forecast 2025-2030

Chart on Brazil - Market size and forecast 2025-2030 ($ million)
Data Table on Brazil - Market size and forecast 2025-2030 ($ million)
Chart on Brazil - Year-over-year growth 2025-2030 (%)
Data Table on Brazil - Year-over-year growth 2025-2030 (%)

12.6.2 Argentina - Market size and forecast 2025-2030

Chart on Argentina - Market size and forecast 2025-2030 ($ million)
Data Table on Argentina - Market size and forecast 2025-2030 ($ million)
Chart on Argentina - Year-over-year growth 2025-2030 (%)
Data Table on Argentina - Year-over-year growth 2025-2030 (%)

12.6.3 Chile - Market size and forecast 2025-2030

Chart on Chile - Market size and forecast 2025-2030 ($ million)
Data Table on Chile - Market size and forecast 2025-2030 ($ million)
Chart on Chile - Year-over-year growth 2025-2030 (%)
Data Table on Chile - Year-over-year growth 2025-2030 (%)

12.7 Middle East and Africa - Market size and forecast 2025-2030

Chart on Middle East and Africa - Market size and forecast 2025-2030 ($ million)
Data Table on Middle East and Africa - Market size and forecast 2025-2030 ($ million)
Chart on Middle East and Africa - Year-over-year growth 2025-2030 (%)
Data Table on Middle East and Africa - Year-over-year growth 2025-2030 (%)
Chart on Regional Comparison - Middle East and Africa
Data Table on Regional Comparison - Middle East and Africa

12.7.1 Saudi Arabia - Market size and forecast 2025-2030

Chart on Saudi Arabia - Market size and forecast 2025-2030 ($ million)
Data Table on Saudi Arabia - Market size and forecast 2025-2030 ($ million)
Chart on Saudi Arabia - Year-over-year growth 2025-2030 (%)
Data Table on Saudi Arabia - Year-over-year growth 2025-2030 (%)

12.7.2 UAE - Market size and forecast 2025-2030

Chart on UAE - Market size and forecast 2025-2030 ($ million)
Data Table on UAE - Market size and forecast 2025-2030 ($ million)
Chart on UAE - Year-over-year growth 2025-2030 (%)
Data Table on UAE - Year-over-year growth 2025-2030 (%)

12.7.3 South Africa - Market size and forecast 2025-2030

Chart on South Africa - Market size and forecast 2025-2030 ($ million)
Data Table on South Africa - Market size and forecast 2025-2030 ($ million)
Chart on South Africa - Year-over-year growth 2025-2030 (%)
Data Table on South Africa - Year-over-year growth 2025-2030 (%)

12.7.4 Turkey - Market size and forecast 2025-2030

Chart on Turkey - Market size and forecast 2025-2030 ($ million)
Data Table on Turkey - Market size and forecast 2025-2030 ($ million)
Chart on Turkey - Year-over-year growth 2025-2030 (%)
Data Table on Turkey - Year-over-year growth 2025-2030 (%)

12.7.5 Israel - Market size and forecast 2025-2030

Chart on Israel - Market size and forecast 2025-2030 ($ million)
Data Table on Israel - Market size and forecast 2025-2030 ($ million)
Chart on Israel - Year-over-year growth 2025-2030 (%)
Data Table on Israel - Year-over-year growth 2025-2030 (%)

12.8 Market opportunity by geography

Market opportunity by geography ($ million)
Data Tables on Market opportunity by geography ($ million)

13. Drivers, Challenges, and Opportunity

13.1 Market drivers

Increasing prevalence of chronic disease management devices
Growing demand for connected healthcare technologies
Expanding medical device product development activities

13.2 Market challenges

Stringent multi-region regulatory compliance requirements
Limited availability of specialized testing workforce
Prolonged certification and validation timelines

13.3 Impact of drivers and challenges

Impact of drivers and challenges in 2025 and 2030

13.4 Market opportunities

Accelerating adoption of AI-enabled testing workflows
Evolving use of digital twin platforms in verification processes
Growing shift toward integrated end-to-end testing services

14. Competitive Landscape

14.1 Overview

14.2

Overview on criticality of inputs and factors of differentiation

14.3 Landscape disruption

Overview on factors of disruption

14.4 Industry risks

Impact of key risks on business

15. Competitive Analysis

15.1 Companies profiled

Companies covered

15.2 Company ranking index

15.3 Market positioning of companies

Matrix on companies position and classification

15.4 Applus Services Technologies SL

Applus Services Technologies SL - Overview
Applus Services Technologies SL - Product / Service
Applus Services Technologies SL - Key offerings
SWOT

15.5 Bureau Veritas

Bureau Veritas - Overview
Bureau Veritas - Business segments
Bureau Veritas - Key offerings
Bureau Veritas - Segment focus
SWOT

15.6 Charles River Laboratories

Charles River Laboratories - Overview
Charles River Laboratories - Business segments
Charles River Laboratories - Key offerings
Charles River Laboratories - Segment focus
SWOT

15.7 DEKRA SE

DEKRA SE - Overview
DEKRA SE - Product / Service
DEKRA SE - Key offerings
SWOT

15.8 Eurofins Scientific SE

Eurofins Scientific SE - Overview
Eurofins Scientific SE - Business segments
Eurofins Scientific SE - Key offerings
Eurofins Scientific SE - Segment focus
SWOT

15.9 ICON plc

ICON plc - Overview
ICON plc - Product / Service
ICON plc - Key offerings
SWOT

15.10 Intertek Group Plc

Intertek Group Plc - Overview
Intertek Group Plc - Business segments
Intertek Group Plc - Key offerings
Intertek Group Plc - Segment focus
SWOT

15.11 Laboratory Holdings Inc.

Laboratory Holdings Inc. - Overview
Laboratory Holdings Inc. - Business segments
Laboratory Holdings Inc. - Key offerings
Laboratory Holdings Inc. - Segment focus
SWOT

15.12 SGS SA

SGS SA - Overview
SGS SA - Business segments
SGS SA - Key offerings
SGS SA - Segment focus
SWOT

15.13 Sotera Health Co.

Sotera Health Co. - Overview
Sotera Health Co. - Business segments
Sotera Health Co. - Key offerings
Sotera Health Co. - Segment focus
SWOT

15.14 STERIS plc

STERIS plc - Overview
STERIS plc - Business segments
STERIS plc - Key offerings
STERIS plc - Segment focus
SWOT

15.15 Thermo Fisher Scientific Inc.

Thermo Fisher Scientific Inc. - Overview
Thermo Fisher Scientific Inc. - Business segments
Thermo Fisher Scientific Inc. - Key news
Thermo Fisher Scientific Inc. - Key offerings
Thermo Fisher Scientific Inc. - Segment focus
SWOT

15.16 TUV NORD Group

TUV NORD Group - Overview
TUV NORD Group - Product / Service
TUV NORD Group - Key offerings
SWOT

15.17 UL LLC

UL LLC - Overview
UL LLC - Business segments
UL LLC - Key offerings
UL LLC - Segment focus
SWOT

15.18 WuXi AppTec Co. Ltd.

WuXi AppTec Co. Ltd. - Overview
WuXi AppTec Co. Ltd. - Business segments
WuXi AppTec Co. Ltd. - Key offerings
WuXi AppTec Co. Ltd. - Segment focus
SWOT

16. Appendix

16.1 Scope of the report

Market definition
Objectives
Notes and caveats

16.2 Inclusions and exclusions checklist

Inclusions checklist
Exclusions checklist

16.3 Currency conversion rates for US$

16.4 Research methodology

16.5 Data procurement

Information sources

16.6 Data validation

16.7 Validation techniques employed for market sizing

16.8 Data synthesis

16.9 360 degree market analysis

16.10 List of abbreviations

Research Methodology

Technavio presents a detailed picture of the market by way of study, synthesis, and summation of data from multiple sources. The analysts have presented the various facets of the market with a particular focus on identifying the key industry influencers. The data thus presented is comprehensive, reliable, and the result of extensive research, both primary and secondary.

INFORMATION SOURCES

Primary sources

  • Manufacturers and suppliers
  • Channel partners
  • Industry experts
  • Strategic decision makers

Secondary sources

  • Industry journals and periodicals
  • Government data
  • Financial reports of key industry players
  • Historical data
  • Press releases

DATA ANALYSIS

Data Synthesis

  • Collation of data
  • Estimation of key figures
  • Analysis of derived insights

Data Validation

  • Triangulation with data models
  • Reference against proprietary databases
  • Corroboration with industry experts

REPORT WRITING

Qualitative

  • Market drivers
  • Market challenges
  • Market trends
  • Five forces analysis

Quantitative

  • Market size and forecast
  • Market segmentation
  • Geographical insights
  • Competitive landscape

Interested in this report?

Get your sample now to see our research methodology and insights!

Download Now

Frequently Asked Questions

Medical Device Testing market growth will increase by USD 3180.0 million during 2026-2030.

The Medical Device Testing market is expected to grow at a CAGR of 5.3% during 2026-2030.

Medical Device Testing market is segmented by Service (Testing, Inspection, Certification) Type (In-house, Outsourced) Class type (Class II, Class III, Class I)

Applus Services Technologies SL, Bureau Veritas, Charles River Laboratories, DEKRA SE, Element Materials Tech., Eurofins Scientific SE, ICON plc, Intertek Group Plc, Laboratory Holdings Inc., NAMSA LLC, Pace Analytical Services LLC, SGS SA, Sotera Health Co., STERIS plc, The Smithers Group Inc., Thermo Fisher Scientific Inc., TUV NORD Group, TUV Rheinland Group, UL LLC, WuXi AppTec Co. Ltd. are a few of the key vendors in the Medical Device Testing market.

North America will register the highest growth rate of 39.8% among the other regions. Therefore, the Medical Device Testing market in North America is expected to garner significant business opportunities for the vendors during the forecast period.

US, Canada, Mexico, Germany, UK, France, Italy, Spain, The Netherlands, China, Japan, India, South Korea, Australia, Indonesia, Brazil, Argentina, Chile, Saudi Arabia, UAE, South Africa, Turkey, Israel

  • Increasing prevalence of chronic disease management devices is the driving factor this market.

The Medical Device Testing market vendors should focus on grabbing business opportunities from the Service segment as it accounted for the largest market share in the base year.
RIA - Research AI Assistant
Ask RIA
