Arcade Gaming Market Analysis, Size, and Forecast 2025-2029: APAC (China, India, Japan), North America (US and Canada), Europe (France, Germany, UK), Middle East and Africa , and South America (Brazil)

Arcade Gaming Market Analysis, Size, and Forecast 2025-2029:
APAC (China, India, Japan), North America (US and Canada), Europe (France, Germany, UK), Middle East and Africa , and South America (Brazil)

Published: Dec 2024 220 Pages SKU: IRTNTR43930

Market Overview at a Glance

$2.00 B
Market Opportunity
1.9%
CAGR
1.9
YoY growth 2024-2025(%)

Arcade Gaming Market Size 2025-2029

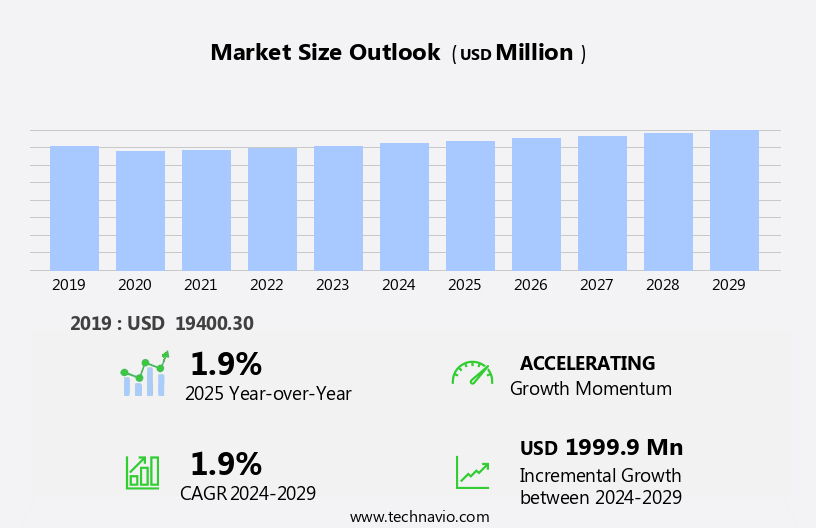
The arcade gaming market size is forecast to increase by USD 2 billion, at a CAGR of 1.9% between 2024 and 2029.

  • The market is experiencing significant growth, driven by the increasing popularity of physical activities in gaming. This trend is reflected in the rising demand for arcade gaming experiences, which offer a unique blend of social interaction and immersive entertainment. Another key driver is the integration of Virtual Reality (VR) technology in arcade games, providing players with more engaging and realistic experiences. However, this market also faces challenges, with the high cost of arcade gaming machines being a significant obstacle for some businesses. Despite this, companies seeking to capitalize on market opportunities can explore partnerships and collaborations to share costs and resources, while also focusing on offering diverse gaming options and innovative experiences to attract and retain customers.
  • The integration of VR technology, when executed effectively, can offer a competitive edge and help differentiate offerings in the market. Overall, the market presents both opportunities and challenges, requiring strategic planning and a focus on delivering engaging, accessible, and cost-effective gaming experiences.

What will be the Size of the Arcade Gaming Market during the forecast period?

Arcade Gaming Market Size

Request Free Sample

The market continues to evolve, with dynamic market activities unfolding across various sectors. Character and level design in game development are key elements of revenue management in arcades, where themed environments captivate players. Data analytics plays a crucial role in understanding player behavior and optimizing game offerings. Safety regulations and space planning are integral to arcade cabinet design, with network connectivity enabling multiplayer games and online gaming. Virtual reality (VR) and augmented reality (AR) technologies offer immersive experiences, while parts replacement and game maintenance ensure operational efficiency. Crane games, coin mechanisms, and ticket dispensers contribute to the revenue model, with franchise opportunities expanding the market reach.

Power supplies and operating systems ensure smooth gameplay, while control panels and sound design enhance the player experience. Software licensing, game boards, and game software are essential components of the arcade ecosystem, with player retention strategies focusing on customer acquisition, customer service, and technical support. Energy consumption is a growing concern, with motion sensors and touchscreen technology offering energy-efficient solutions. Location-based entertainment (LBE) and licensing agreements offer investment opportunities, with player tracking and game programming enabling personalized experiences. Game physics and player experience are at the heart of game design, with fighting games and puzzle games catering to diverse player preferences.

Safety regulations, prize redemption, and player age ratings are essential considerations in the arcade industry, with bill acceptors and camera systems ensuring operational efficiency and security. Light guns and interactive displays add excitement, while game violence and gambling regulations require careful attention. Air hockey and dance machines offer unique experiences, with game repair and marketing strategies ensuring customer satisfaction. The ongoing evolution of the market reflects the continuous integration of technology, design, and player experience.

How is this Arcade Gaming Industry segmented?

The arcade gaming industry research report provides comprehensive data (region-wise segment analysis), with forecasts and estimates in "USD million" for the period 2025-2029, as well as historical data from 2019-2023 for the following segments.

  • End-user
    • Gaming hubs
    • Semi-commercial
    • Residential
  • Genre
    • Racing
    • Shooting
    • Sports
    • Action
  • Type
    • Video games
    • Simulation games
    • Mechanical games
  • Power
    • Electric
    • Battery
    • Hybrid
  • Control Mechanism
    • Joystick
    • Buttons
    • Trackball
    • Motion Controls
  • Geography
    • North America
      • US
      • Canada
    • Europe
      • France
      • Germany
      • UK
    • APAC
      • China
      • India
      • Japan
    • South America
      • Brazil
    • Rest of World (ROW)

By End-user Insights

The gaming hubs segment is estimated to witness significant growth during the forecast period.

The market encompasses various segments, including redemption games, pinball machines, revenue management, themed environments, data analytics, game development, safety regulations, space planning, arcade cabinets, network connectivity, ticket dispensers, power supplies, artificial intelligence (AI), and more. Arcade gaming hubs, which house these advanced machines, accounted for the largest market share in 2024. Gaming hubs offer consumers access to expensive equipment, such as high-tech simulators and virtual reality (VR) games, which are beyond the reach of average consumers. The integration of AI, motion sensors, and touchscreen technology in arcade games has led to the development of immersive and harmonious player experiences.

Furthermore, the implementation of network connectivity and software licensing enables multiplayer games, online gaming, and location-based entertainment (LBE). Revenue management through ticket dispensers, bill acceptors, and player tracking systems ensures operational efficiency and player retention. Safety regulations and game physics play a crucial role in the design of arcade games, from character design and level design to racing games and gameplay mechanics. The market also includes puzzle games, crane games, and coin mechanisms. Franchise opportunities and marketing strategies attract businesses, while game maintenance, parts replacement, and customer service ensure a positive player experience. Emerging technologies, such as VR, AR, and energy-efficient power supplies, offer investment opportunities for businesses looking to innovate and stay competitive.

Game software, control panels, sound design, and game programming are essential components of game development. Additionally, safety regulations, prize redemption, and camera systems are crucial for maintaining a secure and enjoyable gaming environment. The integration of advanced technologies in arcade gaming continues to evolve, with motion sensors, interactive displays, and photo booths enhancing the overall gaming experience. Amusement parks and air hockey tables remain popular attractions, while casino-style gambling regulations and game age ratings ensure a responsible gaming environment. In conclusion, the market is a dynamic and evolving industry, with a focus on creating immersive, engaging, and innovative gaming experiences for consumers. From revenue management and safety regulations to game design and emerging technologies, the market continues to push the boundaries of what is possible in the world of arcade gaming.

Arcade Gaming Market Size

Request Free Sample

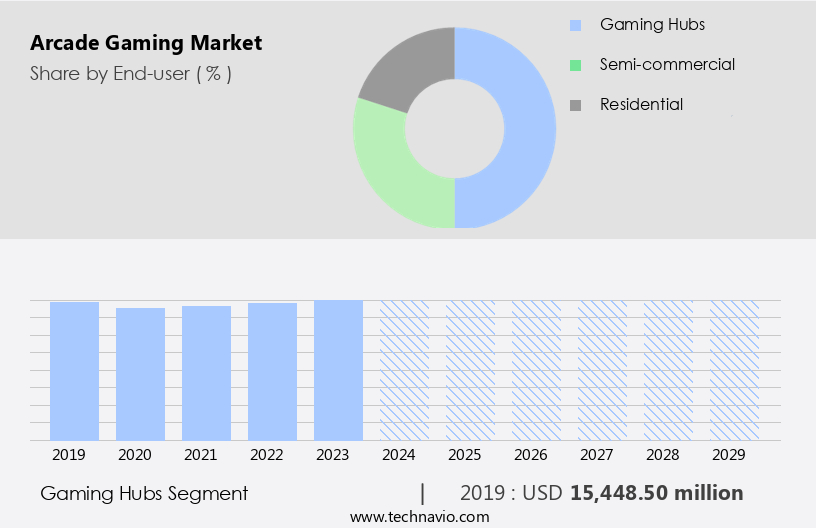
The Gaming hubs segment was valued at USD 15.45 billion in 2019 and showed a gradual increase during the forecast period.

Regional Analysis

APAC is estimated to contribute 51% to the growth of the global market during the forecast period.Technavio's analysts have elaborately explained the regional trends and drivers that shape the market during the forecast period.

Arcade Gaming Market Share by Geography

 Request Free Sample

The market in APAC is experiencing significant growth, with Japan being a major hub for innovations in arcade gaming technology. Companies like Sony Corporation (Sony) and Nintendo Co Ltd. (Nintendo) are leading this evolution, introducing advanced games with high graphics capabilities, such as simulators. The region's substantial growth in developing countries, including India and China, is a significant driver for the industry's expansion. Themed environments, data analytics, and revenue management are essential aspects of the market, ensuring operational efficiency and player retention. Safety regulations, space planning, and network connectivity are also crucial elements, ensuring a safe and enjoyable experience for players.

Game development, including character and level design, is a critical focus area, with racing games, puzzle games, and fighting games being popular choices. Multiplayer games and virtual reality (VR) experiences are also gaining traction, offering immersive and interactive gaming experiences. Arcade cabinets, ticket dispensers, power supplies, and coin mechanisms are essential components of the arcade gaming ecosystem. Game software, control panels, sound design, and software licensing are also vital for game maintenance and repair. Augmented reality (AR) and motion sensors are emerging technologies in the arcade gaming industry, adding an extra layer of excitement and engagement for players. Prize redemption, player tracking, and game programming are also essential elements, ensuring a seamless gaming experience.

Investment opportunities in the market are plentiful, with franchise opportunities, amusement parks, and location-based entertainment (LBE) being popular areas for investment. Energy consumption and player experience are also critical factors for investors, as they ensure long-term sustainability and customer satisfaction. The market is subject to various regulations, including gambling regulations and game age ratings. Operational efficiency, customer acquisition, customer service, and technical support are essential for maintaining a successful business. In conclusion, the market in APAC is dynamic and evolving, with a focus on innovation, player experience, and operational efficiency. The integration of advanced technologies, such as AI and VR, is transforming the industry, offering new opportunities for growth and investment.

Market Dynamics

Our researchers analyzed the data with 2024 as the base year, along with the key drivers, trends, and challenges. A holistic analysis of drivers will help companies refine their marketing strategies to gain a competitive advantage.

The arcade gaming equipment market is evolving as enthusiasts and operators invest in arcade cabinet LED lighting installation and upgrading arcade game audio systems to enhance visual and sound experiences. The demand for improving arcade game video quality and customizing arcade joystick and buttons is driving innovation, while repairing faulty arcade control panels and restoring damaged arcade cabinet artwork remain vital for maintaining operational integrity and nostalgic appeal. Advanced restoration techniques, including using 3D printing for arcade restoration and preserving classic arcade game hardware, ensure long-term functionality.

Recent adoption rates for implementing modern arcade game features have risen by 18.4%, while projections indicate a 25.7% increase in demand for integrating online multiplayer in arcade games to attract younger audiences. This growth aligns with trends in optimizing arcade game performance and modifying arcade game gameplay mechanics for greater replay value.

Comparative performance data shows that arcades utilizing multi-game arcade boards and arcade game emulation systems achieved 9.6% higher customer retention than those relying solely on legacy setups. Additionally, documenting arcade game repair techniques and building a custom arcade game cabinet have contributed to knowledge preservation, while adding accessibility features to arcade games broadens player inclusivity. Together, these advancements combine heritage preservation with modern upgrades, ensuring arcade gaming remains relevant in the digital era.

What are the key market drivers leading to the rise in the adoption of Arcade Gaming Industry?

  • The growth of the market is primarily fueled by the rise in physical activity levels associated with modern gaming experiences. The market continues to evolve, integrating technology to create immersive and interactive experiences for players. Redemption games and pinball machines remain popular, but the market is increasingly focused on game development and themed environments. Revenue management, space planning, and safety regulations are key considerations.
  • Advanced technologies like data analytics, artificial intelligence (AI), network connectivity, and ticket dispensers are transforming arcades. Game design incorporates operating systems, arcade cabinets, and power supplies to deliver high-quality gaming experiences. Multiplayer games, fighting games, and themed environments are popular genres.
  • Safety regulations ensure that arcades provide a safe and enjoyable experience for all visitors. Innovations like VR headsets, motion controllers, and tracking devices are enhancing the gaming experience by allowing players to engage physically in the virtual world. Arcade design continues to prioritize immersive and harmonious environments, emphasizing the importance of a well-planned and executed gaming space.

What are the market trends shaping the Arcade Gaming Industry?

  • The integration of virtual reality (VR) technology in arcade games is an emerging market trend. This innovation is set to redefine the gaming industry, offering immersive experiences for players.
  • Virtual Reality (VR) is revolutionizing the gaming industry, expanding its reach beyond traditional consoles and PCs into the realm of location-based entertainment (LBE). VR solutions aim to provide a realistic and immersive virtual environment, stimulating user presence. VR-based arcade games have gained traction in recent years, with more titles expected to emerge. Vertigo, a leading player, offers a diverse portfolio of VR games for LBE, including arcade games. This strategic alliance is set to increase the adoption of VR arcade games. The American Amusement & Music Operators Association (AAMOA) convention in Las Vegas in March 2022 highlighted the significance of VR technology in arcades and LBE games.
  • Character and level design, gameplay mechanics, sound design, and control panels are essential elements of VR arcade games. Crane games and coin mechanisms have a place in this evolving market, with software licensing and game maintenance ensuring smooth operations. Franchise opportunities abound as developers and operators seek to capitalize on the growing popularity of VR gaming. Online gaming and game software are integral parts of the VR the market, with parts replacement and game maintenance ensuring a consistent user experience. The market dynamics are driven by the immersive and harmonious nature of VR gaming, making it an exciting prospect for businesses.

What challenges does the Arcade Gaming Industry face during its growth?

  • The escalating costs of arcade gaming machines pose a significant challenge to the industry's growth trajectory.  The market is characterized by substantial investments in advanced technologies and immersive experiences. Arcade gaming machines, known for their location-based entertainment (LBE) offerings, require significant resources for development, licensing agreements, and maintenance. These machines, featuring specialized hardware, interactive displays, and captivating gameplay, often involve high costs for operators and developers. Modern arcade gaming machines, incorporating technologies like augmented reality (AR) and virtual reality (VR), necessitate substantial research and development expenses.
  • For instance, The Void's VR-based arcade gaming machines provide players with immersive, interactive experiences through a network of physical locations. The high cost of arcade gaming machines influences market dynamics, affecting pricing strategies and consumer accessibility.
  • Game physics, player retention, and player tracking are essential components of arcade gaming, requiring specialized game programming and game violence considerations. Additionally, compliance with gambling regulations and game age ratings further adds to the overall expenses. Investment opportunities exist in the market, particularly for companies focusing on energy-efficient technologies and innovative game concepts. Bill acceptors, light guns, and photo booths are additional revenue streams for operators in the market. Overall, the arcade gaming industry continues to evolve, offering unique opportunities for growth and innovation.

Exclusive Customer Landscape

The arcade gaming market forecasting report includes the adoption lifecycle of the market, covering from the innovator's stage to the laggard's stage. It focuses on adoption rates in different regions based on penetration. Furthermore, the arcade gaming market report also includes key purchase criteria and drivers of price sensitivity to help companies evaluate and develop their market growth analysis strategies.

Arcade Gaming Market Share by Geography

 Customer Landscape

Key Companies & Market Insights

Companies are implementing various strategies, such as strategic alliances, arcade gaming market forecast, partnerships, mergers and acquisitions, geographical expansion, and product/service launches, to enhance their presence in the industry.

Sega Corporation (Japan) - BANDAI NAMCO Studios Inc., a subsidiary of our corporation, provides access to an extensive collection of arcade games through the NAMCO Museum Arcade Platform. This offering showcases iconic titles, enhancing digital entertainment and engaging audiences worldwide.

The industry research and growth report includes detailed analyses of the competitive landscape of the market and information about key companies, including:

  • Sega Corporation (Japan)
  • Bandai Namco Entertainment (Japan)
  • Konami Holdings Corporation (Japan)
  • Raw Thrills, Inc. (United States)
  • Atari SA (France)
  • Capcom Co., Ltd. (Japan)
  • Taito Corporation (Japan)
  • Stern Pinball, Inc. (United States)
  • Incredible Technologies, Inc. (United States)
  • Adrenaline Amusements (Canada)
  • Bay Tek Entertainment (United States)
  • Elaut Group (Belgium)
  • ICE Games (United States)
  • LAI Games (Australia)
  • Andamiro Co., Ltd. (South Korea)
  • Global VR (United States)
  • Betson Enterprises (United States)
  • Skee-Ball Inc. (United States)
  • PrimeTime Amusements (United States)
  • Namco USA Inc. (United States)

Qualitative and quantitative analysis of companies has been conducted to help clients understand the wider business environment as well as the strengths and weaknesses of key industry players. Data is qualitatively analyzed to categorize companies as pure play, category-focused, industry-focused, and diversified; it is quantitatively analyzed to categorize companies as dominant, leading, strong, tentative, and weak.

Recent Development and News in Arcade Gaming Market

  • In January 2024, gaming giant Nintendo announced the launch of its new arcade system, Nintendo Game & Watch: Super Mario Bros., marking a revival of its iconic handheld gaming devices (Nintendo Press Release). In March 2024, Microsoft and Sony, leading console manufacturers, formed a partnership to expand cloud gaming services, allowing players to access their games across multiple platforms (Microsoft News Center). In April 2025, Tencent Holdings, the world's largest gaming company, acquired a significant stake in Dutch gaming company, Guerrilla Games, boosting its presence in Europe and expanding its portfolio of exclusive games (Reuters). In May 2025, Intel unveiled its new Arcade Graphics Core Architecture, a significant technological advancement in gaming graphics, aiming to provide more realistic visuals and smoother gameplay (Intel Newsroom).

Research Analyst Overview

  • The market is experiencing dynamic shifts, with a focus on enhancing user experience (UX) and accessibility. Classic arcade games are being reimagined through game optimization, making them more appealing to both old and new players. Loyalty programs and software updates are employed to retain customers and keep games fresh. Game streaming and cloud gaming are revolutionizing the industry, allowing players to access their favorite titles from anywhere. Security systems ensure fair play, while game statistics provide valuable insights for tournament organization and demographic analysis. Esports integration and custom game development cater to the competitive gaming community. Cashless payment systems and mobile payment integration simplify transactions.
  • Digital marketing, social media, and community building strategies engage players. Hardware upgrades and remote monitoring maintain arcade machines' optimal performance. Anti-cheating measures and user interface (UI) improvements ensure a level playing field and positive user experience. Virtual tournaments and promotional events create excitement and foster competition. Modern arcade games and retro gaming coexist, appealing to diverse audiences. Competitor analysis is crucial for staying ahead in the market. Game modification and data visualization tools offer endless possibilities for creators.

Dive into Technavio's robust research methodology, blending expert interviews, extensive data synthesis, and validated models for unparalleled Arcade Gaming Market insights. See full methodology.

Market Scope

Report Coverage

Details

Page number

220

Base year

2024

Historic period

2019-2023

Forecast period

2025-2029

Growth momentum & CAGR

Accelerate at a CAGR of 1.9%

Market growth 2025-2029

USD 1999.9 million

Market structure

Fragmented

YoY growth 2024-2025(%)

1.9

Key countries

China, US, Japan, Germany, India, Canada, UK, France, Saudi Arabia, and Brazil

Competitive landscape

Leading Companies, Market Positioning of Companies, Competitive Strategies, and Industry Risks

Request Free Sample

What are the Key Data Covered in this Arcade Gaming Market Research and Growth Report?

  • CAGR of the Arcade Gaming industry during the forecast period
  • Detailed information on factors that will drive the growth and forecasting between 2025 and 2029
  • Precise estimation of the size of the market and its contribution of the industry in focus to the parent market
  • Accurate predictions about upcoming growth and trends and changes in consumer behaviour
  • Growth of the market across APAC, North America, Europe, Middle East and Africa, and South America
  • Thorough analysis of the market's competitive landscape and detailed information about companies
  • Comprehensive analysis of factors that will challenge the arcade gaming market growth of industry companies

We can help! Our analysts can customize this arcade gaming market research report to meet your requirements.

Get in touch

1 Executive Summary

  • 1.1 Market overview
    • Executive Summary - Chart on Market Overview
    • Executive Summary - Data Table on Market Overview
    • Executive Summary - Chart on Global Market Characteristics
    • Executive Summary - Chart on Market by Geography
    • Executive Summary - Chart on Market Segmentation by End-user
    • Executive Summary - Chart on Market Segmentation by Genre
    • Executive Summary - Chart on Market Segmentation by Type
    • Executive Summary - Chart on Incremental Growth
    • Executive Summary - Data Table on Incremental Growth
    • Executive Summary - Chart on Company Market Positioning

2 Technavio Analysis

  • 2.1 Analysis of price sensitivity, lifecycle, customer purchase basket, adoption rates, and purchase criteria
    • Analysis of price sensitivity, lifecycle, customer purchase basket, adoption rates, and purchase criteria
  • 2.2 Criticality of inputs and Factors of differentiation
    • Overview on criticality of inputs and factors of differentiation
  • 2.3 Factors of disruption
    • Overview on factors of disruption
  • 2.4 Impact of drivers and challenges
    • Impact of drivers and challenges in 2024 and 2029

3 Market Landscape

  • 3.1 Market ecosystem
    • Parent Market
    • Data Table on - Parent Market
  • 3.2 Market characteristics
    • Market characteristics analysis
  • 3.3 Value chain analysis
    • Value chain analysis

4 Market Sizing

  • 4.1 Market definition
    • Offerings of companies included in the market definition
  • 4.2 Market segment analysis
    • Market segments
  • 4.3 Market size 2024
    • 4.4 Market outlook: Forecast for 2024-2029
      • Chart on Global - Market size and forecast 2024-2029 ($ million)
      • Data Table on Global - Market size and forecast 2024-2029 ($ million)
      • Chart on Global Market: Year-over-year growth 2024-2029 (%)
      • Data Table on Global Market: Year-over-year growth 2024-2029 (%)

    5 Historic Market Size

    • 5.1 Global Arcade Gaming Market 2019 - 2023
      • Historic Market Size - Data Table on Global Arcade Gaming Market 2019 - 2023 ($ million)
    • 5.2 End-user segment analysis 2019 - 2023
      • Historic Market Size - End-user Segment 2019 - 2023 ($ million)
    • 5.3 Genre segment analysis 2019 - 2023
      • Historic Market Size - Genre Segment 2019 - 2023 ($ million)
    • 5.4 Type segment analysis 2019 - 2023
      • Historic Market Size - Type Segment 2019 - 2023 ($ million)
    • 5.5 Geography segment analysis 2019 - 2023
      • Historic Market Size - Geography Segment 2019 - 2023 ($ million)
    • 5.6 Country segment analysis 2019 - 2023
      • Historic Market Size - Country Segment 2019 - 2023 ($ million)

    6 Qualitative Analysis

    • 6.1 The AI impact on Global Arcade Gaming Market

      7 Five Forces Analysis

      • 7.1 Five forces summary
        • Five forces analysis - Comparison between 2024 and 2029
      • 7.2 Bargaining power of buyers
        • Bargaining power of buyers - Impact of key factors 2024 and 2029
      • 7.3 Bargaining power of suppliers
        • Bargaining power of suppliers - Impact of key factors in 2024 and 2029
      • 7.4 Threat of new entrants
        • Threat of new entrants - Impact of key factors in 2024 and 2029
      • 7.5 Threat of substitutes
        • Threat of substitutes - Impact of key factors in 2024 and 2029
      • 7.6 Threat of rivalry
        • Threat of rivalry - Impact of key factors in 2024 and 2029
      • 7.7 Market condition
        • Chart on Market condition - Five forces 2024 and 2029

      8 Market Segmentation by End-user

      • 8.1 Market segments
        • Chart on End-user - Market share (2024-2029) (%)
        • Data Table on End-user - Market share (2024-2029) (%)
      • 8.2 Comparison by End-user
        • Chart on Comparison by End-user
        • Data Table on Comparison by End-user
      • 8.3 Gaming hubs - Market size and forecast (2024-2029)
        • Chart on Gaming hubs - Market size and forecast (2024-2029) ($ million)
        • Data Table on Gaming hubs - Market size and forecast (2024-2029) ($ million)
        • Chart on Gaming hubs - Year-over-year growth (2024-2029) (%)
        • Data Table on Gaming hubs - Year-over-year growth (2024-2029) (%)
      • 8.4 Semi-commercial - Market size and forecast (2024-2029)
        • Chart on Semi-commercial - Market size and forecast (2024-2029) ($ million)
        • Data Table on Semi-commercial - Market size and forecast (2024-2029) ($ million)
        • Chart on Semi-commercial - Year-over-year growth (2024-2029) (%)
        • Data Table on Semi-commercial - Year-over-year growth (2024-2029) (%)
      • 8.5 Residential - Market size and forecast (2024-2029)
        • Chart on Residential - Market size and forecast (2024-2029) ($ million)
        • Data Table on Residential - Market size and forecast (2024-2029) ($ million)
        • Chart on Residential - Year-over-year growth (2024-2029) (%)
        • Data Table on Residential - Year-over-year growth (2024-2029) (%)
      • 8.6 Market opportunity by End-user
        • Market opportunity by End-user ($ million)
        • Data Table on Market opportunity by End-user ($ million)

      9 Market Segmentation by Genre

      • 9.1 Market segments
        • Chart on Genre - Market share (2024-2029) (%)
        • Data Table on Genre - Market share (2024-2029) (%)
      • 9.2 Comparison by Genre
        • Chart on Comparison by Genre
        • Data Table on Comparison by Genre
      • 9.3 Racing - Market size and forecast (2024-2029)
        • Chart on Racing - Market size and forecast (2024-2029) ($ million)
        • Data Table on Racing - Market size and forecast (2024-2029) ($ million)
        • Chart on Racing - Year-over-year growth (2024-2029) (%)
        • Data Table on Racing - Year-over-year growth (2024-2029) (%)
      • 9.4 Shooting - Market size and forecast (2024-2029)
        • Chart on Shooting - Market size and forecast (2024-2029) ($ million)
        • Data Table on Shooting - Market size and forecast (2024-2029) ($ million)
        • Chart on Shooting - Year-over-year growth (2024-2029) (%)
        • Data Table on Shooting - Year-over-year growth (2024-2029) (%)
      • 9.5 Sports - Market size and forecast (2024-2029)
        • Chart on Sports - Market size and forecast (2024-2029) ($ million)
        • Data Table on Sports - Market size and forecast (2024-2029) ($ million)
        • Chart on Sports - Year-over-year growth (2024-2029) (%)
        • Data Table on Sports - Year-over-year growth (2024-2029) (%)
      • 9.6 Action - Market size and forecast (2024-2029)
        • Chart on Action - Market size and forecast (2024-2029) ($ million)
        • Data Table on Action - Market size and forecast (2024-2029) ($ million)
        • Chart on Action - Year-over-year growth (2024-2029) (%)
        • Data Table on Action - Year-over-year growth (2024-2029) (%)
      • 9.7 Market opportunity by Genre
        • Market opportunity by Genre ($ million)
        • Data Table on Market opportunity by Genre ($ million)

      10 Market Segmentation by Type

      • 10.1 Market segments
        • Chart on Type - Market share (2024-2029) (%)
        • Data Table on Type - Market share (2024-2029) (%)
      • 10.2 Comparison by Type
        • Chart on Comparison by Type
        • Data Table on Comparison by Type
      • 10.3 Video games - Market size and forecast (2024-2029)
        • Chart on Video games - Market size and forecast (2024-2029) ($ million)
        • Data Table on Video games - Market size and forecast (2024-2029) ($ million)
        • Chart on Video games - Year-over-year growth (2024-2029) (%)
        • Data Table on Video games - Year-over-year growth (2024-2029) (%)
      • 10.4 Simulation games - Market size and forecast (2024-2029)
        • Chart on Simulation games - Market size and forecast (2024-2029) ($ million)
        • Data Table on Simulation games - Market size and forecast (2024-2029) ($ million)
        • Chart on Simulation games - Year-over-year growth (2024-2029) (%)
        • Data Table on Simulation games - Year-over-year growth (2024-2029) (%)
      • 10.5 Mechanical games - Market size and forecast (2024-2029)
        • Chart on Mechanical games - Market size and forecast (2024-2029) ($ million)
        • Data Table on Mechanical games - Market size and forecast (2024-2029) ($ million)
        • Chart on Mechanical games - Year-over-year growth (2024-2029) (%)
        • Data Table on Mechanical games - Year-over-year growth (2024-2029) (%)
      • 10.6 Market opportunity by Type
        • Market opportunity by Type ($ million)
        • Data Table on Market opportunity by Type ($ million)

      11 Market Segmentation by Power

      • 11.1 Market segments
        • Chart on Power - Market share (2024-2029) (%)
        • Data Table on Power - Market share (2024-2029) (%)
      • 11.2 Comparison by Power
        • Chart on Comparison by Power
        • Data Table on Comparison by Power
      • 11.3 Electric - Market size and forecast (2024-2029)
        • Chart on Electric - Market size and forecast (2024-2029) ($ million)
        • Data Table on Electric - Market size and forecast (2024-2029) ($ million)
        • Chart on Electric - Year-over-year growth (2024-2029) (%)
        • Data Table on Electric - Year-over-year growth (2024-2029) (%)
      • 11.4 Battery - Market size and forecast (2024-2029)
        • Chart on Battery - Market size and forecast (2024-2029) ($ million)
        • Data Table on Battery - Market size and forecast (2024-2029) ($ million)
        • Chart on Battery - Year-over-year growth (2024-2029) (%)
        • Data Table on Battery - Year-over-year growth (2024-2029) (%)
      • 11.5 Hybrid - Market size and forecast (2024-2029)
        • Chart on Hybrid - Market size and forecast (2024-2029) ($ million)
        • Data Table on Hybrid - Market size and forecast (2024-2029) ($ million)
        • Chart on Hybrid - Year-over-year growth (2024-2029) (%)
        • Data Table on Hybrid - Year-over-year growth (2024-2029) (%)
      • 11.6 Market opportunity by Power
        • Market opportunity by Power ($ million)
        • Data Table on Market opportunity by Power ($ million)

      12 Market Segmentation by Control Mechanism

      • 12.1 Market segments
        • Chart on Control Mechanism - Market share (2024-2029) (%)
        • Data Table on Control Mechanism - Market share (2024-2029) (%)
      • 12.2 Comparison by Control Mechanism
        • Chart on Comparison by Control Mechanism
        • Data Table on Comparison by Control Mechanism
      • 12.3 Joystick - Market size and forecast (2024-2029)
        • Chart on Joystick - Market size and forecast (2024-2029) ($ million)
        • Data Table on Joystick - Market size and forecast (2024-2029) ($ million)
        • Chart on Joystick - Year-over-year growth (2024-2029) (%)
        • Data Table on Joystick - Year-over-year growth (2024-2029) (%)
      • 12.4 Buttons - Market size and forecast (2024-2029)
        • Chart on Buttons - Market size and forecast (2024-2029) ($ million)
        • Data Table on Buttons - Market size and forecast (2024-2029) ($ million)
        • Chart on Buttons - Year-over-year growth (2024-2029) (%)
        • Data Table on Buttons - Year-over-year growth (2024-2029) (%)
      • 12.5 Trackball - Market size and forecast (2024-2029)
        • Chart on Trackball - Market size and forecast (2024-2029) ($ million)
        • Data Table on Trackball - Market size and forecast (2024-2029) ($ million)
        • Chart on Trackball - Year-over-year growth (2024-2029) (%)
        • Data Table on Trackball - Year-over-year growth (2024-2029) (%)
      • 12.6 Motion Controls - Market size and forecast (2024-2029)
        • Chart on Motion Controls - Market size and forecast (2024-2029) ($ million)
        • Data Table on Motion Controls - Market size and forecast (2024-2029) ($ million)
        • Chart on Motion Controls - Year-over-year growth (2024-2029) (%)
        • Data Table on Motion Controls - Year-over-year growth (2024-2029) (%)
      • 12.7 Market opportunity by Control Mechanism
        • Market opportunity by Control Mechanism ($ million)
        • Data Table on Market opportunity by Control Mechanism ($ million)

      13 Customer Landscape

      • 13.1 Customer landscape overview
        • Analysis of price sensitivity, lifecycle, customer purchase basket, adoption rates, and purchase criteria

      14 Geographic Landscape

      • 14.1 Geographic segmentation
        • Chart on Market share by geography 2024-2029 (%)
        • Data Table on Market share by geography 2024-2029 (%)
      • 14.2 Geographic comparison
        • Chart on Geographic comparison
        • Data Table on Geographic comparison
      • 14.3 APAC - Market size and forecast 2024-2029
        • Chart on APAC - Market size and forecast 2024-2029 ($ million)
        • Data Table on APAC - Market size and forecast 2024-2029 ($ million)
        • Chart on APAC - Year-over-year growth 2024-2029 (%)
        • Data Table on APAC - Year-over-year growth 2024-2029 (%)
      • 14.4 North America - Market size and forecast 2024-2029
        • Chart on North America - Market size and forecast 2024-2029 ($ million)
        • Data Table on North America - Market size and forecast 2024-2029 ($ million)
        • Chart on North America - Year-over-year growth 2024-2029 (%)
        • Data Table on North America - Year-over-year growth 2024-2029 (%)
      • 14.5 Europe - Market size and forecast 2024-2029
        • Chart on Europe - Market size and forecast 2024-2029 ($ million)
        • Data Table on Europe - Market size and forecast 2024-2029 ($ million)
        • Chart on Europe - Year-over-year growth 2024-2029 (%)
        • Data Table on Europe - Year-over-year growth 2024-2029 (%)
      • 14.6 Middle East and Africa - Market size and forecast 2024-2029
        • Chart on Middle East and Africa - Market size and forecast 2024-2029 ($ million)
        • Data Table on Middle East and Africa - Market size and forecast 2024-2029 ($ million)
        • Chart on Middle East and Africa - Year-over-year growth 2024-2029 (%)
        • Data Table on Middle East and Africa - Year-over-year growth 2024-2029 (%)
      • 14.7 South America - Market size and forecast 2024-2029
        • Chart on South America - Market size and forecast 2024-2029 ($ million)
        • Data Table on South America - Market size and forecast 2024-2029 ($ million)
        • Chart on South America - Year-over-year growth 2024-2029 (%)
        • Data Table on South America - Year-over-year growth 2024-2029 (%)
      • 14.8 China - Market size and forecast 2024-2029
        • Chart on China - Market size and forecast 2024-2029 ($ million)
        • Data Table on China - Market size and forecast 2024-2029 ($ million)
        • Chart on China - Year-over-year growth 2024-2029 (%)
        • Data Table on China - Year-over-year growth 2024-2029 (%)
      • 14.9 US - Market size and forecast 2024-2029
        • Chart on US - Market size and forecast 2024-2029 ($ million)
        • Data Table on US - Market size and forecast 2024-2029 ($ million)
        • Chart on US - Year-over-year growth 2024-2029 (%)
        • Data Table on US - Year-over-year growth 2024-2029 (%)
      • 14.10 Japan - Market size and forecast 2024-2029
        • Chart on Japan - Market size and forecast 2024-2029 ($ million)
        • Data Table on Japan - Market size and forecast 2024-2029 ($ million)
        • Chart on Japan - Year-over-year growth 2024-2029 (%)
        • Data Table on Japan - Year-over-year growth 2024-2029 (%)
      • 14.11 Germany - Market size and forecast 2024-2029
        • Chart on Germany - Market size and forecast 2024-2029 ($ million)
        • Data Table on Germany - Market size and forecast 2024-2029 ($ million)
        • Chart on Germany - Year-over-year growth 2024-2029 (%)
        • Data Table on Germany - Year-over-year growth 2024-2029 (%)
      • 14.12 India - Market size and forecast 2024-2029
        • Chart on India - Market size and forecast 2024-2029 ($ million)
        • Data Table on India - Market size and forecast 2024-2029 ($ million)
        • Chart on India - Year-over-year growth 2024-2029 (%)
        • Data Table on India - Year-over-year growth 2024-2029 (%)
      • 14.13 Canada - Market size and forecast 2024-2029
        • Chart on Canada - Market size and forecast 2024-2029 ($ million)
        • Data Table on Canada - Market size and forecast 2024-2029 ($ million)
        • Chart on Canada - Year-over-year growth 2024-2029 (%)
        • Data Table on Canada - Year-over-year growth 2024-2029 (%)
      • 14.14 UK - Market size and forecast 2024-2029
        • Chart on UK - Market size and forecast 2024-2029 ($ million)
        • Data Table on UK - Market size and forecast 2024-2029 ($ million)
        • Chart on UK - Year-over-year growth 2024-2029 (%)
        • Data Table on UK - Year-over-year growth 2024-2029 (%)
      • 14.15 France - Market size and forecast 2024-2029
        • Chart on France - Market size and forecast 2024-2029 ($ million)
        • Data Table on France - Market size and forecast 2024-2029 ($ million)
        • Chart on France - Year-over-year growth 2024-2029 (%)
        • Data Table on France - Year-over-year growth 2024-2029 (%)
      • 14.16 Saudi Arabia - Market size and forecast 2024-2029
        • Chart on Saudi Arabia - Market size and forecast 2024-2029 ($ million)
        • Data Table on Saudi Arabia - Market size and forecast 2024-2029 ($ million)
        • Chart on Saudi Arabia - Year-over-year growth 2024-2029 (%)
        • Data Table on Saudi Arabia - Year-over-year growth 2024-2029 (%)
      • 14.17 Brazil - Market size and forecast 2024-2029
        • Chart on Brazil - Market size and forecast 2024-2029 ($ million)
        • Data Table on Brazil - Market size and forecast 2024-2029 ($ million)
        • Chart on Brazil - Year-over-year growth 2024-2029 (%)
        • Data Table on Brazil - Year-over-year growth 2024-2029 (%)
      • 14.18 Market opportunity by geography
        • Market opportunity by geography ($ million)
        • Data Tables on Market opportunity by geography ($ million)
      • 14.19 Rest of World (ROW) - Market size and forecast (2024-2029)
        • Chart on Rest of World (ROW) - Market size and forecast (2024-2029) ($ million)
        • Data Table on Rest of World (ROW) - Market size and forecast (2024-2029) ($ million)
        • Chart on Rest of World (ROW) - Year-over-year growth (2024-2029) (%)
        • Data Table on Rest of World (ROW) - Year-over-year growth (2024-2029) (%)

      15 Drivers, Challenges, and Opportunity/Restraints

      • 15.1 Market drivers
        • 15.2 Market challenges
          • 15.3 Impact of drivers and challenges
            • Impact of drivers and challenges in 2024 and 2029
          • 15.4 Market opportunities/restraints

            16 Competitive Landscape

            • 16.1 Overview
              • 16.2 Competitive Landscape
                • Overview on criticality of inputs and factors of differentiation
              • 16.3 Landscape disruption
                • Overview on factors of disruption
              • 16.4 Industry risks
                • Impact of key risks on business

              17 Competitive Analysis

              • 17.1 Companies profiled
                • Companies covered
              • 17.2 Market positioning of companies
                • Matrix on companies position and classification
              • 17.3 Sega Corporation (Japan)
                • Sega Corporation (Japan) - Overview
                • Sega Corporation (Japan) - Product / Service
                • Sega Corporation (Japan) - Key offerings
              • 17.4 Bandai Namco Entertainment (Japan)
                • Bandai Namco Entertainment (Japan) - Overview
                • Bandai Namco Entertainment (Japan) - Product / Service
                • Bandai Namco Entertainment (Japan) - Key offerings
              • 17.5 Konami Holdings Corporation (Japan)
                • Konami Holdings Corporation (Japan) - Overview
                • Konami Holdings Corporation (Japan) - Product / Service
                • Konami Holdings Corporation (Japan) - Key offerings
              • 17.6 Raw Thrills, Inc. (United States)
                • Raw Thrills, Inc. (United States) - Overview
                • Raw Thrills, Inc. (United States) - Product / Service
                • Raw Thrills, Inc. (United States) - Key offerings
              • 17.7 Atari SA (France)
                • Atari SA (France) - Overview
                • Atari SA (France) - Product / Service
                • Atari SA (France) - Key offerings
              • 17.8 Capcom Co., Ltd. (Japan)
                • Capcom Co., Ltd. (Japan) - Overview
                • Capcom Co., Ltd. (Japan) - Product / Service
                • Capcom Co., Ltd. (Japan) - Key offerings
              • 17.9 Taito Corporation (Japan)
                • Taito Corporation (Japan) - Overview
                • Taito Corporation (Japan) - Product / Service
                • Taito Corporation (Japan) - Key offerings
              • 17.10 Stern Pinball, Inc. (United States)
                • Stern Pinball, Inc. (United States) - Overview
                • Stern Pinball, Inc. (United States) - Product / Service
                • Stern Pinball, Inc. (United States) - Key offerings
              • 17.11 Incredible Technologies, Inc. (United States)
                • Incredible Technologies, Inc. (United States) - Overview
                • Incredible Technologies, Inc. (United States) - Product / Service
                • Incredible Technologies, Inc. (United States) - Key offerings
              • 17.12 Adrenaline Amusements (Canada)
                • Adrenaline Amusements (Canada) - Overview
                • Adrenaline Amusements (Canada) - Product / Service
                • Adrenaline Amusements (Canada) - Key offerings
              • 17.13 Bay Tek Entertainment (United States)
                • Bay Tek Entertainment (United States) - Overview
                • Bay Tek Entertainment (United States) - Product / Service
                • Bay Tek Entertainment (United States) - Key offerings
              • 17.14 Elaut Group (Belgium)
                • Elaut Group (Belgium) - Overview
                • Elaut Group (Belgium) - Product / Service
                • Elaut Group (Belgium) - Key offerings
              • 17.15 ICE Games (United States)
                • ICE Games (United States) - Overview
                • ICE Games (United States) - Product / Service
                • ICE Games (United States) - Key offerings
              • 17.16 LAI Games (Australia)
                • LAI Games (Australia) - Overview
                • LAI Games (Australia) - Product / Service
                • LAI Games (Australia) - Key offerings
              • 17.17 Andamiro Co., Ltd. (South Korea)
                • Andamiro Co., Ltd. (South Korea) - Overview
                • Andamiro Co., Ltd. (South Korea) - Product / Service
                • Andamiro Co., Ltd. (South Korea) - Key offerings
              • 17.18 Global VR (United States)
                • Global VR (United States) - Overview
                • Global VR (United States) - Product / Service
                • Global VR (United States) - Key offerings
              • 17.19 Betson Enterprises (United States)
                • Betson Enterprises (United States) - Overview
                • Betson Enterprises (United States) - Product / Service
                • Betson Enterprises (United States) - Key offerings
              • 17.20 Skee-Ball Inc. (United States)
                • Skee-Ball Inc. (United States) - Overview
                • Skee-Ball Inc. (United States) - Product / Service
                • Skee-Ball Inc. (United States) - Key offerings
              • 17.21 PrimeTime Amusements (United States)
                • PrimeTime Amusements (United States) - Overview
                • PrimeTime Amusements (United States) - Product / Service
                • PrimeTime Amusements (United States) - Key offerings
              • 17.22 Namco USA Inc. (United States)
                • Namco USA Inc. (United States) - Overview
                • Namco USA Inc. (United States) - Product / Service
                • Namco USA Inc. (United States) - Key offerings
              • 17.23 Bandai Namco Holdings Inc.
                • Bandai Namco Holdings Inc. - Overview
                • Bandai Namco Holdings Inc. - Product / Service
                • Bandai Namco Holdings Inc. - Key offerings
              • 17.24 Bay Tek Entertainment Inc.
                • Bay Tek Entertainment Inc. - Overview
                • Bay Tek Entertainment Inc. - Product / Service
                • Bay Tek Entertainment Inc. - Key offerings
              • 17.25 Bowlero Corp.
                • Bowlero Corp. - Overview
                • Bowlero Corp. - Product / Service
                • Bowlero Corp. - Key offerings
              • 17.26 Capcom Co. Ltd.
                • Capcom Co. Ltd. - Overview
                • Capcom Co. Ltd. - Product / Service
                • Capcom Co. Ltd. - Key offerings
              • 17.27 Chicago Gaming Co.
                • Chicago Gaming Co. - Overview
                • Chicago Gaming Co. - Product / Service
                • Chicago Gaming Co. - Key offerings
              • 17.28 CXC Simulations
                • CXC Simulations - Overview
                • CXC Simulations - Product / Service
                • CXC Simulations - Key offerings
              • 17.29 D BOX Technologies Inc.
                • D BOX Technologies Inc. - Overview
                • D BOX Technologies Inc. - Product / Service
                • D BOX Technologies Inc. - Key offerings
              • 17.30 Eleetus LLC
                • Eleetus LLC - Overview
                • Eleetus LLC - Product / Service
                • Eleetus LLC - Key offerings
              • 17.31 Helix Leisure USA Inc.
                • Helix Leisure USA Inc. - Overview
                • Helix Leisure USA Inc. - Product / Service
                • Helix Leisure USA Inc. - Key offerings
              • 17.32 Incredible Technologies Inc.
                • Incredible Technologies Inc. - Overview
                • Incredible Technologies Inc. - Product / Service
                • Incredible Technologies Inc. - Key offerings
              • 17.33 Innovative Concepts in Entertainment Inc.
                • Innovative Concepts in Entertainment Inc. - Overview
                • Innovative Concepts in Entertainment Inc. - Product / Service
                • Innovative Concepts in Entertainment Inc. - Key offerings
              • 17.34 International Games System Co. Ltd.
                • International Games System Co. Ltd. - Overview
                • International Games System Co. Ltd. - Product / Service
                • International Games System Co. Ltd. - Key offerings
              • 17.35 Neofuns Amusement Equipment Co. Ltd.
                • Neofuns Amusement Equipment Co. Ltd. - Overview
                • Neofuns Amusement Equipment Co. Ltd. - Product / Service
                • Neofuns Amusement Equipment Co. Ltd. - Key offerings
              • 17.36 Nintendo Co., Ltd.
                • Nintendo Co., Ltd. - Overview
                • Nintendo Co., Ltd. - Product / Service
                • Nintendo Co., Ltd. - Key offerings
              • 17.37 PrimeTime Amusements
                • PrimeTime Amusements - Overview
                • PrimeTime Amusements - Product / Service
                • PrimeTime Amusements - Key offerings
              • 17.38 Sega Sammy Holdings Inc.
                • Sega Sammy Holdings Inc. - Overview
                • Sega Sammy Holdings Inc. - Product / Service
                • Sega Sammy Holdings Inc. - Key offerings
              • 17.39 Square Enix Holdings Co. Ltd.
                • Square Enix Holdings Co. Ltd. - Overview
                • Square Enix Holdings Co. Ltd. - Product / Service
                • Square Enix Holdings Co. Ltd. - Key offerings
              • 17.40 UNIS Technology Ltd.
                • UNIS Technology Ltd. - Overview
                • UNIS Technology Ltd. - Product / Service
                • UNIS Technology Ltd. - Key offerings
              • 17.41 Valley Dynamo Inc.
                • Valley Dynamo Inc. - Overview
                • Valley Dynamo Inc. - Product / Service
                • Valley Dynamo Inc. - Key offerings
              • 17.42 Vesaro Ltd.
                • Vesaro Ltd. - Overview
                • Vesaro Ltd. - Product / Service
                • Vesaro Ltd. - Key offerings

              18 Appendix

              • 18.1 Scope of the report
                • 18.2 Inclusions and exclusions checklist
                  • Inclusions checklist
                  • Exclusions checklist
                • 18.3 Currency conversion rates for US$
                  • Currency conversion rates for US$
                • 18.4 Research methodology
                  • Research methodology
                • 18.5 Data procurement
                  • Information sources
                • 18.6 Data validation
                  • Data validation
                • 18.7 Validation techniques employed for market sizing
                  • Validation techniques employed for market sizing
                • 18.8 Data synthesis
                  • Data synthesis
                • 18.9 360 degree market analysis
                  • 360 degree market analysis
                • 18.10 List of abbreviations
                  • List of abbreviations

                Research Methodology

                Technavio presents a detailed picture of the market by way of study, synthesis, and summation of data from multiple sources. The analysts have presented the various facets of the market with a particular focus on identifying the key industry influencers. The data thus presented is comprehensive, reliable, and the result of extensive research, both primary and secondary.

                INFORMATION SOURCES

                Primary sources

                • Manufacturers and suppliers
                • Channel partners
                • Industry experts
                • Strategic decision makers

                Secondary sources

                • Industry journals and periodicals
                • Government data
                • Financial reports of key industry players
                • Historical data
                • Press releases

                DATA ANALYSIS

                Data Synthesis

                • Collation of data
                • Estimation of key figures
                • Analysis of derived insights

                Data Validation

                • Triangulation with data models
                • Reference against proprietary databases
                • Corroboration with industry experts

                REPORT WRITING

                Qualitative

                • Market drivers
                • Market challenges
                • Market trends
                • Five forces analysis

                Quantitative

                • Market size and forecast
                • Market segmentation
                • Geographical insights
                • Competitive landscape

                Interested in this report?

                Get your sample now to see our research methodology and insights!

                Download Now

                Frequently Asked Questions

                Arcade Gaming market growth will increase by $ 1999.9 mn during 2025-2029.

                The Arcade Gaming market is expected to grow at a CAGR of 1.9% during 2025-2029.

                Arcade Gaming market is segmented by End-user( Gaming hubs, Semi-commercial, Residential) Genre( Racing, Shooting, Sports, Action) Type( Video games, Simulation games, Mechanical games, South America, MEA)

                Sega Corporation (Japan), Bandai Namco Entertainment (Japan), Konami Holdings Corporation (Japan), Raw Thrills, Inc. (United States), Atari SA (France), Capcom Co., Ltd. (Japan), Taito Corporation (Japan), Stern Pinball, Inc. (United States), Incredible Technologies, Inc. (United States), Adrenaline Amusements (Canada), Bay Tek Entertainment (United States), Elaut Group (Belgium), ICE Games (United States), LAI Games (Australia), Andamiro Co., Ltd. (South Korea), Global VR (United States), Betson Enterprises (United States), Skee-Ball Inc. (United States), PrimeTime Amusements (United States), Namco USA Inc. (United States) are a few of the key vendors in the Arcade Gaming market.

                APAC will register the highest growth rate of 51% among the other regions. Therefore, the Arcade Gaming market in APAC is expected to garner significant business opportunities for the vendors during the forecast period.

                China, US, Japan, Germany, India, Canada, UK, France, Saudi Arabia, Brazil

                • Increasing physical activities in arcade gamingThe global arcade gaming market is one of the fastest adopters of technological innovations. These innovations have changed gaming from 2D gameplay on a screen is the driving factor this market.
                • which only requires gamers to use their hands is the driving factor this market.
                • to VR is the driving factor this market.
                • in which gamers can experience the virtual world of gaming. Various innovations to make the gaming experience interactive and real-life include head-mounted displays is the driving factor this market.
                • motion controllers is the driving factor this market.
                • tracking devices is the driving factor this market.
                • and gaming gloves. However is the driving factor this market.
                • one aspect that is yet to be covered in gaming is to involve the physical motions of gamers. To enhance the VR experience is the driving factor this market.
                • the gamer would wish to stand up and move around naturally instead of playing games on a screen using gaming peripherals. For instance is the driving factor this market.
                • in March 2022 is the driving factor this market.
                • the Amusement Expo International (AEI) convention in Las Vegas introduced a VR laser tech arcade game with one platform where players can move around and play. By including the natural physical actions of the gamer is the driving factor this market.
                • VR can be taken to the next level. Thus is the driving factor this market.
                • increasing physical activities in arcade gaming will make it more attractive for players is the driving factor this market.
                • which is the driving factor this market.
                • in turn is the driving factor this market.
                • will boost the growth of the global arcade gaming market during the forecast period. is the driving factor this market.

                The Arcade Gaming market vendors should focus on grabbing business opportunities from the Gaming hubs segment as it accounted for the largest market share in the base year.