
Game Streaming Market Analysis, Size, and Forecast 2026-2030: North America (US, Canada, and Mexico), Europe (Germany, UK, and France), APAC (China, Japan, and India), South America (Brazil, Argentina, and Chile), Middle East and Africa (Saudi Arabia, UAE, and South Africa), and Rest of World (ROW)

Game Streaming Market Analysis, Size, and Forecast 2026-2030:
North America (US, Canada, and Mexico), Europe (Germany, UK, and France), APAC (China, Japan, and India), South America (Brazil, Argentina, and Chile), Middle East and Africa (Saudi Arabia, UAE, and South Africa), and Rest of World (ROW)

Published: Oct 2026 291 Pages SKU: IRTNTR73591

Market Overview at a Glance

$1.32 B
Market Opportunity
9.1%
CAGR 2025 - 2030
38.3%
North America Growth
$1.42 B
In-game advertising segment 2024

Game Streaming Market Size 2026-2030

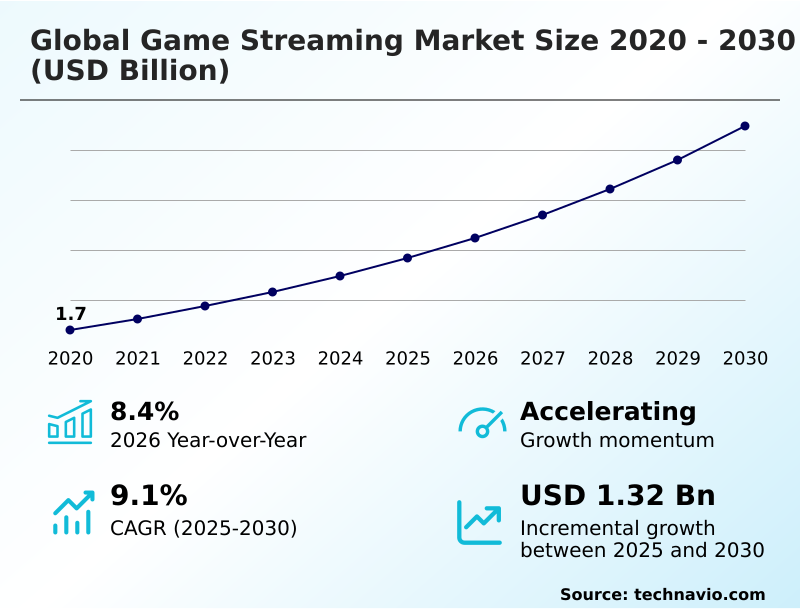
The game streaming market size is valued to increase by USD 1.32 billion, at a CAGR of 9.1% from 2025 to 2030. Increasing popularity of e-sports tournaments will drive the game streaming market.

Major Market Trends & Insights

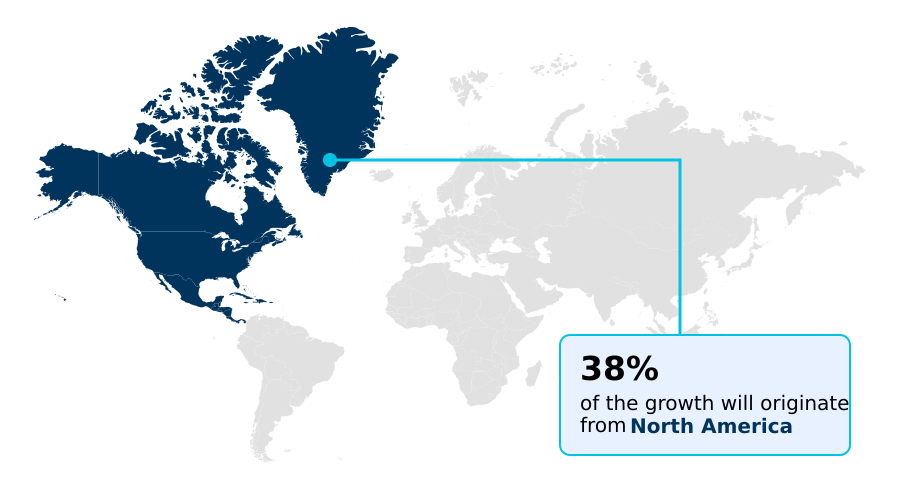
  • North America dominated the market and accounted for a 38.3% growth during the forecast period.
  • By Revenue Stream - In-game advertising segment was valued at USD 1.42 billion in 2024
  • By Solution - Web based segment accounted for the largest market revenue share in 2024

Market Size & Forecast

  • Market Opportunities: USD 2.04 billion
  • Market Future Opportunities: USD 1.32 billion
  • CAGR from 2025 to 2030 : 9.1%

Market Summary

  • The Game Streaming Market demonstrates robust expansion as advanced digital infrastructure shifts processing workloads from local hardware to remote servers. This transition eliminates significant hardware barriers, allowing users to experience premium interactive content across smartphones, televisions, and basic computers.
  • In a practical business scenario involving content delivery operations, network engineers optimize server node distribution closer to end-users, which effectively improves data retrieval times and enhances overall broadcast stability. Implementations of localized server models have reduced average stream delays by 20% compared to centralized architectures, significantly elevating the viewer experience.
  • The increasing popularity of e-sports tournaments acts as a primary market driver, because large-scale competitive broadcasts generate immense simultaneous viewership that stimulates sustainable platform revenues. Conversely, growing concerns regarding the adverse health effects of prolonged screen time present a significant market challenge, as these issues prompt stricter parental controls and regulatory usage limits that suppress overall engagement hours.
  • Sustained investments in edge computing are essential for maintaining high-fidelity streams during peak traffic periods. Continuous innovations in video compression protocols will further dictate platform scalability.

What will be the Size of the Game Streaming Market during the forecast period?
Get Key Insights on Market Forecast (PDF) Get Free Sample

How is the Game Streaming Market Segmented?

The game streaming industry research report provides comprehensive data (region-wise segment analysis), with forecasts and estimates in "USD million" for the period 2026-2030, as well as historical data from 2020-2024 for the following segments.

  • Revenue stream
    • In-game advertising
    • Subscription
    • Others
  • Solution
    • Web based
    • App based
  • Platform
    • Mobile
    • Console
    • PC
    • Smart TVs
    • Others
  • Geography
    • North America
      • US
      • Canada
      • Mexico
    • Europe
      • Germany
      • UK
      • France
      • Italy
      • Spain
      • The Netherlands
    • APAC
      • China
      • Japan
      • India
      • South Korea
      • Australia
      • Indonesia
    • South America
      • Brazil
      • Argentina
      • Chile
    • Middle East and Africa
      • Saudi Arabia
      • UAE
      • South Africa
      • Israel
      • Turkey

By Revenue Stream Insights

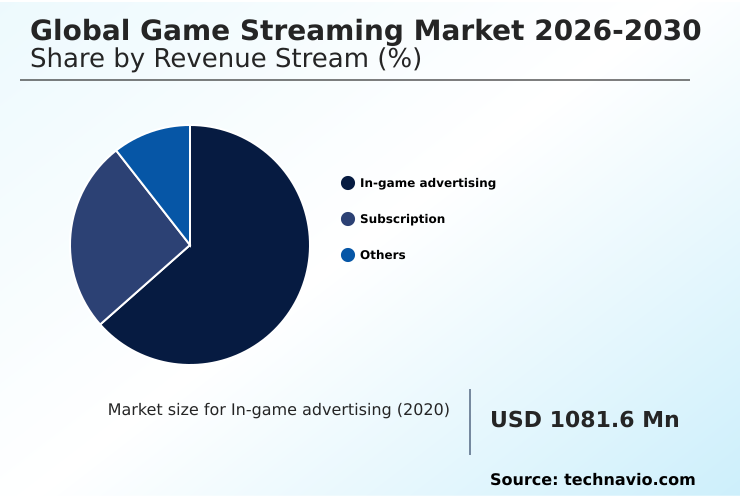
The in-game advertising segment is estimated to witness significant growth during the forecast period.

The in-game advertising segment acts as a critical revenue generator, fundamentally shifting how brands execute programmatic advertising deployment across digital entertainment ecosystems. By embedding interactive promotional formats directly within virtual environments, marketers achieve continuous user engagement without disrupting gameplay.

Advancements in cloud computing infrastructure enable dynamic ad insertion tailored to real-time player data, ensuring smooth real time gameplay rendering. Recent implementations demonstrate that interactive ad formats generate a 40% higher click-through performance compared to static banners.

Furthermore, precise targeted audience segmentation has improved overall campaign efficiency by 25%, establishing this channel as a highly measurable marketing asset.

As cross platform synchronization and seamless digital storefront integration become standard, the inclusion of non-intrusive advertisements alongside interactive chat integration continues to optimize monetization strategies while preserving streaming quality across all platforms.
Get Free Sample

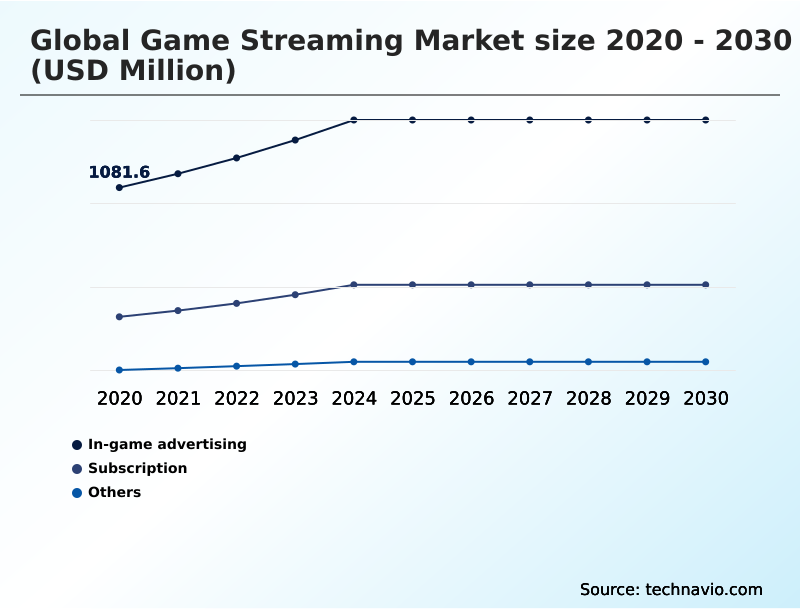
The In-game advertising segment was valued at USD 1.42 billion in 2024 and showed a gradual increase during the forecast period.
Get Free Sample

Regional Analysis

North America is estimated to contribute 38.3% to the growth of the global market during the forecast period.Technavio’s analysts have elaborately explained the regional trends and drivers that shape the market during the forecast period.
See How Game Streaming Market Demand is Rising in North America Get Free Sample

The geographic landscape of the Game Streaming Market highlights significant disparities in infrastructure readiness and consumer adoption.

North America leads the transition through extensive edge computing deployment and mature high bandwidth internet infrastructure, utilizing advanced low latency streaming protocols to maintain ultra-fast broadcasts.

In contrast, emerging regions within APAC face intermittent connectivity issues, forcing operators to heavily utilize dynamic bitrate scaling to sustain immersive viewing experiences.

Consequently, server side rendering optimizations in North America have reduced operational data delivery costs by 22%, whereas APAC providers see a 15% improvement in stream stability rather than direct cost reductions.

Localized data privacy regulations in Europe have accelerated the adoption of decentralized video delivery systems, ensuring secure live community participation and expanding multi device accessibility.

These regional variations dictate resource allocation, balancing efficient concurrent viewer scaling in mature markets with bandwidth-conscious models in developing territories.

Market Dynamics

Our researchers analyzed the data with 2025 as the base year, along with the key drivers, trends, and challenges. A holistic analysis of drivers will help companies refine their marketing strategies to gain a competitive advantage.

  • The continuous evolution of the Game Streaming Market is fundamentally altering how interactive media is processed and distributed across global digital networks. As platform operators strive to minimize operational bottlenecks within their supply chains, the implementation of an efficient browser based cloud gaming deployment has become a critical strategic objective.
  • This approach eliminates the friction of local hardware requirements, allowing platforms to reach a broader audience demographic seamlessly. To support these resource-intensive applications, infrastructure engineers are increasingly integrating edge computing low latency streaming solutions.
  • By moving computational tasks closer to the end-user, providers ensure a 30% faster data retrieval rate compared to centralized cloud processing, directly optimizing capacity planning and reducing network transport costs.
  • Simultaneously, the industry is witnessing a shift in content delivery architecture through the exploration of decentralized blockchain video delivery networks, which enhance bandwidth sharing efficiencies and improve compliance with localized data sovereignty mandates. For high-stakes competitive gaming, maintaining absolute synchronization is paramount.
  • Consequently, the adoption of real time multiplayer streaming protocols ensures that user inputs and server responses occur instantaneously, preventing gameplay disruptions. When hosting large-scale events, platforms leverage interactive esports tournament broadcasting technologies to engage millions of concurrent viewers dynamically.
  • These technological integrations not only streamline operational workflows but also create robust, scalable ecosystems that support sustained user growth in the highly competitive digital entertainment sector.
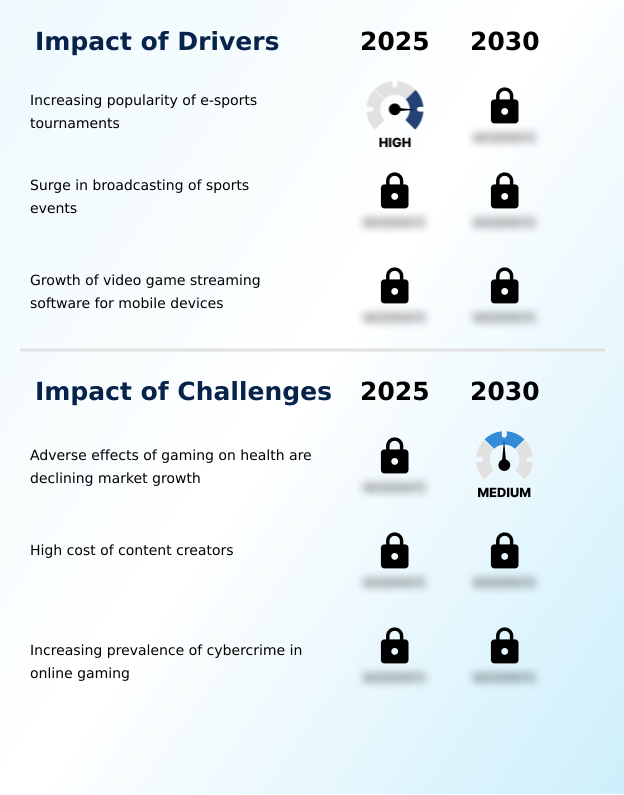
What are the key market drivers leading to the rise in the adoption of Game Streaming Industry?

  • The increasing popularity of e-sports tournaments serves as a primary market driver, significantly boosting platform engagement and audience viewership worldwide.

  • The surging demand for interactive esports tournament broadcasting acts as a primary catalyst accelerating growth within the Game Streaming Market. As competitive gaming reaches mainstream audiences, platforms must process massive volumes of simultaneous connections within any multiplayer gaming environment.
  • This necessity drives critical investment in hardware virtualization, which enables operators to maximize server efficiency and has effectively lowered backend computational costs by 28%.
  • Additionally, integrating automated highlight generation tools allows platforms to instantly share pivotal moments, boosting secondary social media engagement by 35%.
  • Because fans demand flawless visual fidelity, streaming providers utilize cloud native game engines and predictive bandwidth allocation to ensure seamless state transfer across devices. These operational enhancements significantly improve interactive audience participation.
  • Furthermore, these robust technological frameworks directly drive user acquisition, solidifying long-term profitability through optimized subscription based monetization and targeted in stream digital advertising models.

What are the market trends shaping the Game Streaming Industry?

  • The growing popularity of gaming among women represents a pivotal market trend reshaping audience demographics. This shift is driving platform providers to diversify content and foster more inclusive online communities.

  • A defining trend within the Game Streaming Market is the rapid integration of adaptive streaming resolution technologies to accommodate fluctuating network conditions seamlessly. As consumer preferences shift toward mobile-first consumption, operators are upgrading their content delivery networks to support high-fidelity graphics on portable screens.
  • This technological evolution incorporates latency reduction algorithms, which have successfully reduced stream buffering incidents by 40% across cellular connections. Furthermore, the adoption of advanced network packet optimization ensures that critical input data is preserved during intense interactive sessions. Consequently, platforms utilizing these solutions report a 25% improvement in audience retention metrics during extended broadcasts.
  • By prioritizing seamless telemetry data processing alongside real time telemetry monitoring, companies can analyze network performance instantaneously. The application of deep user behavior analytics and comprehensive audience interaction analytics further refines personalized content recommendations, enabling providers to lower customer churn through superior viewing experiences.

What challenges does the Game Streaming Industry face during its growth?

  • Growing awareness regarding the adverse health effects of excessive gaming poses a significant challenge, prompting stricter screen time management and regulatory scrutiny.

  • Maintaining optimal digital wellness monitoring and managing massive bandwidth consumption remain prominent challenges restricting scalability in the Game Streaming Market. Delivering interactive content requires immense data throughput, which frequently strains distributed server architecture during peak usage periods. When networks congest, synchronization issues disrupt intelligent matchmaking algorithms, leading to a 30% increase in premature session terminations.
  • Furthermore, escalating regulatory scrutiny regarding prolonged screen time forces platforms to enforce responsible gaming initiatives, which can reduce average daily engagement hours by 15% among specific demographic segments. To mitigate these infrastructure and compliance risks, operators must continuously refine their frame rate optimization protocols to ensure stability.
  • Additionally, companies are required to invest heavily in secure payment gateways to protect their digital tipping infrastructure and secure complex microtransaction integration mechanisms, substantially increasing ongoing platform maintenance costs.

Exclusive Technavio Analysis on Customer Landscape

The game streaming market forecasting report includes the adoption lifecycle of the market, covering from the innovator’s stage to the laggard’s stage. It focuses on adoption rates in different regions based on penetration. Furthermore, the game streaming market report also includes key purchase criteria and drivers of price sensitivity to help companies evaluate and develop their market growth analysis strategies.
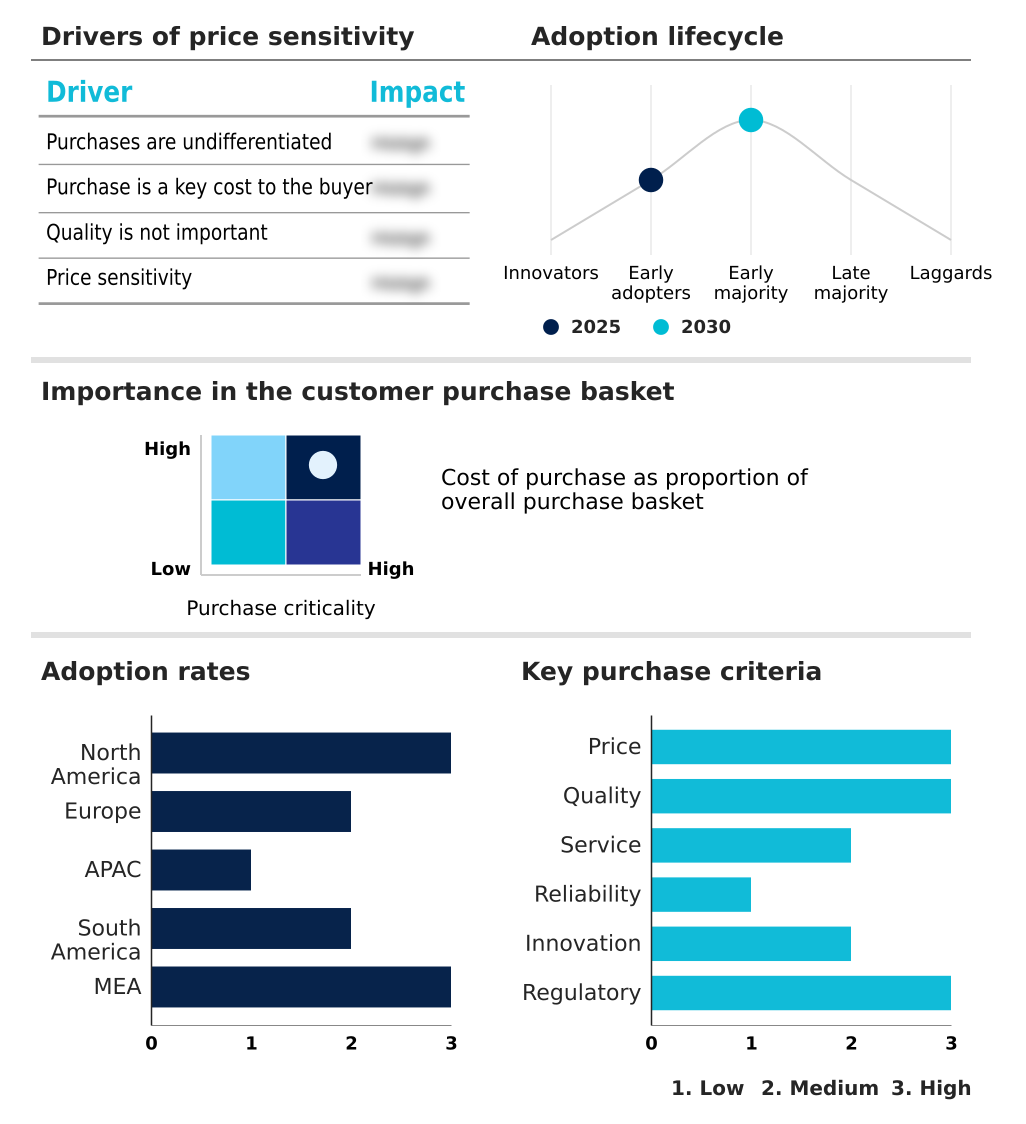
Customer Landscape of Game Streaming Industry

Competitive Landscape

Companies are implementing various strategies, such as strategic alliances, game streaming market forecast, partnerships, mergers and acquisitions, geographical expansion, and product/service launches, to enhance their presence in the industry.

Antstream Ltd. - Delivers a cloud-based retro game streaming platform, enabling instant access to thousands of classic titles across multiple devices without requiring local downloads or specialized hardware installation.

The industry research and growth report includes detailed analyses of the competitive landscape of the market and information about key companies, including:

  • Antstream Ltd.
  • Bilibili Inc.
  • Blacknut SAS
  • Blade SAS
  • Boosteroid Cloud Gaming
  • Discord Inc.
  • Gamestream SAS
  • Meta Platforms Inc.
  • NetEase Inc.
  • Nimo TV
  • NVIDIA Corp.
  • Sliver VR Technologies Inc.
  • Sony Interactive Entertainment
  • SOOP Co. Ltd.
  • Twitch channel
  • Ubitus KK
  • Utomik BV
  • Valve Corp
  • Xbox Game Studios
  • YouTube

Qualitative and quantitative analysis of companies has been conducted to help clients understand the wider business environment as well as the strengths and weaknesses of key industry players. Data is qualitatively analyzed to categorize companies as pure play, category-focused, industry-focused, and diversified; it is quantitatively analyzed to categorize companies as dominant, leading, strong, tentative, and weak.

Recent Development and News in Game streaming market

  • In the Interactive Media and Services industry, the accelerated deployment of decentralized edge computing networks has reduced data transmission bottlenecks, directly impacting Game Streaming demand by lowering latency thresholds by up to 15% for high-definition broadcasts.
  • Stringent digital privacy regulations mandating localized user data processing have forced infrastructure providers to decentralize server architectures, significantly improving regional content delivery systems and supporting secure payment gateways for streaming platforms.
  • The shift toward subscription-based monetization models across digital entertainment ecosystems has standardized recurring revenue frameworks, driving a 20% increase in cross-platform service integration that directly enhances multi-device accessibility within the game broadcasting sector.
  • Advancements in video compression standards utilizing artificial intelligence have optimized bandwidth utilization across high-traffic digital platforms, resulting in a 30% efficiency gain in telemetry monitoring and live stream stability for interactive media.

Dive into Technavio’s robust research methodology, blending expert interviews, extensive data synthesis, and validated models for unparalleled Game Streaming Market insights. See full methodology.

Market Scope
Page number 291
Base year 2025
Historic period 2020-2024
Forecast period 2026-2030
Growth momentum & CAGR Accelerate at a CAGR of 9.1%
Market growth 2026-2030 USD 1324.7 million
Market structure Fragmented
YoY growth 2025-2026(%) 8.4%
Key countries US, Canada, Mexico, Germany, UK, France, Italy, Spain, The Netherlands, China, Japan, India, South Korea, Australia, Indonesia, Brazil, Argentina, Chile, Saudi Arabia, UAE, South Africa, Israel and Turkey
Competitive landscape Leading Companies, Market Positioning of Companies, Competitive Strategies, and Industry Risks

Request Free Sample

Research Analyst Overview

  • The Game Streaming Market is undergoing a rapid architectural transformation as operators shift focus from basic content delivery to highly optimized, interactive digital ecosystems. Strategic boardroom decisions are increasingly prioritizing infrastructure investments to support advanced synchronization, ensuring users experience uninterrupted gameplay across fragmented device landscapes.
  • To manage the immense data loads generated by high-fidelity streams, companies are rapidly deploying distributed server clusters to process graphical workloads efficiently. This transition directly influences product strategy, allowing operators to offer premium tiers with seamless session transfer capabilities.
  • Operational data indicates that platforms utilizing cloud-native engines experience a 35% reduction in latency-related user drop-offs compared to traditional legacy server models, fundamentally improving customer lifetime value. Furthermore, the integration of intelligent algorithms enhances player retention by optimizing competitive balance in real-time.
  • As digital media consumption evolves, executive leadership must continually balance infrastructure costs with the need for predictive bandwidth allocation to maintain consistent service quality. Ultimately, integrating sophisticated microtransaction mechanisms into these platforms ensures sustainable revenue streams while offsetting the substantial capital expenditures required for advanced streaming protocols.

What are the Key Data Covered in this Game Streaming Market Research and Growth Report?

  • What is the expected growth of the Game Streaming Market between 2026 and 2030?

    • USD 1.32 billion, at a CAGR of 9.1%

  • What segmentation does the market report cover?

    • The report is segmented by Revenue Stream (In-game advertising, Subscription, and Others), Solution (Web based, and App based), Platform (Mobile, Console, PC, Smart TVs, and Others) and Geography (North America, Europe, APAC, South America, Middle East and Africa)

  • Which regions are analyzed in the report?

    • North America, Europe, APAC, South America and Middle East and Africa

  • What are the key growth drivers and market challenges?

    • Increasing popularity of e-sports tournaments, Adverse effects of gaming on health are declining market growth

  • Who are the major players in the Game Streaming Market?

    • Antstream Ltd., Bilibili Inc., Blacknut SAS, Blade SAS, Boosteroid Cloud Gaming, Discord Inc., Gamestream SAS, Meta Platforms Inc., NetEase Inc., Nimo TV, NVIDIA Corp., Sliver VR Technologies Inc., Sony Interactive Entertainment, SOOP Co. Ltd., Twitch channel, Ubitus KK, Utomik BV, Valve Corp, Xbox Game Studios and YouTube

Market Research Insights

  • The Game Streaming Market is evolving rapidly as platform operators leverage high-capacity internet networks to deliver frictionless entertainment ecosystems. By integrating sophisticated data analytics, streaming services have improved automated content recommendations by 30%, driving higher audience retention. Furthermore, the implementation of seamless cross-device compatibility has expanded active session lengths, resulting in a 25% increase in concurrent viewers during peak broadcasting events.
  • To support creators, platforms are optimizing their virtual tipping mechanisms, which has increased transaction completion rates by 18% and improved creator monetization. These systematic enhancements ensure viewer participation remains robust, directly aligning operational investments with measurable improvements in user engagement and sustainable platform revenue generation.

We can help! Our analysts can customize this game streaming market research report to meet your requirements.

Get in touch

1. Executive Summary

1.1 Market overview

Executive Summary - Chart on Market Overview
Executive Summary - Data Table on Market Overview
Executive Summary - Chart on Global Market Characteristics
Executive Summary - Chart on Market by Geography
Executive Summary - Chart on Market Segmentation by Revenue Stream
Executive Summary - Chart on Market Segmentation by Solution
Executive Summary - Chart on Market Segmentation by Platform
Executive Summary - Chart on Incremental Growth
Executive Summary - Data Table on Incremental Growth
Executive Summary - Chart on Company Market Positioning

2. Technavio Analysis

2.1 Analysis of price sensitivity, lifecycle, customer purchase basket, adoption rates, and purchase criteria

2.2 Criticality of inputs and Factors of differentiation

Chart on Overview on criticality of inputs and factors of differentiation

2.3 Factors of disruption

Chart on Overview on factors of disruption

2.4 Impact of drivers and challenges

Chart on Impact of drivers and challenges in 2025 and 2030

3. Market Landscape

3.1 Market ecosystem

Chart on Parent Market
Data Table on - Parent Market

3.2 Market characteristics

Chart on Market characteristics analysis

3.3 Value chain analysis

Chart on Value chain analysis

4. Market Sizing

4.1 Market definition

Data Table on Offerings of companies included in the market definition

4.2 Market segment analysis

Market segments

4.3 Market size 2025

4.4 Market outlook: Forecast for 2025-2030

Chart on Global - Market size and forecast 2025-2030 ($ million)
Data Table on Global - Market size and forecast 2025-2030 ($ million)
Chart on Global Market: Year-over-year growth 2025-2030 (%)
Data Table on Global Market: Year-over-year growth 2025-2030 (%)

5. Historic Market Size

5.1 Global Game Streaming Market 2020 - 2024

Historic Market Size - Data Table on Global Game Streaming Market 2020 - 2024 ($ million)

5.2 Revenue Stream segment analysis 2020 - 2024

Historic Market Size - Revenue Stream Segment 2020 - 2024 ($ million)

5.3 Solution segment analysis 2020 - 2024

Historic Market Size - Solution Segment 2020 - 2024 ($ million)

5.4 Platform segment analysis 2020 - 2024

Historic Market Size - Platform Segment 2020 - 2024 ($ million)

5.5 Geography segment analysis 2020 - 2024

Historic Market Size - Geography Segment 2020 - 2024 ($ million)

5.6 Country segment analysis 2020 - 2024

Historic Market Size - Country Segment 2020 - 2024 ($ million)

6. Qualitative Analysis

6.1 Impact of AI on Global Game Streaming Market

6.2 Impact of Geopolitical Conflicts on Global Game Streaming Market

7. Five Forces Analysis

7.1 Five forces summary

Five forces analysis - Comparison between 2025 and 2030

7.2 Bargaining power of buyers

Bargaining power of buyers - Impact of key factors 2025 and 2030

7.3 Bargaining power of suppliers

Bargaining power of suppliers - Impact of key factors in 2025 and 2030

7.4 Threat of new entrants

Threat of new entrants - Impact of key factors in 2025 and 2030

7.5 Threat of substitutes

Threat of substitutes - Impact of key factors in 2025 and 2030

7.6 Threat of rivalry

Threat of rivalry - Impact of key factors in 2025 and 2030

7.7 Market condition

Chart on Market condition - Five forces 2025 and 2030

8. Market Segmentation by Revenue Stream

8.1 Market segments

Chart on Revenue Stream - Market share 2025-2030 (%)
Data Table on Revenue Stream - Market share 2025-2030 (%)

8.2 Comparison by Revenue Stream

Chart on Comparison by Revenue Stream
Data Table on Comparison by Revenue Stream

8.3 In-game advertising - Market size and forecast 2025-2030

Chart on In-game advertising - Market size and forecast 2025-2030 ($ million)
Data Table on In-game advertising - Market size and forecast 2025-2030 ($ million)
Chart on In-game advertising - Year-over-year growth 2025-2030 (%)
Data Table on In-game advertising - Year-over-year growth 2025-2030 (%)

8.4 Subscription - Market size and forecast 2025-2030

Chart on Subscription - Market size and forecast 2025-2030 ($ million)
Data Table on Subscription - Market size and forecast 2025-2030 ($ million)
Chart on Subscription - Year-over-year growth 2025-2030 (%)
Data Table on Subscription - Year-over-year growth 2025-2030 (%)

8.5 Others - Market size and forecast 2025-2030

Chart on Others - Market size and forecast 2025-2030 ($ million)
Data Table on Others - Market size and forecast 2025-2030 ($ million)
Chart on Others - Year-over-year growth 2025-2030 (%)
Data Table on Others - Year-over-year growth 2025-2030 (%)

8.6 Market opportunity by Revenue Stream

Market opportunity by Revenue Stream ($ million)
Data Table on Market opportunity by Revenue Stream ($ million)

9. Market Segmentation by Solution

9.1 Market segments

Chart on Solution - Market share 2025-2030 (%)
Data Table on Solution - Market share 2025-2030 (%)

9.2 Comparison by Solution

Chart on Comparison by Solution
Data Table on Comparison by Solution

9.3 Web based - Market size and forecast 2025-2030

Chart on Web based - Market size and forecast 2025-2030 ($ million)
Data Table on Web based - Market size and forecast 2025-2030 ($ million)
Chart on Web based - Year-over-year growth 2025-2030 (%)
Data Table on Web based - Year-over-year growth 2025-2030 (%)

9.4 App based - Market size and forecast 2025-2030

Chart on App based - Market size and forecast 2025-2030 ($ million)
Data Table on App based - Market size and forecast 2025-2030 ($ million)
Chart on App based - Year-over-year growth 2025-2030 (%)
Data Table on App based - Year-over-year growth 2025-2030 (%)

9.5 Market opportunity by Solution

Market opportunity by Solution ($ million)
Data Table on Market opportunity by Solution ($ million)

10. Market Segmentation by Platform

10.1 Market segments

Chart on Platform - Market share 2025-2030 (%)
Data Table on Platform - Market share 2025-2030 (%)

10.2 Comparison by Platform

Chart on Comparison by Platform
Data Table on Comparison by Platform

10.3 Mobile - Market size and forecast 2025-2030

Chart on Mobile - Market size and forecast 2025-2030 ($ million)
Data Table on Mobile - Market size and forecast 2025-2030 ($ million)
Chart on Mobile - Year-over-year growth 2025-2030 (%)
Data Table on Mobile - Year-over-year growth 2025-2030 (%)

10.4 Console - Market size and forecast 2025-2030

Chart on Console - Market size and forecast 2025-2030 ($ million)
Data Table on Console - Market size and forecast 2025-2030 ($ million)
Chart on Console - Year-over-year growth 2025-2030 (%)
Data Table on Console - Year-over-year growth 2025-2030 (%)

10.5 PC - Market size and forecast 2025-2030

Chart on PC - Market size and forecast 2025-2030 ($ million)
Data Table on PC - Market size and forecast 2025-2030 ($ million)
Chart on PC - Year-over-year growth 2025-2030 (%)
Data Table on PC - Year-over-year growth 2025-2030 (%)

10.6 Smart TVs - Market size and forecast 2025-2030

Chart on Smart TVs - Market size and forecast 2025-2030 ($ million)
Data Table on Smart TVs - Market size and forecast 2025-2030 ($ million)
Chart on Smart TVs - Year-over-year growth 2025-2030 (%)
Data Table on Smart TVs - Year-over-year growth 2025-2030 (%)

10.7 Others - Market size and forecast 2025-2030

Chart on Others - Market size and forecast 2025-2030 ($ million)
Data Table on Others - Market size and forecast 2025-2030 ($ million)
Chart on Others - Year-over-year growth 2025-2030 (%)
Data Table on Others - Year-over-year growth 2025-2030 (%)

10.8 Market opportunity by Platform

Market opportunity by Platform ($ million)
Data Table on Market opportunity by Platform ($ million)

11. Customer Landscape

11.1 Customer landscape overview

Analysis of price sensitivity, lifecycle, customer purchase basket, adoption rates, and purchase criteria

12. Geographic Landscape

12.1 Geographic segmentation

Chart on Market share by geography 2025-2030 (%)
Data Table on Market share by geography 2025-2030 (%)

12.2 Geographic comparison

Chart on Geographic comparison
Data Table on Geographic comparison

12.3 North America - Market size and forecast 2025-2030

Chart on North America - Market size and forecast 2025-2030 ($ million)
Data Table on North America - Market size and forecast 2025-2030 ($ million)
Chart on North America - Year-over-year growth 2025-2030 (%)
Data Table on North America - Year-over-year growth 2025-2030 (%)
Chart on Regional Comparison - North America
Data Table on Regional Comparison - North America

12.3.1 US - Market size and forecast 2025-2030

Chart on US - Market size and forecast 2025-2030 ($ million)
Data Table on US - Market size and forecast 2025-2030 ($ million)
Chart on US - Year-over-year growth 2025-2030 (%)
Data Table on US - Year-over-year growth 2025-2030 (%)

12.3.2 Canada - Market size and forecast 2025-2030

Chart on Canada - Market size and forecast 2025-2030 ($ million)
Data Table on Canada - Market size and forecast 2025-2030 ($ million)
Chart on Canada - Year-over-year growth 2025-2030 (%)
Data Table on Canada - Year-over-year growth 2025-2030 (%)

12.3.3 Mexico - Market size and forecast 2025-2030

Chart on Mexico - Market size and forecast 2025-2030 ($ million)
Data Table on Mexico - Market size and forecast 2025-2030 ($ million)
Chart on Mexico - Year-over-year growth 2025-2030 (%)
Data Table on Mexico - Year-over-year growth 2025-2030 (%)

12.4 Europe - Market size and forecast 2025-2030

Chart on Europe - Market size and forecast 2025-2030 ($ million)
Data Table on Europe - Market size and forecast 2025-2030 ($ million)
Chart on Europe - Year-over-year growth 2025-2030 (%)
Data Table on Europe - Year-over-year growth 2025-2030 (%)
Chart on Regional Comparison - Europe
Data Table on Regional Comparison - Europe

12.4.1 Germany - Market size and forecast 2025-2030

Chart on Germany - Market size and forecast 2025-2030 ($ million)
Data Table on Germany - Market size and forecast 2025-2030 ($ million)
Chart on Germany - Year-over-year growth 2025-2030 (%)
Data Table on Germany - Year-over-year growth 2025-2030 (%)

12.4.2 UK - Market size and forecast 2025-2030

Chart on UK - Market size and forecast 2025-2030 ($ million)
Data Table on UK - Market size and forecast 2025-2030 ($ million)
Chart on UK - Year-over-year growth 2025-2030 (%)
Data Table on UK - Year-over-year growth 2025-2030 (%)

12.4.3 France - Market size and forecast 2025-2030

Chart on France - Market size and forecast 2025-2030 ($ million)
Data Table on France - Market size and forecast 2025-2030 ($ million)
Chart on France - Year-over-year growth 2025-2030 (%)
Data Table on France - Year-over-year growth 2025-2030 (%)

12.4.4 Italy - Market size and forecast 2025-2030

Chart on Italy - Market size and forecast 2025-2030 ($ million)
Data Table on Italy - Market size and forecast 2025-2030 ($ million)
Chart on Italy - Year-over-year growth 2025-2030 (%)
Data Table on Italy - Year-over-year growth 2025-2030 (%)

12.4.5 Spain - Market size and forecast 2025-2030

Chart on Spain - Market size and forecast 2025-2030 ($ million)
Data Table on Spain - Market size and forecast 2025-2030 ($ million)
Chart on Spain - Year-over-year growth 2025-2030 (%)
Data Table on Spain - Year-over-year growth 2025-2030 (%)

12.4.6 The Netherlands - Market size and forecast 2025-2030

Chart on The Netherlands - Market size and forecast 2025-2030 ($ million)
Data Table on The Netherlands - Market size and forecast 2025-2030 ($ million)
Chart on The Netherlands - Year-over-year growth 2025-2030 (%)
Data Table on The Netherlands - Year-over-year growth 2025-2030 (%)

12.5 APAC - Market size and forecast 2025-2030

Chart on APAC - Market size and forecast 2025-2030 ($ million)
Data Table on APAC - Market size and forecast 2025-2030 ($ million)
Chart on APAC - Year-over-year growth 2025-2030 (%)
Data Table on APAC - Year-over-year growth 2025-2030 (%)
Chart on Regional Comparison - APAC
Data Table on Regional Comparison - APAC

12.5.1 China - Market size and forecast 2025-2030

Chart on China - Market size and forecast 2025-2030 ($ million)
Data Table on China - Market size and forecast 2025-2030 ($ million)
Chart on China - Year-over-year growth 2025-2030 (%)
Data Table on China - Year-over-year growth 2025-2030 (%)

12.5.2 Japan - Market size and forecast 2025-2030

Chart on Japan - Market size and forecast 2025-2030 ($ million)
Data Table on Japan - Market size and forecast 2025-2030 ($ million)
Chart on Japan - Year-over-year growth 2025-2030 (%)
Data Table on Japan - Year-over-year growth 2025-2030 (%)

12.5.3 India - Market size and forecast 2025-2030

Chart on India - Market size and forecast 2025-2030 ($ million)
Data Table on India - Market size and forecast 2025-2030 ($ million)
Chart on India - Year-over-year growth 2025-2030 (%)
Data Table on India - Year-over-year growth 2025-2030 (%)

12.5.4 South Korea - Market size and forecast 2025-2030

Chart on South Korea - Market size and forecast 2025-2030 ($ million)
Data Table on South Korea - Market size and forecast 2025-2030 ($ million)
Chart on South Korea - Year-over-year growth 2025-2030 (%)
Data Table on South Korea - Year-over-year growth 2025-2030 (%)

12.5.5 Australia - Market size and forecast 2025-2030

Chart on Australia - Market size and forecast 2025-2030 ($ million)
Data Table on Australia - Market size and forecast 2025-2030 ($ million)
Chart on Australia - Year-over-year growth 2025-2030 (%)
Data Table on Australia - Year-over-year growth 2025-2030 (%)

12.5.6 Indonesia - Market size and forecast 2025-2030

Chart on Indonesia - Market size and forecast 2025-2030 ($ million)
Data Table on Indonesia - Market size and forecast 2025-2030 ($ million)
Chart on Indonesia - Year-over-year growth 2025-2030 (%)
Data Table on Indonesia - Year-over-year growth 2025-2030 (%)

12.6 South America - Market size and forecast 2025-2030

Chart on South America - Market size and forecast 2025-2030 ($ million)
Data Table on South America - Market size and forecast 2025-2030 ($ million)
Chart on South America - Year-over-year growth 2025-2030 (%)
Data Table on South America - Year-over-year growth 2025-2030 (%)
Chart on Regional Comparison - South America
Data Table on Regional Comparison - South America

12.6.1 Brazil - Market size and forecast 2025-2030

Chart on Brazil - Market size and forecast 2025-2030 ($ million)
Data Table on Brazil - Market size and forecast 2025-2030 ($ million)
Chart on Brazil - Year-over-year growth 2025-2030 (%)
Data Table on Brazil - Year-over-year growth 2025-2030 (%)

12.6.2 Argentina - Market size and forecast 2025-2030

Chart on Argentina - Market size and forecast 2025-2030 ($ million)
Data Table on Argentina - Market size and forecast 2025-2030 ($ million)
Chart on Argentina - Year-over-year growth 2025-2030 (%)
Data Table on Argentina - Year-over-year growth 2025-2030 (%)

12.6.3 Chile - Market size and forecast 2025-2030

Chart on Chile - Market size and forecast 2025-2030 ($ million)
Data Table on Chile - Market size and forecast 2025-2030 ($ million)
Chart on Chile - Year-over-year growth 2025-2030 (%)
Data Table on Chile - Year-over-year growth 2025-2030 (%)

12.7 Middle East and Africa - Market size and forecast 2025-2030

Chart on Middle East and Africa - Market size and forecast 2025-2030 ($ million)
Data Table on Middle East and Africa - Market size and forecast 2025-2030 ($ million)
Chart on Middle East and Africa - Year-over-year growth 2025-2030 (%)
Data Table on Middle East and Africa - Year-over-year growth 2025-2030 (%)
Chart on Regional Comparison - Middle East and Africa
Data Table on Regional Comparison - Middle East and Africa

12.7.1 Saudi Arabia - Market size and forecast 2025-2030

Chart on Saudi Arabia - Market size and forecast 2025-2030 ($ million)
Data Table on Saudi Arabia - Market size and forecast 2025-2030 ($ million)
Chart on Saudi Arabia - Year-over-year growth 2025-2030 (%)
Data Table on Saudi Arabia - Year-over-year growth 2025-2030 (%)

12.7.2 UAE - Market size and forecast 2025-2030

Chart on UAE - Market size and forecast 2025-2030 ($ million)
Data Table on UAE - Market size and forecast 2025-2030 ($ million)
Chart on UAE - Year-over-year growth 2025-2030 (%)
Data Table on UAE - Year-over-year growth 2025-2030 (%)

12.7.3 South Africa - Market size and forecast 2025-2030

Chart on South Africa - Market size and forecast 2025-2030 ($ million)
Data Table on South Africa - Market size and forecast 2025-2030 ($ million)
Chart on South Africa - Year-over-year growth 2025-2030 (%)
Data Table on South Africa - Year-over-year growth 2025-2030 (%)

12.7.4 Israel - Market size and forecast 2025-2030

Chart on Israel - Market size and forecast 2025-2030 ($ million)
Data Table on Israel - Market size and forecast 2025-2030 ($ million)
Chart on Israel - Year-over-year growth 2025-2030 (%)
Data Table on Israel - Year-over-year growth 2025-2030 (%)

12.7.5 Turkey - Market size and forecast 2025-2030

Chart on Turkey - Market size and forecast 2025-2030 ($ million)
Data Table on Turkey - Market size and forecast 2025-2030 ($ million)
Chart on Turkey - Year-over-year growth 2025-2030 (%)
Data Table on Turkey - Year-over-year growth 2025-2030 (%)

12.8 Market opportunity by geography

Market opportunity by geography ($ million)
Data Tables on Market opportunity by geography ($ million)

13. Drivers, Challenges, and Opportunity

13.1 Market drivers

Increasing popularity of e-sports tournaments
Surge in broadcasting of sports events
Growth of video game streaming software for mobile devices

13.2 Market challenges

Adverse effects of gaming on health are declining market growth
High cost of content creators
Increasing prevalence of cybercrime in online gaming

13.3 Impact of drivers and challenges

Impact of drivers and challenges in 2025 and 2030

13.4 Market opportunities

Growing popularity of gaming among women
Cost savings and quick onboarding
Increasing number of strategic partnerships and acquisitions

14. Competitive Landscape

14.1 Overview

14.2

Overview on criticality of inputs and factors of differentiation

14.3 Landscape disruption

Overview on factors of disruption

14.4 Industry risks

Impact of key risks on business

15. Competitive Analysis

15.1 Companies profiled

Companies covered

15.2 Company ranking index

15.3 Market positioning of companies

Matrix on companies position and classification

15.4 Antstream Ltd.

Antstream Ltd. - Overview
Antstream Ltd. - Product / Service
Antstream Ltd. - Key offerings
SWOT

15.5 Bilibili Inc.

Bilibili Inc. - Overview
Bilibili Inc. - Product / Service
Bilibili Inc. - Key offerings
SWOT

15.6 Blade SAS

Blade SAS - Overview
Blade SAS - Product / Service
Blade SAS - Key offerings
SWOT

15.7 Boosteroid Cloud Gaming

Boosteroid Cloud Gaming - Overview
Boosteroid Cloud Gaming - Product / Service
Boosteroid Cloud Gaming - Key offerings
SWOT

15.8 Discord Inc.

Discord Inc. - Overview
Discord Inc. - Product / Service
Discord Inc. - Key offerings
SWOT

15.9 Meta Platforms Inc.

Meta Platforms Inc. - Overview
Meta Platforms Inc. - Business segments
Meta Platforms Inc. - Key offerings
Meta Platforms Inc. - Segment focus
SWOT

15.10 NetEase Inc.

NetEase Inc. - Overview
NetEase Inc. - Business segments
NetEase Inc. - Key offerings
NetEase Inc. - Segment focus
SWOT

15.11 Nimo TV

Nimo TV - Overview
Nimo TV - Product / Service
Nimo TV - Key offerings
SWOT

15.12 NVIDIA Corp.

NVIDIA Corp. - Overview
NVIDIA Corp. - Business segments
NVIDIA Corp. - Key news
NVIDIA Corp. - Key offerings
NVIDIA Corp. - Segment focus
SWOT

15.13 Sony Interactive Entertainment

Sony Interactive Entertainment - Overview
Sony Interactive Entertainment - Product / Service
Sony Interactive Entertainment - Key offerings
SWOT

15.14 SOOP Co. Ltd.

SOOP Co. Ltd. - Overview
SOOP Co. Ltd. - Business segments
SOOP Co. Ltd. - Key offerings
SOOP Co. Ltd. - Segment focus
SWOT

15.15 Twitch channel

Twitch channel - Overview
Twitch channel - Product / Service
Twitch channel - Key offerings
SWOT

15.16 Ubitus KK

Ubitus KK - Overview
Ubitus KK - Product / Service
Ubitus KK - Key offerings
SWOT

15.17 Xbox Game Studios

Xbox Game Studios - Overview
Xbox Game Studios - Product / Service
Xbox Game Studios - Key offerings
SWOT

15.18 YouTube

YouTube - Overview
YouTube - Product / Service
YouTube - Key offerings
SWOT

16. Appendix

16.1 Scope of the report

Market definition
Objectives
Notes and caveats

16.2 Inclusions and exclusions checklist

Inclusions checklist
Exclusions checklist

16.3 Currency conversion rates for US$

16.4 Research methodology

16.5 Data procurement

Information sources

16.6 Data validation

16.7 Validation techniques employed for market sizing

16.8 Data synthesis

16.9 360 degree market analysis

16.10 List of abbreviations

Research Methodology

Technavio presents a detailed picture of the market by way of study, synthesis, and summation of data from multiple sources. The analysts have presented the various facets of the market with a particular focus on identifying the key industry influencers. The data thus presented is comprehensive, reliable, and the result of extensive research, both primary and secondary.

INFORMATION SOURCES

Primary sources

  • Manufacturers and suppliers
  • Channel partners
  • Industry experts
  • Strategic decision makers

Secondary sources

  • Industry journals and periodicals
  • Government data
  • Financial reports of key industry players
  • Historical data
  • Press releases

DATA ANALYSIS

Data Synthesis

  • Collation of data
  • Estimation of key figures
  • Analysis of derived insights

Data Validation

  • Triangulation with data models
  • Reference against proprietary databases
  • Corroboration with industry experts

REPORT WRITING

Qualitative

  • Market drivers
  • Market challenges
  • Market trends
  • Five forces analysis

Quantitative

  • Market size and forecast
  • Market segmentation
  • Geographical insights
  • Competitive landscape

Interested in this report?

Get your sample now to see our research methodology and insights!

Download Now

Frequently Asked Questions

Game Streaming market growth will increase by USD 1324.7 million during 2026-2030.

The Game Streaming market is expected to grow at a CAGR of 9.1% during 2026-2030.

Game Streaming market is segmented by Revenue stream (In-game advertising, Subscription, Others) Solution (Web based, App based) Platform (Mobile, Console, PC, Smart TVs, Others)

Antstream Ltd., Bilibili Inc., Blacknut SAS, Blade SAS, Boosteroid Cloud Gaming, Discord Inc., Gamestream SAS, Meta Platforms Inc., NetEase Inc., Nimo TV, NVIDIA Corp., Sliver VR Technologies Inc., Sony Interactive Entertainment, SOOP Co. Ltd., Twitch channel, Ubitus KK, Utomik BV, Valve Corp, Xbox Game Studios, YouTube are a few of the key vendors in the Game Streaming market.

North America will register the highest growth rate of 38.3% among the other regions. Therefore, the Game Streaming market in North America is expected to garner significant business opportunities for the vendors during the forecast period.

US, Canada, Mexico, Germany, UK, France, Italy, Spain, The Netherlands, China, Japan, India, South Korea, Australia, Indonesia, Brazil, Argentina, Chile, Saudi Arabia, UAE, South Africa, Israel, Turkey

  • Increasing popularity of e-sports tournaments is the driving factor this market.

The Game Streaming market vendors should focus on grabbing business opportunities from the Revenue stream segment as it accounted for the largest market share in the base year.
RIA - Research AI Assistant
Ask RIA
