Augmented Reality (AR) Market Analysis, Size, and Forecast 2025-2029: North America (US and Canada), Europe (France, Germany, and UK), APAC (China, India, Japan, and South Korea), South America (Brazil), and Rest of World (ROW)

Augmented Reality (AR) Market Analysis, Size, and Forecast 2025-2029:
North America (US and Canada), Europe (France, Germany, and UK), APAC (China, India, Japan, and South Korea), South America (Brazil), and Rest of World (ROW)

Published: Jun 2025 229 Pages SKU: IRTNTR40843

Market Overview at a Glance

$826 B
Market Opportunity
53.4%
CAGR
39.3
YoY growth 2024-2025(%)

Augmented Reality (AR) Market Size 2025-2029

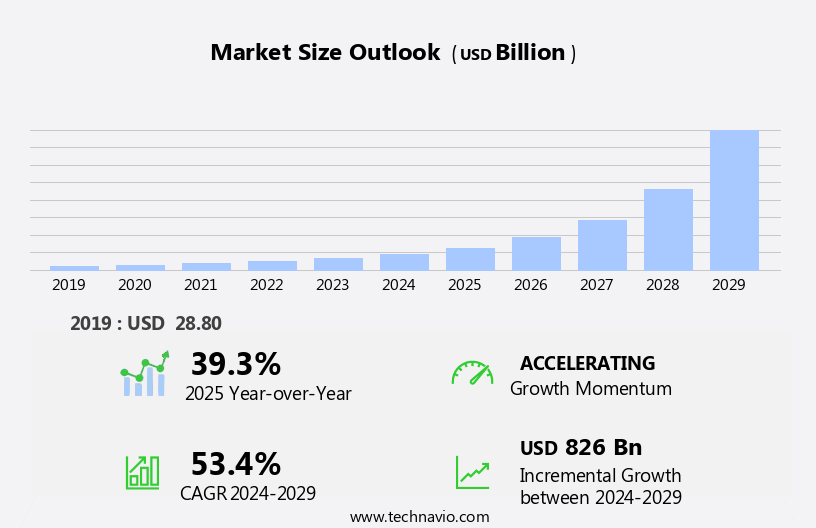
The augmented reality (AR) market size is forecast to increase by USD 826 billion at a CAGR of 53.4% between 2024 and 2029.

  • The market is experiencing significant growth, fueled by increasing investments in AR technology. Companies across various industries are recognizing the potential of AR to enhance user experiences and streamline operations. Extended reality technologies, including facial recognition and search engine optimization, are also reshaping social media marketing and remote collaboration. Notably, the integration of AR technology into mobile devices is driving widespread adoption, making the technology more accessible to consumers and businesses alike. However, the AR market faces challenges that require careful navigation. Privacy concerns over AR technology pose a significant obstacle.
  • Companies must address these concerns through transparent data handling practices and robust security measures to build trust with users and maintain regulatory compliance. By addressing these challenges, companies can capitalize on the vast opportunities presented by the AR market and stay ahead of the competition. As AR technology collects and processes user data, ensuring data security and privacy becomes paramount.

What will be the Size of the Augmented Reality (AR) Market during the forecast period?

Augmented Reality (AR) Market Size

 Explore in-depth regional segment analysis with market size data - historical 2019-2023 and forecasts 2025-2029 - in the full report.  
Request Free Sample

The AR market is experiencing significant growth, with various industries integrating engaging technologies such as brain-computer interfaces, eye tracking, and haptic suits to revolutionize customer engagement and product design. Simulated training in virtual environments using AR technology is transforming industrial automation and manufacturing processes, enhancing quality control and sales enablement. Moreover, AR's role in digital transformation extends to marketing analytics, where brands can increase brand awareness through 3D scanning and voice recognition. AR's integration into industrial applications, such as industrial automation and manufacturing processes, is driving the market forward.

Customer engagement is at the forefront of AR's impact, with businesses utilizing AR for simulated training, product design, and marketing campaigns. Market trends include the use of artificial intelligence, computer vision algorithms, and voice recognition to create more interactive and personalized experiences. Simultaneously, AR is streamlining supply chain management and enhancing remote collaboration, making it an essential tool for businesses undergoing digital transformation. In the realm of marketing, AR is being used to create engaging brand experiences, enabling businesses to connect with their customers in new and innovative ways. The future of AR is bright, with endless possibilities for enhancing customer engagement, improving industrial processes, and driving digital transformation.

How is this Augmented Reality (AR) Industry segmented?

The augmented reality (AR) industry research report provides comprehensive data (region-wise segment analysis), with forecasts and estimates in "USD billion" for the period 2025-2029, as well as historical data from 2019-2023 for the following segments.

  • Component
    • Hardware
    • Software
  • End-user
    • Enterprise
    • Retail
    • Healthcare
    • Media and entertainment
    • Others
  • Type
    • Head mounted displays
    • Smart glasses
    • Mobile AR
  • Geography
    • North America
      • US
      • Canada
    • Europe
      • France
      • Germany
      • UK
    • APAC
      • China
      • India
      • Japan
      • South Korea
    • South America
      • Brazil
    • Rest of World (ROW)

By Component Insights

The hardware segment is estimated to witness significant growth during the forecast period. The market is experiencing significant growth, with the hardware segment leading in revenue share in 2024. This dominance is attributed to the increasing adoption of AR devices in various industries, including education, healthcare, construction, and retail. As businesses invest in advanced AR solutions, the demand for AR technology continues to rise. AR glasses, which offer a more engaging experience by combining virtual reality and AR, are driving this trend. AR education, training, and marketing applications are also gaining popularity. Technical specifications, such as shader programming, computer vision, and 3D modeling, are crucial components of AR development. Markerless AR, environmental mapping, and projection mapping enhance the user experience.

Human-computer interaction, user interface design, and gesture recognition are essential for intuitive AR applications. AR content creation tools, SDKs, and game engine integration facilitate the development of AR experiences. AR revenue streams include advertising, customer segmentation, and digital twinning. AR filters, engaging experiences, and holographic projections are essential for engaging users. AR apps, head-mounted displays, and hand tracking are key technologies driving the market. Motion tracking, image processing, and real-time rendering are also critical components. Industry standards, accessibility features, and privacy concerns are essential considerations for AR market adoption. Ethical considerations, data processing, and consumer behavior are also crucial factors.

AR development tools, such as sensors, AI processing units, and cloud computing, enable the creation of advanced AR applications. The AR market is expected to grow due to the integration of AR with virtual reality, spatial computing, and mixed reality. Deep learning, neural networks, and machine learning are essential for enhancing AR capabilities. Haptic feedback, texture mapping, and object recognition further enrich AR experiences. AR headsets, AR training, and AR games are emerging areas of growth. The augmented reality market is witnessing significant growth due to the expanding use of AR devices and solutions across various industries.

The hardware segment, including AR glasses, is dominating the market, and the trend is expected to continue. AR technology offers engaging experiences, enhances user interaction, and provides valuable insights, making it an essential tool for businesses.

Augmented Reality (AR) Market Size

 Download Free Sample Report

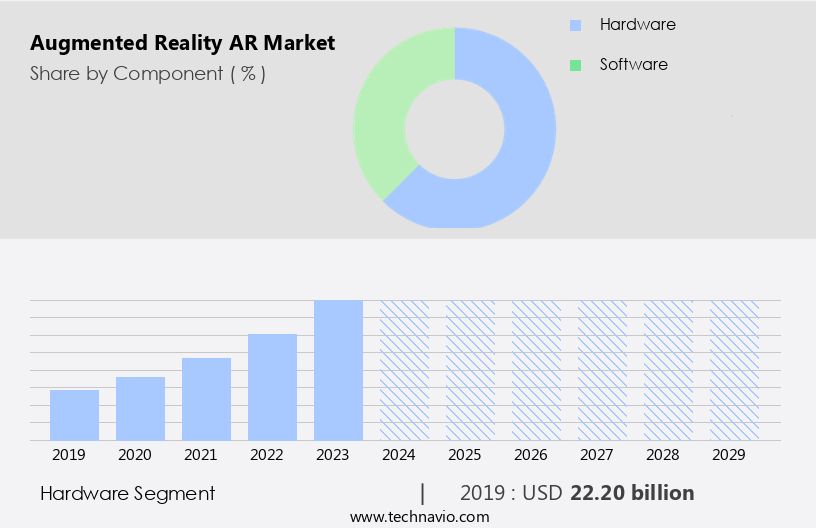
The Hardware segment was valued at USD 22.20 billion in 2019 and showed a gradual increase during the forecast period.

The Augmented Reality (AR) Market is witnessing a dynamic rise, fueled by innovations in augmented reality SDKs that enable developers to create powerful, cross-platform applications. Enhanced AR design is at the forefront, shaping intuitive user interfaces and seamless interactions. One significant advancement is marker-based AR, which uses visual markers to trigger digital overlays, providing tailored engaging experiences across industries like retail, healthcare, and education. To support these experiences, robust hardware components—such as smart glasses, sensors, and cameras—are becoming increasingly sophisticated.

The Augmented Reality (AR) Market is evolving rapidly, merging the physical and digital worlds through advanced technologies. At the forefront is the integration of brain-computer interface systems, enabling direct interaction between neural activity and digital environments. This leap supports the rise of the augmented human, enhancing physical capabilities and cognitive functions through AR-powered tools. The push toward enhanced reality is not just about visualization—it's about transforming everyday experiences across healthcare, gaming, manufacturing, and more. Brands are leveraging this shift through content marketing, delivering interactive and personalized campaigns that deeply engage users.

Regional Analysis

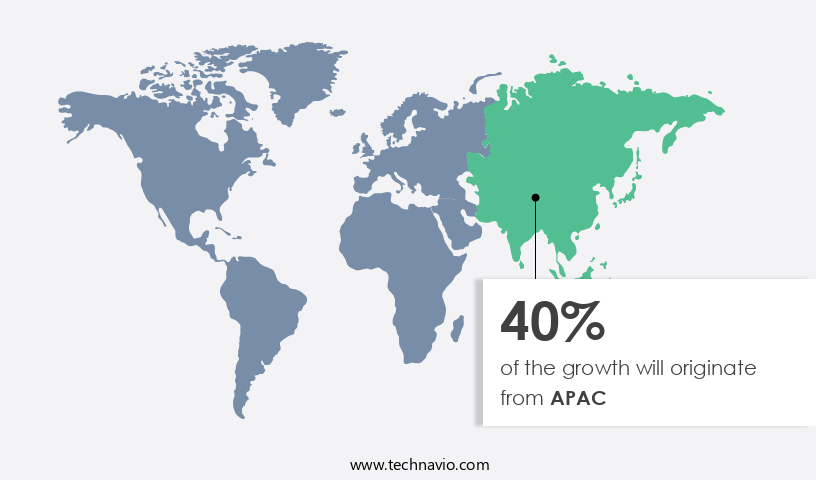
APAC is estimated to contribute 40% to the growth of the global market during the forecast period. Technavio's analysts have elaborately explained the regional trends and drivers that shape the market during the forecast period.

Augmented Reality (AR) Market Share by Geography

View Free PDF Sample

In the tech-driven North American market, the US stands out as a hub for innovation, particularly in the realm of advanced technologies like Augmented Reality (AR), Mixed Reality (MR), and Virtual Reality (VR). Canada's technological capabilities have also gained recognition. The interest in smart technologies, such as the Internet of Things (IoT), is growing among developers, manufacturers, and consumers. AR, in particular, is a leading and rapidly expanding technology. Major tech companies, including Alphabet, Facebook, and Microsoft, have established a strong presence in the US and are heavily investing in AR technology. They are not only innovating in the US but also expanding their reach.

AR technology is revolutionizing industries, from education and training to advertising and gaming, by offering engaging experiences through interactive installations, markerless AR, and holographic projections. AR development tools, such as shader programming, computer vision, and neural networks, are driving advancements in AR. Technical specifications, like positional tracking, depth sensing, and real-time rendering, are essential components of AR. User experience design, human-computer interaction, and gesture recognition are crucial aspects of AR, ensuring seamless integration and accessibility. Industry standards and AR SDKs are essential for AR content creation and development. AR advertising, AR games, and AR apps are emerging revenue streams.

Ethical considerations, data processing, and privacy concerns are essential topics in the AR market. The future of AR lies in its ability to provide engaging experiences, digital twinning, and spatial computing. AR headsets, AR glasses, and AR filters are transforming how we interact with digital content. AR training and user interaction design are key areas of focus for businesses. AR marketing and AR education are also gaining traction. The AR market is a dynamic and evolving space, with constant advancements in technology and business models.

Market Dynamics

Our researchers analyzed the data with 2024 as the base year, along with the key drivers, trends, and challenges. A holistic analysis of drivers will help companies refine their marketing strategies to gain a competitive advantage.

What are the Augmented Reality (AR) market drivers leading to the rise in the adoption of Industry?

  • The significant growth in investments for Advanced Rendering (AR) technology serves as the primary catalyst for market expansion. Augmented Reality (AR) is an innovative technology witnessing significant investment from major players and startups. The technology is poised to revolutionize various sectors, including social media, mobile devices, automotive, retail, and healthcare. AR's engaging capabilities demand substantial data delivery and processing power in real-time. To meet these requirements, substantial investments are being made in AR technology, with companies exploring partnerships and acquisitions.
  • Motion tracking, image processing, 3D rendering, AR games, head-mounted displays, sensor fusion, and gesture recognition are other key features driving AR's growth. With the increasing demand for AR applications, pricing strategies will play a crucial role in the market's expansion. AR's potential is vast, and its integration into everyday life is a testament to its transformative power. AR development tools, such as positional tracking, location-based AR, spatial computing, holographic projection, hand tracking, 3D modeling, AR advertising, and AI processing units, are essential components of this technology.

What are the Augmented Reality (AR) market trends shaping the Industry?

  • The integration of augmented reality (AR) technology in mobile devices is becoming increasingly mandatory in today's market. This trend signifies a significant shift towards more engaging and interactive user experiences. Augmented Reality (AR) is a technology that overlays digital information onto the real world, creating an engaging experience. Industry standards for AR include AR SDKs, depth sensing, and cloud computing, enabling advanced AR content creation. AR applications utilize user interaction design, deep learning, and marker-based recognition for seamless integration with the physical environment. AR technology is gaining popularity due to its ability to enhance consumer behavior and provide innovative training solutions.
  • Virtual reality and AR are often compared, but AR provides a more interactive and accessible experience, as it overlays digital information onto the real world. AR applications can be used in various industries, including manufacturing, healthcare, and education, for data processing and projection mapping. With the increasing availability of AR-enabled devices and the growing demand for engaging experiences, the AR market is poised for significant growth. AR glasses and headsets offer a more engaging experience, while marker-less AR uses camera phones for basic computer vision and positional tracking. However, privacy concerns and data security are critical issues that need addressing.

How does Augmented Reality (AR) market face challenges during its growth?

  • Privacy concerns remain a major challenge for AR integration, restricting adoption, user trust, and industry growth despite its strong potential for innovation across various sectors. Augmented Reality (AR) is a technology that overlays digital information onto the real world, revolutionizing various industries from marketing to manufacturing. Mobile AR, in particular, has gained significant traction due to its accessibility and ease of use. AR technology relies on software platforms, neural networks, and real-time rendering to provide users with engaging experiences. Object recognition and texture mapping enable AR to interact with the physical environment, while haptic feedback adds a tactile dimension. AR marketing is a growing business model, offering brands new ways to engage customers through AR overlays and mixed reality experiences. However, privacy concerns are a major challenge in the AR market.

  • AR collects and processes vast amounts of information about users and their environment, raising ethical considerations. User data privacy can be compromised through hacking or unauthorized access to devices. AR smart glasses, which automatically screen and process the environment, also pose privacy risks. These issues may hamper the growth of the AR market during the forecast period. AR technology also integrates with game engines for more complex applications. Machine learning and neural networks enhance AR capabilities, enabling more accurate object recognition and personalized experiences. Ethical considerations and privacy concerns must be addressed to ensure the responsible use of AR technology.

Exclusive Customer Landscape

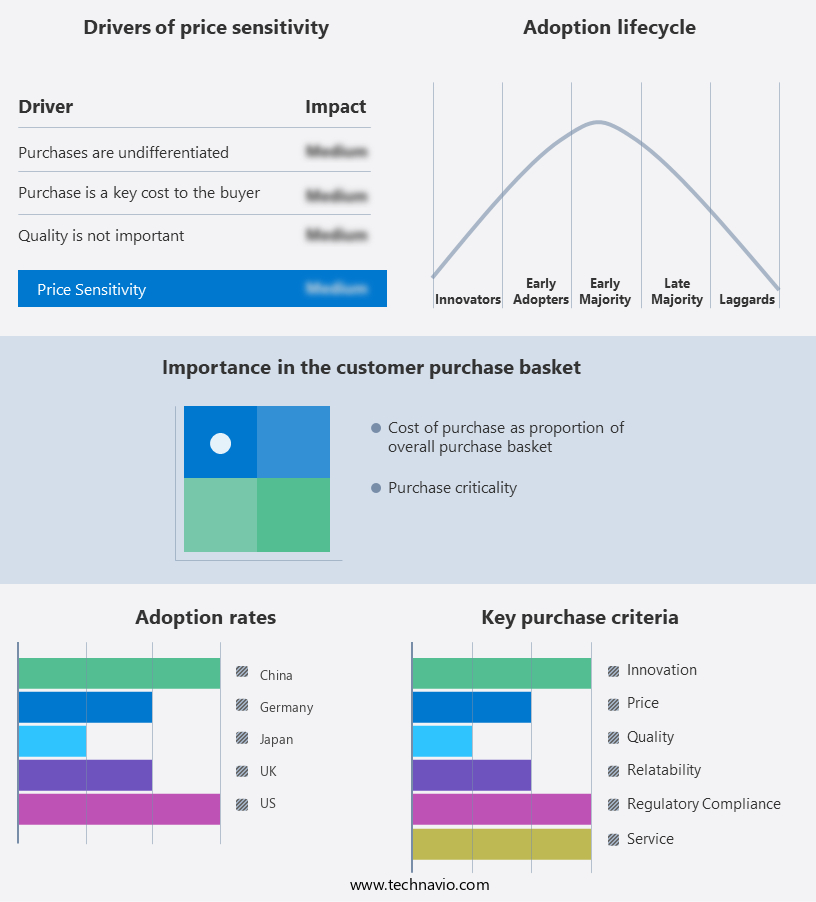
The augmented reality (AR) market forecasting report includes the adoption lifecycle of the market, covering from the innovator's stage to the laggard's stage. It focuses on adoption rates in different regions based on penetration. Furthermore, the augmented reality (AR) market report also includes key purchase criteria and drivers of price sensitivity to help companies evaluate and develop their market growth analysis strategies.

Augmented Reality (AR) Market Share by Geography

 Customer Landscape

Key Companies & Market Insights

Companies are implementing various strategies, such as strategic alliances, augmented reality (ar) market forecast, partnerships, mergers and acquisitions, geographical expansion, and product/service launches, to enhance their presence in the industry.

Atheer Inc - This company specializes in cutting-edge augmented reality technology, providing innovative solutions for various industries.

The industry research and growth report includes detailed analyses of the competitive landscape of the market and information about key companies, including:

  • Atheer Inc
  • Dynabook Singapore Pte. Ltd.
  • Google LLC
  • Inglobe Technologies Srl
  • Marxent Labs LLC
  • Maxst Co. Ltd.
  • Meta Platforms Inc.
  • Microsoft Corp.
  • Optinvent
  • PTC Inc.
  • Qualcomm Inc.
  • RealWear Inc.
  • Samsung Electronics Co. Ltd.
  • Seiko Epson Corp.
  • Sony Group Corp.
  • Ultraleap Ltd.
  • Upskill
  • Vuzix Corp.
  • Wikitude GmbH
  • Zugara Inc.

Qualitative and quantitative analysis of companies has been conducted to help clients understand the wider business environment as well as the strengths and weaknesses of key industry players. Data is qualitatively analyzed to categorize companies as pure play, category-focused, industry-focused, and diversified; it is quantitatively analyzed to categorize companies as dominant, leading, strong, tentative, and weak.

Recent Development and News in Augmented Reality (AR) Market

  • In January 2024, Google announced the launch of Google Lens Cloud Anchor, a new feature enabling persistent, shared AR experiences between users, marking a significant step towards collaborative AR applications (Source: Google Blog).
  • In March 2024, Apple and Snap Inc. unveiled a strategic partnership to integrate Snapchat's Lens AR technology into Apple's ARKit platform, expanding Snapchat's reach and enhancing Apple's AR capabilities (Source: Apple Press Info, Snapchat Press Room).
  • In May 2024, Magic Leap, the AR headset manufacturer, secured a USD 500 million funding round, led by Alphabet's investment arm, GV, to further develop its spatial computing technology and expand its market presence (Source: Magic Leap Press Room, TechCrunch).
  • In April 2025, Microsoft's HoloLens 3.0 received FDA clearance for use in medical training applications, marking a major regulatory milestone for AR technology in the healthcare sector (Source: Microsoft Press Room, FDA News).

Research Analyst Overview

Augmented Reality (AR) continues to evolve, with dynamic market activities unfolding across various sectors. AR SDKs play a crucial role in enabling AR content creation, while depth sensing and cloud computing enhance user experiences. Accessibility features and virtual reality convergence broaden AR's reach. Market adoption is fueled by engaging experiences, user interface design, and digital twinning, as businesses explore revenue streams from AR filters and advertising. AR glasses, training, and user interaction design are advancing, with hand tracking, gesture recognition, and positional tracking leading the way. Projection mapping, markerless AR, and holographic projection add to the technological richness of AR, while computer graphics, lighting effects, and 3D modeling bring realism to AR applications.

Data processing, consumer behavior, and data security are key considerations, with privacy concerns and ethical considerations shaping the industry's evolution. AR development tools and software platforms facilitate innovation, with neural networks and machine learning powering advanced AR applications. Real-time rendering and haptic feedback create more engaging user experiences, as AR headsets and mixed reality technologies push the boundaries of spatial computing. The AR market's continuous dynamism is reflected in its ongoing exploration of technical specifications, computer vision, environmental mapping, and object recognition. Pricing strategies and business models adapt to meet the evolving needs of customers, as AR applications find their place in education, entertainment, and industry.

Dive into Technavio's robust research methodology, blending expert interviews, extensive data synthesis, and validated models for unparalleled Augmented Reality (AR) Market insights. See full methodology.

Market Scope

Report Coverage

Details

Page number

229

Base year

2024

Historic period

2019-2023

Forecast period

2025-2029

Growth momentum & CAGR

Accelerate at a CAGR of 53.4%

Market growth 2025-2029

USD 826 billion

Market structure

Fragmented

YoY growth 2024-2025(%)

39.3

Key countries

US, China, Canada, Japan, Germany, UK, Brazil, France, India, and South Korea

Competitive landscape

Leading Companies, Market Positioning of Companies, Competitive Strategies, and Industry Risks

Request Free Sample

What are the Key Data Covered in this Augmented Reality (AR) Market Research and Growth Report?

  • CAGR of the Augmented Reality (AR) industry during the forecast period
  • Detailed information on factors that will drive the growth and forecasting between 2025 and 2029
  • Precise estimation of the size of the market and its contribution of the industry in focus to the parent market
  • Accurate predictions about upcoming growth and trends and changes in consumer behaviour
  • Growth of the market across North America, APAC, Europe, South America, and Middle East and Africa
  • Thorough analysis of the market's competitive landscape and detailed information about companies
  • Comprehensive analysis of factors that will challenge the augmented reality (ar) market growth of industry companies

We can help! Our analysts can customize this augmented reality (ar) market research report to meet your requirements.

Get in touch

1 Executive Summary

  • 1.1 Market overview
    • Executive Summary - Chart on Market Overview
    • Executive Summary - Data Table on Market Overview
    • Executive Summary - Chart on Global Market Characteristics
    • Executive Summary - Chart on Market by Geography
    • Executive Summary - Chart on Market Segmentation by Component
    • Executive Summary - Chart on Market Segmentation by End-user
    • Executive Summary - Chart on Market Segmentation by Type
    • Executive Summary - Chart on Incremental Growth
    • Executive Summary - Data Table on Incremental Growth
    • Executive Summary - Chart on Company Market Positioning

2 Technavio Analysis

  • 2.1 Analysis of price sensitivity, lifecycle, customer purchase basket, adoption rates, and purchase criteria
    • Analysis of price sensitivity, lifecycle, customer purchase basket, adoption rates, and purchase criteria
  • 2.2 Criticality of inputs and Factors of differentiation
    • Overview on criticality of inputs and factors of differentiation
  • 2.3 Factors of disruption
    • Overview on factors of disruption
  • 2.4 Impact of drivers and challenges
    • Impact of drivers and challenges in 2024 and 2029

3 Market Landscape

  • 3.1 Market ecosystem
    • Parent Market
    • Data Table on - Parent Market
  • 3.2 Market characteristics
    • Market characteristics analysis
  • 3.3 Value chain analysis
    • Value chain analysis

4 Market Sizing

  • 4.1 Market definition
    • Offerings of companies included in the market definition
  • 4.2 Market segment analysis
    • Market segments
  • 4.3 Market size 2024
    • 4.4 Market outlook: Forecast for 2024-2029
      • Chart on Global - Market size and forecast 2024-2029 ($ billion)
      • Data Table on Global - Market size and forecast 2024-2029 ($ billion)
      • Chart on Global Market: Year-over-year growth 2024-2029 (%)
      • Data Table on Global Market: Year-over-year growth 2024-2029 (%)

    5 Historic Market Size

    • 5.1 Global Augmented Reality (AR) Market 2019 - 2023
      • Historic Market Size - Data Table on Global Augmented Reality (AR) Market 2019 - 2023 ($ billion)
    • 5.2 Component segment analysis 2019 - 2023
      • Historic Market Size - Component Segment 2019 - 2023 ($ billion)
    • 5.3 End-user segment analysis 2019 - 2023
      • Historic Market Size - End-user Segment 2019 - 2023 ($ billion)
    • 5.4 Type segment analysis 2019 - 2023
      • Historic Market Size - Type Segment 2019 - 2023 ($ billion)
    • 5.5 Geography segment analysis 2019 - 2023
      • Historic Market Size - Geography Segment 2019 - 2023 ($ billion)
    • 5.6 Country segment analysis 2019 - 2023
      • Historic Market Size - Country Segment 2019 - 2023 ($ billion)

    6 Qualitative Analysis

    • 6.1 The AI impact on the global augmented reality (AR) market

      7 Five Forces Analysis

      • 7.1 Five forces summary
        • Five forces analysis - Comparison between 2024 and 2029
      • 7.2 Bargaining power of buyers
        • Bargaining power of buyers - Impact of key factors 2024 and 2029
      • 7.3 Bargaining power of suppliers
        • Bargaining power of suppliers - Impact of key factors in 2024 and 2029
      • 7.4 Threat of new entrants
        • Threat of new entrants - Impact of key factors in 2024 and 2029
      • 7.5 Threat of substitutes
        • Threat of substitutes - Impact of key factors in 2024 and 2029
      • 7.6 Threat of rivalry
        • Threat of rivalry - Impact of key factors in 2024 and 2029
      • 7.7 Market condition
        • Chart on Market condition - Five forces 2024 and 2029

      8 Market Segmentation by Component

      • 8.1 Market segments
        • Chart on Component - Market share 2024-2029 (%)
        • Data Table on Component - Market share 2024-2029 (%)
      • 8.2 Comparison by Component
        • Chart on Comparison by Component
        • Data Table on Comparison by Component
      • 8.3 Hardware - Market size and forecast 2024-2029
        • Chart on Hardware - Market size and forecast 2024-2029 ($ billion)
        • Data Table on Hardware - Market size and forecast 2024-2029 ($ billion)
        • Chart on Hardware - Year-over-year growth 2024-2029 (%)
        • Data Table on Hardware - Year-over-year growth 2024-2029 (%)
      • 8.4 Software - Market size and forecast 2024-2029
        • Chart on Software - Market size and forecast 2024-2029 ($ billion)
        • Data Table on Software - Market size and forecast 2024-2029 ($ billion)
        • Chart on Software - Year-over-year growth 2024-2029 (%)
        • Data Table on Software - Year-over-year growth 2024-2029 (%)
      • 8.5 Market opportunity by Component
        • Market opportunity by Component ($ billion)
        • Data Table on Market opportunity by Component ($ billion)

      9 Market Segmentation by End-user

      • 9.1 Market segments
        • Chart on End-user - Market share 2024-2029 (%)
        • Data Table on End-user - Market share 2024-2029 (%)
      • 9.2 Comparison by End-user
        • Chart on Comparison by End-user
        • Data Table on Comparison by End-user
      • 9.3 Enterprise - Market size and forecast 2024-2029
        • Chart on Enterprise - Market size and forecast 2024-2029 ($ billion)
        • Data Table on Enterprise - Market size and forecast 2024-2029 ($ billion)
        • Chart on Enterprise - Year-over-year growth 2024-2029 (%)
        • Data Table on Enterprise - Year-over-year growth 2024-2029 (%)
      • 9.4 Retail - Market size and forecast 2024-2029
        • Chart on Retail - Market size and forecast 2024-2029 ($ billion)
        • Data Table on Retail - Market size and forecast 2024-2029 ($ billion)
        • Chart on Retail - Year-over-year growth 2024-2029 (%)
        • Data Table on Retail - Year-over-year growth 2024-2029 (%)
      • 9.5 Healthcare - Market size and forecast 2024-2029
        • Chart on Healthcare - Market size and forecast 2024-2029 ($ billion)
        • Data Table on Healthcare - Market size and forecast 2024-2029 ($ billion)
        • Chart on Healthcare - Year-over-year growth 2024-2029 (%)
        • Data Table on Healthcare - Year-over-year growth 2024-2029 (%)
      • 9.6 Media and entertainment - Market size and forecast 2024-2029
        • Chart on Media and entertainment - Market size and forecast 2024-2029 ($ billion)
        • Data Table on Media and entertainment - Market size and forecast 2024-2029 ($ billion)
        • Chart on Media and entertainment - Year-over-year growth 2024-2029 (%)
        • Data Table on Media and entertainment - Year-over-year growth 2024-2029 (%)
      • 9.7 Others - Market size and forecast 2024-2029
        • Chart on Others - Market size and forecast 2024-2029 ($ billion)
        • Data Table on Others - Market size and forecast 2024-2029 ($ billion)
        • Chart on Others - Year-over-year growth 2024-2029 (%)
        • Data Table on Others - Year-over-year growth 2024-2029 (%)
      • 9.8 Market opportunity by End-user
        • Market opportunity by End-user ($ billion)
        • Data Table on Market opportunity by End-user ($ billion)

      10 Market Segmentation by Type

      • 10.1 Market segments
        • Chart on Type - Market share 2024-2029 (%)
        • Data Table on Type - Market share 2024-2029 (%)
      • 10.2 Comparison by Type
        • Chart on Comparison by Type
        • Data Table on Comparison by Type
      • 10.3 Head mounted displays - Market size and forecast 2024-2029
        • Chart on Head mounted displays - Market size and forecast 2024-2029 ($ billion)
        • Data Table on Head mounted displays - Market size and forecast 2024-2029 ($ billion)
        • Chart on Head mounted displays - Year-over-year growth 2024-2029 (%)
        • Data Table on Head mounted displays - Year-over-year growth 2024-2029 (%)
      • 10.4 Smart glasses - Market size and forecast 2024-2029
        • Chart on Smart glasses - Market size and forecast 2024-2029 ($ billion)
        • Data Table on Smart glasses - Market size and forecast 2024-2029 ($ billion)
        • Chart on Smart glasses - Year-over-year growth 2024-2029 (%)
        • Data Table on Smart glasses - Year-over-year growth 2024-2029 (%)
      • 10.5 Mobile AR - Market size and forecast 2024-2029
        • Chart on Mobile AR - Market size and forecast 2024-2029 ($ billion)
        • Data Table on Mobile AR - Market size and forecast 2024-2029 ($ billion)
        • Chart on Mobile AR - Year-over-year growth 2024-2029 (%)
        • Data Table on Mobile AR - Year-over-year growth 2024-2029 (%)
      • 10.6 Market opportunity by Type
        • Market opportunity by Type ($ billion)
        • Data Table on Market opportunity by Type ($ billion)

      11 Customer Landscape

      • 11.1 Customer landscape overview
        • Analysis of price sensitivity, lifecycle, customer purchase basket, adoption rates, and purchase criteria

      12 Geographic Landscape

      • 12.1 Geographic segmentation
        • Chart on Market share by geography 2024-2029 (%)
        • Data Table on Market share by geography 2024-2029 (%)
      • 12.2 Geographic comparison
        • Chart on Geographic comparison
        • Data Table on Geographic comparison
      • 12.3 North America - Market size and forecast 2024-2029
        • Chart on North America - Market size and forecast 2024-2029 ($ billion)
        • Data Table on North America - Market size and forecast 2024-2029 ($ billion)
        • Chart on North America - Year-over-year growth 2024-2029 (%)
        • Data Table on North America - Year-over-year growth 2024-2029 (%)
      • 12.4 APAC - Market size and forecast 2024-2029
        • Chart on APAC - Market size and forecast 2024-2029 ($ billion)
        • Data Table on APAC - Market size and forecast 2024-2029 ($ billion)
        • Chart on APAC - Year-over-year growth 2024-2029 (%)
        • Data Table on APAC - Year-over-year growth 2024-2029 (%)
      • 12.5 Europe - Market size and forecast 2024-2029
        • Chart on Europe - Market size and forecast 2024-2029 ($ billion)
        • Data Table on Europe - Market size and forecast 2024-2029 ($ billion)
        • Chart on Europe - Year-over-year growth 2024-2029 (%)
        • Data Table on Europe - Year-over-year growth 2024-2029 (%)
      • 12.6 South America - Market size and forecast 2024-2029
        • Chart on South America - Market size and forecast 2024-2029 ($ billion)
        • Data Table on South America - Market size and forecast 2024-2029 ($ billion)
        • Chart on South America - Year-over-year growth 2024-2029 (%)
        • Data Table on South America - Year-over-year growth 2024-2029 (%)
      • 12.7 Middle East and Africa - Market size and forecast 2024-2029
        • Chart on Middle East and Africa - Market size and forecast 2024-2029 ($ billion)
        • Data Table on Middle East and Africa - Market size and forecast 2024-2029 ($ billion)
        • Chart on Middle East and Africa - Year-over-year growth 2024-2029 (%)
        • Data Table on Middle East and Africa - Year-over-year growth 2024-2029 (%)
      • 12.8 US - Market size and forecast 2024-2029
        • Chart on US - Market size and forecast 2024-2029 ($ billion)
        • Data Table on US - Market size and forecast 2024-2029 ($ billion)
        • Chart on US - Year-over-year growth 2024-2029 (%)
        • Data Table on US - Year-over-year growth 2024-2029 (%)
      • 12.9 China - Market size and forecast 2024-2029
        • Chart on China - Market size and forecast 2024-2029 ($ billion)
        • Data Table on China - Market size and forecast 2024-2029 ($ billion)
        • Chart on China - Year-over-year growth 2024-2029 (%)
        • Data Table on China - Year-over-year growth 2024-2029 (%)
      • 12.10 Japan - Market size and forecast 2024-2029
        • Chart on Japan - Market size and forecast 2024-2029 ($ billion)
        • Data Table on Japan - Market size and forecast 2024-2029 ($ billion)
        • Chart on Japan - Year-over-year growth 2024-2029 (%)
        • Data Table on Japan - Year-over-year growth 2024-2029 (%)
      • 12.11 Canada - Market size and forecast 2024-2029
        • Chart on Canada - Market size and forecast 2024-2029 ($ billion)
        • Data Table on Canada - Market size and forecast 2024-2029 ($ billion)
        • Chart on Canada - Year-over-year growth 2024-2029 (%)
        • Data Table on Canada - Year-over-year growth 2024-2029 (%)
      • 12.12 Germany - Market size and forecast 2024-2029
        • Chart on Germany - Market size and forecast 2024-2029 ($ billion)
        • Data Table on Germany - Market size and forecast 2024-2029 ($ billion)
        • Chart on Germany - Year-over-year growth 2024-2029 (%)
        • Data Table on Germany - Year-over-year growth 2024-2029 (%)
      • 12.13 UK - Market size and forecast 2024-2029
        • Chart on UK - Market size and forecast 2024-2029 ($ billion)
        • Data Table on UK - Market size and forecast 2024-2029 ($ billion)
        • Chart on UK - Year-over-year growth 2024-2029 (%)
        • Data Table on UK - Year-over-year growth 2024-2029 (%)
      • 12.14 India - Market size and forecast 2024-2029
        • Chart on India - Market size and forecast 2024-2029 ($ billion)
        • Data Table on India - Market size and forecast 2024-2029 ($ billion)
        • Chart on India - Year-over-year growth 2024-2029 (%)
        • Data Table on India - Year-over-year growth 2024-2029 (%)
      • 12.15 Brazil - Market size and forecast 2024-2029
        • Chart on Brazil - Market size and forecast 2024-2029 ($ billion)
        • Data Table on Brazil - Market size and forecast 2024-2029 ($ billion)
        • Chart on Brazil - Year-over-year growth 2024-2029 (%)
        • Data Table on Brazil - Year-over-year growth 2024-2029 (%)
      • 12.16 France - Market size and forecast 2024-2029
        • Chart on France - Market size and forecast 2024-2029 ($ billion)
        • Data Table on France - Market size and forecast 2024-2029 ($ billion)
        • Chart on France - Year-over-year growth 2024-2029 (%)
        • Data Table on France - Year-over-year growth 2024-2029 (%)
      • 12.17 South Korea - Market size and forecast 2024-2029
        • Chart on South Korea - Market size and forecast 2024-2029 ($ billion)
        • Data Table on South Korea - Market size and forecast 2024-2029 ($ billion)
        • Chart on South Korea - Year-over-year growth 2024-2029 (%)
        • Data Table on South Korea - Year-over-year growth 2024-2029 (%)
      • 12.18 Market opportunity by geography
        • Market opportunity by geography ($ billion)
        • Data Tables on Market opportunity by geography ($ billion)

      13 Drivers, Challenges, and Opportunity/Restraints

      • 13.1 Market drivers
        • 13.2 Market challenges
          • 13.3 Impact of drivers and challenges
            • Impact of drivers and challenges in 2024 and 2029
          • 13.4 Market opportunities/restraints

            14 Competitive Landscape

            • 14.1 Overview
              • 14.2 Competitive Landscape
                • Overview on criticality of inputs and factors of differentiation
              • 14.3 Landscape disruption
                • Overview on factors of disruption
              • 14.4 Industry risks
                • Impact of key risks on business

              15 Competitive Analysis

              • 15.1 Companies profiled
                • Companies covered
              • 15.2 Company ranking index
                • Company ranking index
              • 15.3 Market positioning of companies
                • Matrix on companies position and classification
              • 15.4 Atheer Inc
                • Atheer Inc - Overview
                • Atheer Inc - Product / Service
                • Atheer Inc - Key offerings
                • SWOT
              • 15.5 Dynabook Singapore Pte. Ltd.
                • Dynabook Singapore Pte. Ltd. - Overview
                • Dynabook Singapore Pte. Ltd. - Product / Service
                • Dynabook Singapore Pte. Ltd. - Key offerings
                • SWOT
              • 15.6 Google LLC
                • Google LLC - Overview
                • Google LLC - Product / Service
                • Google LLC - Key news
                • Google LLC - Key offerings
                • SWOT
              • 15.7 Inglobe Technologies Srl
                • Inglobe Technologies Srl - Overview
                • Inglobe Technologies Srl - Product / Service
                • Inglobe Technologies Srl - Key offerings
                • SWOT
              • 15.8 Marxent Labs LLC
                • Marxent Labs LLC - Overview
                • Marxent Labs LLC - Product / Service
                • Marxent Labs LLC - Key offerings
                • SWOT
              • 15.9 Maxst Co. Ltd.
                • Maxst Co. Ltd. - Overview
                • Maxst Co. Ltd. - Product / Service
                • Maxst Co. Ltd. - Key offerings
                • SWOT
              • 15.10 Meta Platforms Inc.
                • Meta Platforms Inc. - Overview
                • Meta Platforms Inc. - Product / Service
                • Meta Platforms Inc. - Key news
                • Meta Platforms Inc. - Key offerings
                • SWOT
              • 15.11 Microsoft Corp.
                • Microsoft Corp. - Overview
                • Microsoft Corp. - Business segments
                • Microsoft Corp. - Key news
                • Microsoft Corp. - Key offerings
                • Microsoft Corp. - Segment focus
                • SWOT
              • 15.12 Optinvent
                • Optinvent - Overview
                • Optinvent - Product / Service
                • Optinvent - Key offerings
                • SWOT
              • 15.13 PTC Inc.
                • PTC Inc. - Overview
                • PTC Inc. - Business segments
                • PTC Inc. - Key offerings
                • PTC Inc. - Segment focus
                • SWOT
              • 15.14 Qualcomm Inc.
                • Qualcomm Inc. - Overview
                • Qualcomm Inc. - Business segments
                • Qualcomm Inc. - Key news
                • Qualcomm Inc. - Key offerings
                • Qualcomm Inc. - Segment focus
                • SWOT
              • 15.15 RealWear Inc.
                • RealWear Inc. - Overview
                • RealWear Inc. - Product / Service
                • RealWear Inc. - Key offerings
                • SWOT
              • 15.16 Samsung Electronics Co. Ltd.
                • Samsung Electronics Co. Ltd. - Overview
                • Samsung Electronics Co. Ltd. - Business segments
                • Samsung Electronics Co. Ltd. - Key news
                • Samsung Electronics Co. Ltd. - Key offerings
                • Samsung Electronics Co. Ltd. - Segment focus
                • SWOT
              • 15.17 Seiko Epson Corp.
                • Seiko Epson Corp. - Overview
                • Seiko Epson Corp. - Business segments
                • Seiko Epson Corp. - Key news
                • Seiko Epson Corp. - Key offerings
                • Seiko Epson Corp. - Segment focus
                • SWOT
              • 15.18 Sony Group Corp.
                • Sony Group Corp. - Overview
                • Sony Group Corp. - Business segments
                • Sony Group Corp. - Key offerings
                • Sony Group Corp. - Segment focus
                • SWOT

              16 Appendix

              • 16.1 Scope of the report
                • 16.2 Inclusions and exclusions checklist
                  • Inclusions checklist
                  • Exclusions checklist
                • 16.3 Currency conversion rates for US$
                  • Currency conversion rates for US$
                • 16.4 Research methodology
                  • Research methodology
                • 16.5 Data procurement
                  • Information sources
                • 16.6 Data validation
                  • Data validation
                • 16.7 Validation techniques employed for market sizing
                  • Validation techniques employed for market sizing
                • 16.8 Data synthesis
                  • Data synthesis
                • 16.9 360 degree market analysis
                  • 360 degree market analysis
                • 16.10 List of abbreviations
                  • List of abbreviations

                Research Methodology

                Technavio presents a detailed picture of the market by way of study, synthesis, and summation of data from multiple sources. The analysts have presented the various facets of the market with a particular focus on identifying the key industry influencers. The data thus presented is comprehensive, reliable, and the result of extensive research, both primary and secondary.

                INFORMATION SOURCES

                Primary sources

                • Manufacturers and suppliers
                • Channel partners
                • Industry experts
                • Strategic decision makers

                Secondary sources

                • Industry journals and periodicals
                • Government data
                • Financial reports of key industry players
                • Historical data
                • Press releases

                DATA ANALYSIS

                Data Synthesis

                • Collation of data
                • Estimation of key figures
                • Analysis of derived insights

                Data Validation

                • Triangulation with data models
                • Reference against proprietary databases
                • Corroboration with industry experts

                REPORT WRITING

                Qualitative

                • Market drivers
                • Market challenges
                • Market trends
                • Five forces analysis

                Quantitative

                • Market size and forecast
                • Market segmentation
                • Geographical insights
                • Competitive landscape

                Interested in this report?

                Get your sample now to see our research methodology and insights!

                Download Now

                Frequently Asked Questions

                Augmented Reality (Ar) market growth will increase by $ 826 bn during 2025-2029 .

                The Augmented Reality (Ar) market is expected to grow at a CAGR of 53.4% during 2025-2029 .

                Augmented Reality (Ar) market is segmented by Component( Hardware, Software, Media and entertainment, Healthcare, Others) End-user( Enterprise, Retail, Healthcare, Media and entertainment, Others) Type( Head mounted displays, Smart glasses, Mobile AR, South America, Middle East and Africa)

                Atheer Inc, Dynabook Singapore Pte. Ltd., Google LLC, Inglobe Technologies Srl, Marxent Labs LLC, Maxst Co. Ltd., Meta Platforms Inc., Microsoft Corp., Optinvent, PTC Inc., Qualcomm Inc., RealWear Inc., Samsung Electronics Co. Ltd., Seiko Epson Corp., Sony Group Corp., Ultraleap Ltd., Upskill, Vuzix Corp., Wikitude GmbH, Zugara Inc. are a few of the key vendors in the Augmented Reality (Ar) market.

                APAC will register the highest growth rate of 40% among the other regions. Therefore, the Augmented Reality (Ar) market in APAC is expected to garner significant business opportunities for the vendors during the forecast period.

                US, China, Canada, Japan, Germany, UK, Brazil, France, India, South Korea

                • Increasing investments in AR technologyAR is an emerging technology is the driving factor this market.
                • and several major players and startups are heavily investing in technology-related innovations. The technology is expected to be used in social media platforms is the driving factor this market.
                • mobile devices (for virtual conference calls) is the driving factor this market.
                • and automotive devices is the driving factor this market.
                • as well as in the retail and healthcare industries. As AR is being used every day by millions of people is the driving factor this market.
                • it requires the delivery of copious amounts of data and vast processing power to deliver information in real time. Massive investments are required to store vast amounts of data and deliver significant results is the driving factor this market.
                • for which various companies are investing in AR technology and engaging in partnerships and acquisitions. For instance is the driving factor this market.
                • Google subsidiary of Alphabet Inc. has launched Project Tango and ARcore to allow developers to create AR experiences on Android smartphones and tablets. These devices will have AR capabilities built in from the outset. Several apps is the driving factor this market.
                • such as real-time text translators is the driving factor this market.
                • filters on camera apps is the driving factor this market.
                • social media applications is the driving factor this market.
                • and interactive maps with exhaustive information is the driving factor this market.
                • use AR technology. Such advanced technologies require heavy investments in enhancing consumer experience. Companies is the driving factor this market.
                • therefore is the driving factor this market.
                • are investing in AR; these investments will drive the growth of the market during the forecast period. is the driving factor this market.

                The Augmented Reality (Ar) market vendors should focus on grabbing business opportunities from the Hardware segment as it accounted for the largest market share in the base year.