Amusement Park Market Analysis, Size, and Forecast 2026-2030: North America (US, Canada, and Mexico), APAC (China, Japan, and India), Europe (Germany, UK, and France), South America (Brazil and Argentina), Middle East and Africa (UAE, Saudi Arabia, and South Africa), and Rest of World (ROW)

Amusement Park Market Analysis, Size, and Forecast 2026-2030:
North America (US, Canada, and Mexico), APAC (China, Japan, and India), Europe (Germany, UK, and France), South America (Brazil and Argentina), Middle East and Africa (UAE, Saudi Arabia, and South Africa), and Rest of World (ROW)

Published: Mar 2026 300 Pages SKU: IRTNTR40528

Market Overview at a Glance

$68.30 B
Market Opportunity
12.9%
CAGR 2025 - 2030
35.7%
North America Growth
$42.45 B
Tickets segment 2024

Amusement Park Market Size 2026-2030

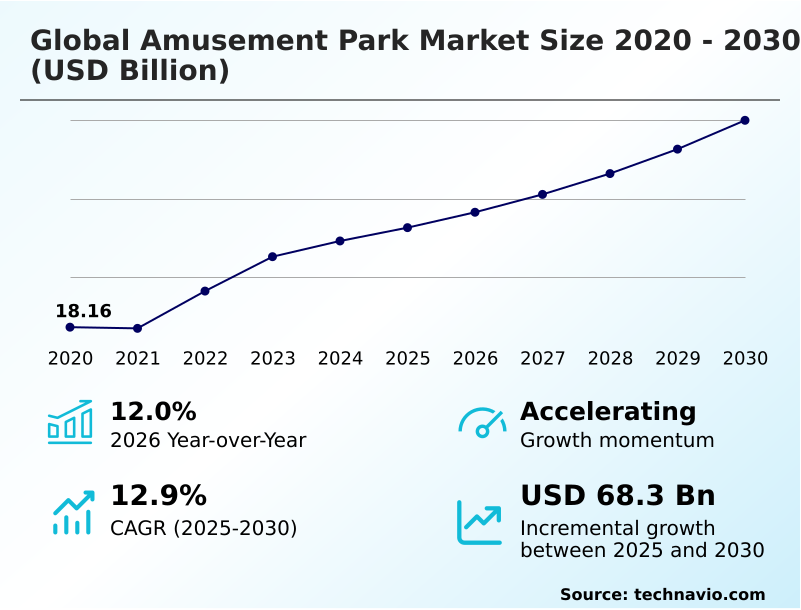
The amusement park market size is valued to increase by USD 68.30 billion, at a CAGR of 12.9% from 2025 to 2030. Mainstreaming of IP-based immersive storytelling and transmedia integration will drive the amusement park market.

Major Market Trends & Insights

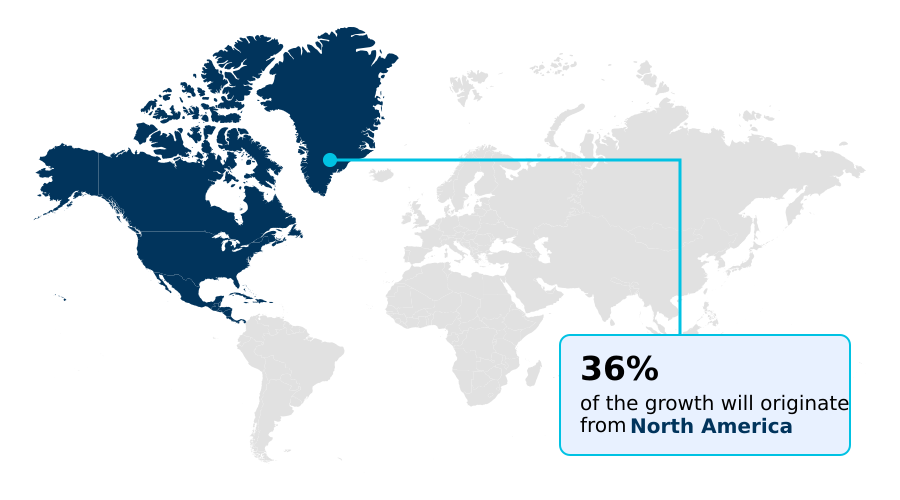
  • North America dominated the market and accounted for a 35.7% growth during the forecast period.
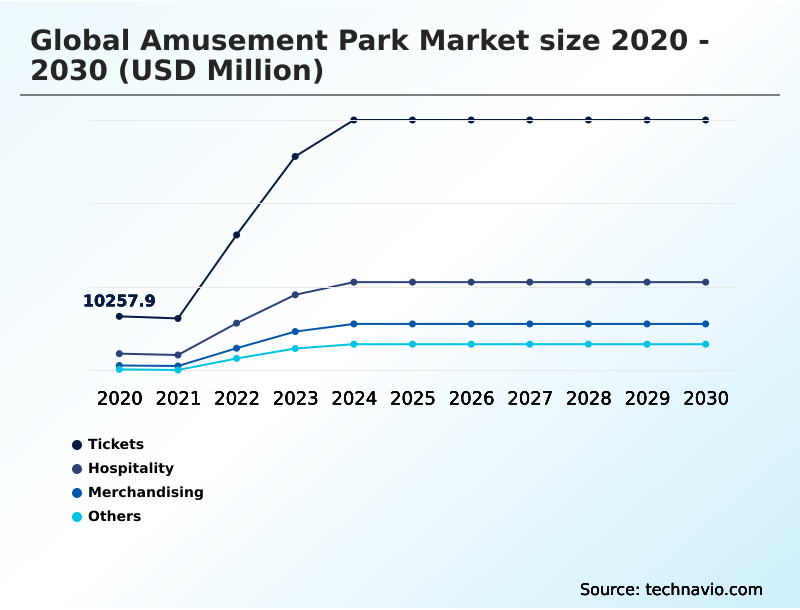
  • By Type - Tickets segment was valued at USD 42.45 billion in 2024
  • By Variant - Mechanical rides segment accounted for the largest market revenue share in 2024

Market Size & Forecast

  • Market Opportunities: USD 131.64 billion
  • Market Future Opportunities: USD 68.30 billion
  • CAGR from 2025 to 2030 : 12.9%

Market Summary

  • The amusement park market has evolved from offering mechanical attractions to creating comprehensive, destination-based entertainment ecosystems. This strategic pivot is driven by the intensive use of IP-based immersive storytelling, which leverages pre-existing emotional connections with audiences to foster brand loyalty programs and encourage multi-day visitation strategy.
  • A key trend is the development of hyper-personalized guest journeys through advanced phygital infrastructure, where generative AI and IoT ecosystems converge to optimize visitor flow. For instance, an operator might deploy predictive maintenance algorithms on high-thrill rides, using real-time data from smart sensor technology to anticipate mechanical issues.
  • This approach not only enhances safety but also minimizes costly downtime, improving operational efficiency gains and per-capita spending metrics. However, the industry grapples with challenges such as economic pressures on discretionary spending and the high capital expenditure programs required for mixed-use resort integration and institutionalized sustainability. The market's future hinges on balancing technological innovation with financial and environmental resilience.

What will be the Size of the Amusement Park Market during the forecast period?

Get Key Insights on Market Forecast (PDF) Request Free Sample

How is the Amusement Park Market Segmented?

The amusement park industry research report provides comprehensive data (region-wise segment analysis), with forecasts and estimates in "USD million" for the period 2026-2030, as well as historical data from 2020-2024 for the following segments.

  • Type
    • Tickets
    • Hospitality
    • Merchandising
    • Others
  • Variant
    • Mechanical rides
    • Water rides
    • Others
  • Age group
    • 19 to 35 years
    • Up to 18 years
    • 36 to 50 years
    • Above 50 years
  • Geography
    • North America
      • US
      • Canada
      • Mexico
    • APAC
      • China
      • Japan
      • India
    • Europe
      • Germany
      • UK
      • France
    • South America
      • Brazil
      • Argentina
    • Middle East and Africa
      • UAE
      • Saudi Arabia
      • South Africa
    • Rest of World (ROW)

By Type Insights

The tickets segment is estimated to witness significant growth during the forecast period.

The tickets segment is shifting from static admission models to sophisticated, dynamic pricing architectures. Operators now leverage predictive analytics to adjust costs based on real-time park capacity and demand forecasts, maximizing yield during peak periods.

This strategy is part of a move toward creating a seamless phygital experience. The proliferation of digital wallet integration and biometric authentication has streamlined visitor entry, with some parks reporting a reduction in gate friction by over 15%.

Furthermore, the adoption of robotic process automation and flexible micro-experience passes, driven by guest journey optimization, caters to diverse consumer needs.

This focus on operational efficiency gains and customer acquisition cost through smart park technologies underscores the segment's evolution toward hyper-personalized guest journeys and high-margin revenue growth.

Request Free Sample

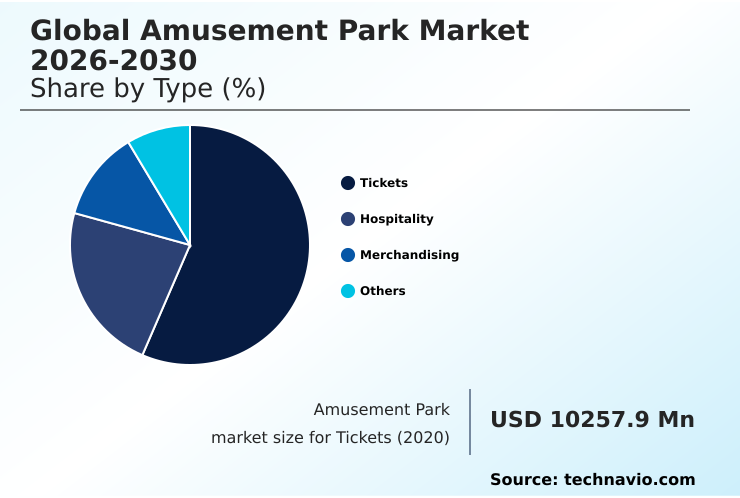
The Tickets segment was valued at USD 42.45 billion in 2024 and showed a gradual increase during the forecast period.

Request Free Sample

Regional Analysis

North America is estimated to contribute 35.7% to the growth of the global market during the forecast period.Technavio’s analysts have elaborately explained the regional trends and drivers that shape the market during the forecast period.

See How Amusement Park Market Demand is Rising in North America Request Free Sample

The geographic landscape of the amusement park market is defined by a contrast between mature regions and high-growth corridors. North America, which accounts for 35.7% of incremental growth, focuses on reinvestment in IP-based immersive storytelling and capital expenditure programs.

In contrast, the APAC region, with 34.65% of growth, is characterized by large-scale new builds and the rapid adoption of digital wallet integration.

In these high-density markets, the deployment of AI-driven crowd management systems has improved visitor flow analysis by over 20%.

European parks are prioritizing eco-conscious master planning and sustainable operational protocols, while the Middle East is investing heavily in record-breaking, climate-resilient infrastructure as part of broader economic diversification efforts, including luxury hospitality services.

Market Dynamics

Our researchers analyzed the data with 2025 as the base year, along with the key drivers, trends, and challenges. A holistic analysis of drivers will help companies refine their marketing strategies to gain a competitive advantage.

  • The modern amusement park market navigates a complex operational landscape where strategic decisions balance high capital investment with long-term profitability. A central consideration is the ROI of dynamic pricing models in theme parks, which must be weighed against the potential for alienating cost-sensitive consumers.
  • Similarly, the choice between integrating IP franchises into new park designs versus developing original concepts involves a trade-off between guaranteed brand recognition and creative freedom. Technologically, operators focus on optimizing guest flow using real-time IoT sensor networks and reducing queue wait times with virtual queuing systems.
  • For example, parks implementing predictive maintenance for high-thrill mechanical rides report a reduction in unscheduled downtime that is nearly double that of parks using traditional schedules, directly boosting capacity and revenue. The impact of augmented reality on interactive dark rides is another key area, offering a cost-effective way to refresh attractions.
  • Sustainability best practices in modern water park design, such as advanced water recycling, are becoming standard. These factors, from using AI for creating personalized guest itineraries to measuring the impact of themed retail store experiences and using transmedia integration for extending brand narrative, collectively shape the competitive environment.
  • Success depends on a holistic strategy that addresses the challenges of recruiting skilled maintenance engineers, leverages IP-based storytelling to drive repeat visitation, and manages operational costs with smart energy grids.

What are the key market drivers leading to the rise in the adoption of Amusement Park Industry?

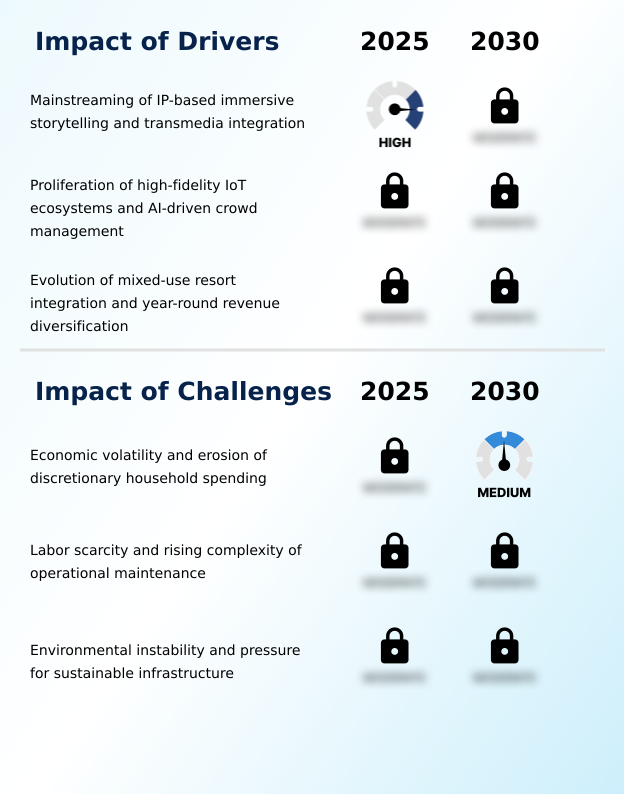
  • The mainstreaming of IP-based immersive storytelling and transmedia integration is a key driver propelling market growth.

  • Market growth is primarily propelled by the strategic pivot to IP-based immersive storytelling, a premiumization strategy that leverages established franchises to ensure high-margin revenue growth.
  • The integration of popular IPs into immersive themed environments has been shown to boost ancillary revenue streams from merchandise by over 40%. A second major driver is the proliferation of IoT ecosystems and AI-driven crowd management.
  • This phygital infrastructure, which includes dynamic queue management systems, reduces average wait times by 15 minutes during peak hours, directly enhancing the visitor experience.
  • Finally, the evolution toward mixed-use resort integration, featuring family entertainment centers and luxury hospitality services, is creating comprehensive destinations that encourage multi-day visitation and provide year-round revenue diversification.

What are the market trends shaping the Amusement Park Industry?

  • The integration of generative AI is emerging as a significant market trend. It enables the delivery of hyper-personalized guest journeys and experiences.

  • Key trends are reshaping the market, led by the integration of generative AI to deliver hyper-personalized guest journeys. This technology, part of a broader shift to immersive engineering, enables dynamic itineraries and personalized recommendations, with early adopters reporting a 10% increase in guest satisfaction scores. Another significant trend is institutionalized sustainability, where operators are adopting circular economy principles.
  • The implementation of advanced grey-water recycling systems in water parks has already reduced water consumption by up to 30% in some facilities. Concurrently, the use of gamified attractions and cross-platform meta-narratives is extending brand engagement beyond physical park boundaries, supported by digital wallet integration. This focus on guest journey optimization reflects a move toward more interactive and eco-conscious entertainment models.

What challenges does the Amusement Park Industry face during its growth?

  • Economic volatility, leading to the erosion of discretionary household spending, poses a key challenge to the industry's growth trajectory.

  • The market faces considerable headwinds, primarily from economic volatility that erodes discretionary spending and dampens visitor-flow analysis. A significant operational challenge is the persistent labor scarcity, particularly for technicians skilled in predictive maintenance algorithms and digital twin technology, which has increased maintenance costs by an average of 12%.
  • Environmental instability presents another critical issue, as extreme weather events cause unplanned closures, leading to revenue losses of up to 5% annually for some outdoor parks. The associated pressure to invest in sustainable operational protocols and green infrastructure, such as carbon-neutral construction, adds further financial strain, complicating long-term capital expenditure programs for many operators.

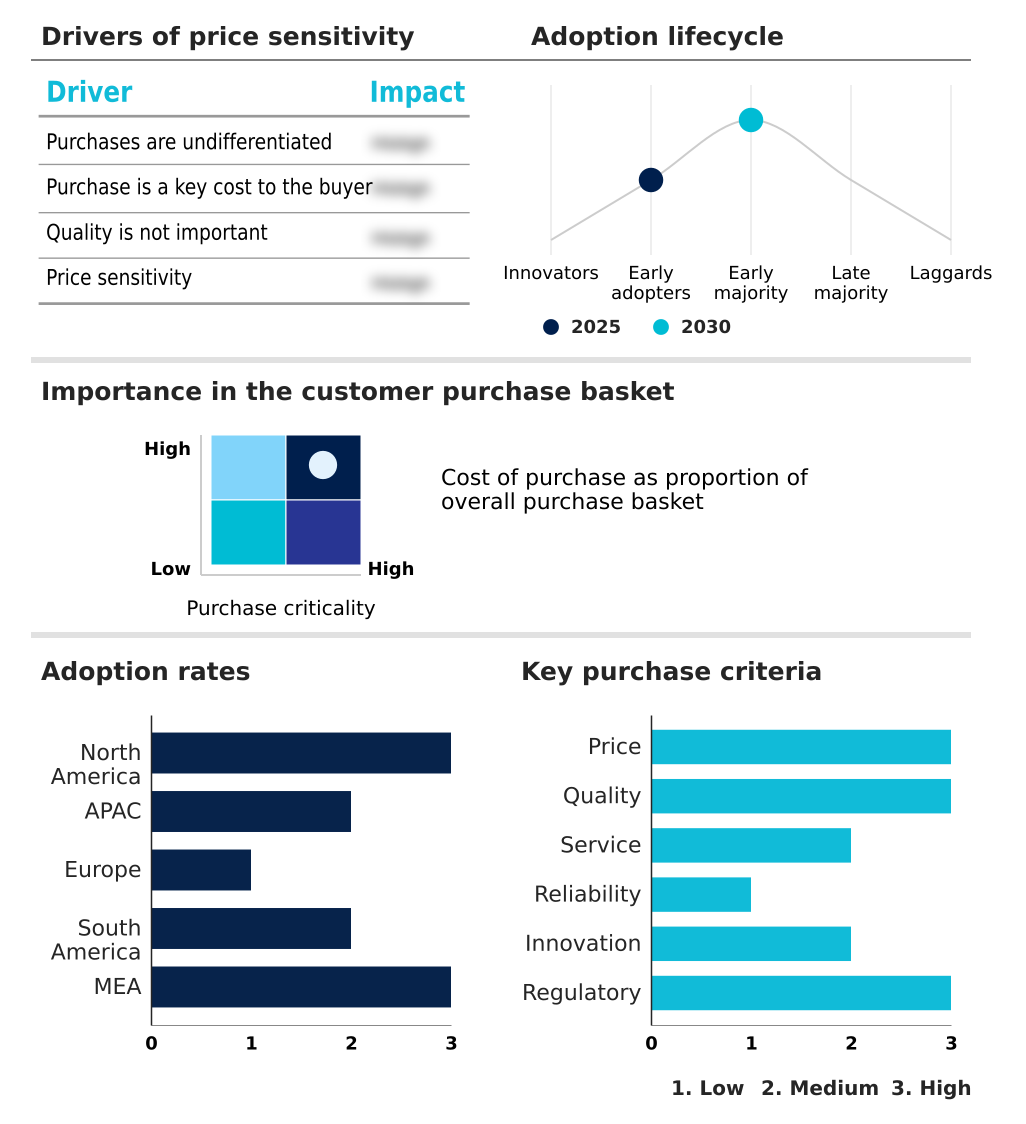
Exclusive Technavio Analysis on Customer Landscape

The amusement park market forecasting report includes the adoption lifecycle of the market, covering from the innovator’s stage to the laggard’s stage. It focuses on adoption rates in different regions based on penetration. Furthermore, the amusement park market report also includes key purchase criteria and drivers of price sensitivity to help companies evaluate and develop their market growth analysis strategies.

Customer Landscape of Amusement Park Industry

Competitive Landscape

Companies are implementing various strategies, such as strategic alliances, amusement park market forecast, partnerships, mergers and acquisitions, geographical expansion, and product/service launches, to enhance their presence in the industry.

Beto Carrero World - Operations focus on delivering a diverse portfolio of themed areas, including high-thrill roller coasters and live entertainment, to capture a broad visitor demographic.

The industry research and growth report includes detailed analyses of the competitive landscape of the market and information about key companies, including:

  • Beto Carrero World
  • Comcast Corp.
  • Dubai Parks and Resorts
  • Efteling BV
  • Europa Park GmbH and Co. KG
  • Fantawild Holdings Inc.
  • Imagicaaworld Entertainment
  • Lotte Corp.
  • Merlin Entertainments Ltd.
  • Miral Asset Management LLC
  • Nicco Parks and Resorts Ltd.
  • Parques Reunidos SAU
  • Puy du Fou France
  • Ride Entertainment Group
  • Six Flags Entertainment Corp.
  • The Walt Disney Co.
  • Tivoli AS
  • United Parks and Resorts Inc.
  • Wonderla Amusement Park

Qualitative and quantitative analysis of companies has been conducted to help clients understand the wider business environment as well as the strengths and weaknesses of key industry players. Data is qualitatively analyzed to categorize companies as pure play, category-focused, industry-focused, and diversified; it is quantitatively analyzed to categorize companies as dominant, leading, strong, tentative, and weak.

Recent Development and News in Amusement park market

  • In May 2025, Universal Destinations and Experiences is scheduled to open the Universal Epic Universe in Orlando, Florida, a massive development featuring five themed lands and advanced interactive ride technology.
  • In April 2025, Universal Destinations and Experiences finalized a multi-billion-pound agreement with the United Kingdom government for a new theme park and resort in Bedfordshire, a project expected to significantly contribute to the national economy.
  • In February 2025, the Chickasaw Nation opened the OKANA Resort and Indoor Waterpark in Oklahoma City, a $400 million development featuring a 100,000-square-foot indoor waterpark.
  • In September 2024, Six Flags Entertainment Corp. launched a large-scale hiring campaign across its North American properties to fill thousands of seasonal and technical roles, addressing industry-wide labor shortages.

Dive into Technavio’s robust research methodology, blending expert interviews, extensive data synthesis, and validated models for unparalleled Amusement Park Market insights. See full methodology.

Market Scope
Page number 300
Base year 2025
Historic period 2020-2024
Forecast period 2026-2030
Growth momentum & CAGR Accelerate at a CAGR of 12.9%
Market growth 2026-2030 USD 68298.7 million
Market structure Fragmented
YoY growth 2025-2026(%) 12.0%
Key countries US, Canada, Mexico, China, Japan, India, South Korea, Australia, Indonesia, Germany, UK, France, Spain, Italy, The Netherlands, Brazil, Argentina, Chile, UAE, Saudi Arabia, South Africa, Egypt and Israel
Competitive landscape Leading Companies, Market Positioning of Companies, Competitive Strategies, and Industry Risks

Request Free Sample

Research Analyst Overview

  • The amusement park market is transitioning toward sophisticated, multi-faceted resort models centered on destination-based entertainment. The integration of powerful intellectual property is no longer optional but a core strategy, with IP-based immersive storytelling and transmedia integration driving repeat visitation and high-margin revenue growth.
  • Technologically, the industry is defined by the proliferation of IoT ecosystems and smart park technologies designed to create a seamless phygital experience. This includes everything from biometric authentication for entry to dynamic queue management powered by predictive analytics.
  • The trend toward institutionalized sustainability has become a boardroom-level priority, directly influencing capital allocation for developing carbon-neutral construction and climate-resilient infrastructure to meet regulatory standards. The implementation of this advanced phygital infrastructure has enabled leading operators to achieve a 15% increase in ancillary revenue per visitor by delivering targeted, real-time offers and creating hyper-personalized guest journeys.
  • The market's trajectory is shaped by this blend of immersive engineering, gamified attractions, and data-driven operational intelligence.

What are the Key Data Covered in this Amusement Park Market Research and Growth Report?

  • What is the expected growth of the Amusement Park Market between 2026 and 2030?

    • USD 68.30 billion, at a CAGR of 12.9%

  • What segmentation does the market report cover?

    • The report is segmented by Type (Tickets, Hospitality, Merchandising, and Others), Variant (Mechanical rides, Water rides, and Others), Age Group (19 to 35 years, Up to 18 years, 36 to 50 years, and Above 50 years) and Geography (North America, APAC, Europe, South America, Middle East and Africa)

  • Which regions are analyzed in the report?

    • North America, APAC, Europe, South America and Middle East and Africa

  • What are the key growth drivers and market challenges?

    • Mainstreaming of IP-based immersive storytelling and transmedia integration, Economic volatility and erosion of discretionary household spending

  • Who are the major players in the Amusement Park Market?

    • Beto Carrero World, Comcast Corp., Dubai Parks and Resorts, Efteling BV, Europa Park GmbH and Co. KG, Fantawild Holdings Inc., Imagicaaworld Entertainment, Lotte Corp., Merlin Entertainments Ltd., Miral Asset Management LLC, Nicco Parks and Resorts Ltd., Parques Reunidos SAU, Puy du Fou France, Ride Entertainment Group, Six Flags Entertainment Corp., The Walt Disney Co., Tivoli AS, United Parks and Resorts Inc. and Wonderla Amusement Park

Market Research Insights

  • The market is undergoing a significant digital transformation, defined by the shift to smart park technologies and phygital infrastructure. This evolution focuses on guest journey optimization, using real-time data analytics to power dynamic pricing architectures and immersive themed environments.
  • The deployment of dynamic queue management systems, for instance, has demonstrated the capacity to reduce average wait times by up to 25%, directly improving guest satisfaction scores. Furthermore, the widespread adoption of contactless payment infrastructure is increasing ancillary revenue streams, with some operators reporting a 10% lift in per-capita spending.
  • These advancements, including augmented reality overlays and agentic gaming systems, are central to creating compelling, year-round revenue diversification and maintaining a competitive edge in the experience economy.

We can help! Our analysts can customize this amusement park market research report to meet your requirements.

Get in touch

1. Executive Summary

1.1 Market overview

Executive Summary - Chart on Market Overview
Executive Summary - Data Table on Market Overview
Executive Summary - Chart on Global Market Characteristics
Executive Summary - Chart on Market by Geography
Executive Summary - Chart on Market Segmentation by Type
Executive Summary - Chart on Market Segmentation by Variant
Executive Summary - Chart on Market Segmentation by Age Group
Executive Summary - Chart on Incremental Growth
Executive Summary - Data Table on Incremental Growth
Executive Summary - Chart on Company Market Positioning

2. Technavio Analysis

2.1 Analysis of price sensitivity, lifecycle, customer purchase basket, adoption rates, and purchase criteria

2.2 Criticality of inputs and Factors of differentiation

Chart on Overview on criticality of inputs and factors of differentiation

2.3 Factors of disruption

Chart on Overview on factors of disruption

2.4 Impact of drivers and challenges

Chart on Impact of drivers and challenges in 2025 and 2030

3. Market Landscape

3.1 Market ecosystem

Chart on Parent Market
Data Table on - Parent Market

3.2 Market characteristics

Chart on Market characteristics analysis

3.3 Value chain analysis

Chart on Value chain analysis

4. Market Sizing

4.1 Market definition

Data Table on Offerings of companies included in the market definition

4.2 Market segment analysis

Market segments

4.3 Market size 2025

4.4 Market outlook: Forecast for 2025-2030

Chart on Global - Market size and forecast 2025-2030 ($ million)
Data Table on Global - Market size and forecast 2025-2030 ($ million)
Chart on Global Market: Year-over-year growth 2025-2030 (%)
Data Table on Global Market: Year-over-year growth 2025-2030 (%)

5. Historic Market Size

5.1 Global Amusement Park Market 2020 - 2024

Historic Market Size - Data Table on Global Amusement Park Market 2020 - 2024 ($ million)

5.2 Type segment analysis 2020 - 2024

Historic Market Size - Type Segment 2020 - 2024 ($ million)

5.3 Variant segment analysis 2020 - 2024

Historic Market Size - Variant Segment 2020 - 2024 ($ million)

5.4 Age Group segment analysis 2020 - 2024

Historic Market Size - Age Group Segment 2020 - 2024 ($ million)

5.5 Geography segment analysis 2020 - 2024

Historic Market Size - Geography Segment 2020 - 2024 ($ million)

5.6 Country segment analysis 2020 - 2024

Historic Market Size - Country Segment 2020 - 2024 ($ million)

6. Qualitative Analysis

6.1 Impact of AI in global amusement park market

7. Five Forces Analysis

7.1 Five forces summary

Five forces analysis - Comparison between 2025 and 2030

7.2 Bargaining power of buyers

Bargaining power of buyers - Impact of key factors 2025 and 2030

7.3 Bargaining power of suppliers

Bargaining power of suppliers - Impact of key factors in 2025 and 2030

7.4 Threat of new entrants

Threat of new entrants - Impact of key factors in 2025 and 2030

7.5 Threat of substitutes

Threat of substitutes - Impact of key factors in 2025 and 2030

7.6 Threat of rivalry

Threat of rivalry - Impact of key factors in 2025 and 2030

7.7 Market condition

Chart on Market condition - Five forces 2025 and 2030

8. Market Segmentation by Type

8.1 Market segments

Chart on Type - Market share 2025-2030 (%)
Data Table on Type - Market share 2025-2030 (%)

8.2 Comparison by Type

Chart on Comparison by Type
Data Table on Comparison by Type

8.3 Tickets - Market size and forecast 2025-2030

Chart on Tickets - Market size and forecast 2025-2030 ($ million)
Data Table on Tickets - Market size and forecast 2025-2030 ($ million)
Chart on Tickets - Year-over-year growth 2025-2030 (%)
Data Table on Tickets - Year-over-year growth 2025-2030 (%)

8.4 Hospitality - Market size and forecast 2025-2030

Chart on Hospitality - Market size and forecast 2025-2030 ($ million)
Data Table on Hospitality - Market size and forecast 2025-2030 ($ million)
Chart on Hospitality - Year-over-year growth 2025-2030 (%)
Data Table on Hospitality - Year-over-year growth 2025-2030 (%)

8.5 Merchandising - Market size and forecast 2025-2030

Chart on Merchandising - Market size and forecast 2025-2030 ($ million)
Data Table on Merchandising - Market size and forecast 2025-2030 ($ million)
Chart on Merchandising - Year-over-year growth 2025-2030 (%)
Data Table on Merchandising - Year-over-year growth 2025-2030 (%)

8.6 Others - Market size and forecast 2025-2030

Chart on Others - Market size and forecast 2025-2030 ($ million)
Data Table on Others - Market size and forecast 2025-2030 ($ million)
Chart on Others - Year-over-year growth 2025-2030 (%)
Data Table on Others - Year-over-year growth 2025-2030 (%)

8.7 Market opportunity by Type

Market opportunity by Type ($ million)
Data Table on Market opportunity by Type ($ million)

9. Market Segmentation by Variant

9.1 Market segments

Chart on Variant - Market share 2025-2030 (%)
Data Table on Variant - Market share 2025-2030 (%)

9.2 Comparison by Variant

Chart on Comparison by Variant
Data Table on Comparison by Variant

9.3 Mechanical rides - Market size and forecast 2025-2030

Chart on Mechanical rides - Market size and forecast 2025-2030 ($ million)
Data Table on Mechanical rides - Market size and forecast 2025-2030 ($ million)
Chart on Mechanical rides - Year-over-year growth 2025-2030 (%)
Data Table on Mechanical rides - Year-over-year growth 2025-2030 (%)

9.4 Water rides - Market size and forecast 2025-2030

Chart on Water rides - Market size and forecast 2025-2030 ($ million)
Data Table on Water rides - Market size and forecast 2025-2030 ($ million)
Chart on Water rides - Year-over-year growth 2025-2030 (%)
Data Table on Water rides - Year-over-year growth 2025-2030 (%)

9.5 Others - Market size and forecast 2025-2030

Chart on Others - Market size and forecast 2025-2030 ($ million)
Data Table on Others - Market size and forecast 2025-2030 ($ million)
Chart on Others - Year-over-year growth 2025-2030 (%)
Data Table on Others - Year-over-year growth 2025-2030 (%)

9.6 Market opportunity by Variant

Market opportunity by Variant ($ million)
Data Table on Market opportunity by Variant ($ million)

10. Market Segmentation by Age Group

10.1 Market segments

Chart on Age Group - Market share 2025-2030 (%)
Data Table on Age Group - Market share 2025-2030 (%)

10.2 Comparison by Age Group

Chart on Comparison by Age Group
Data Table on Comparison by Age Group

10.3 19 to 35 years - Market size and forecast 2025-2030

Chart on 19 to 35 years - Market size and forecast 2025-2030 ($ million)
Data Table on 19 to 35 years - Market size and forecast 2025-2030 ($ million)
Chart on 19 to 35 years - Year-over-year growth 2025-2030 (%)
Data Table on 19 to 35 years - Year-over-year growth 2025-2030 (%)

10.4 Up to 18 years - Market size and forecast 2025-2030

Chart on Up to 18 years - Market size and forecast 2025-2030 ($ million)
Data Table on Up to 18 years - Market size and forecast 2025-2030 ($ million)
Chart on Up to 18 years - Year-over-year growth 2025-2030 (%)
Data Table on Up to 18 years - Year-over-year growth 2025-2030 (%)

10.5 36 to 50 years - Market size and forecast 2025-2030

Chart on 36 to 50 years - Market size and forecast 2025-2030 ($ million)
Data Table on 36 to 50 years - Market size and forecast 2025-2030 ($ million)
Chart on 36 to 50 years - Year-over-year growth 2025-2030 (%)
Data Table on 36 to 50 years - Year-over-year growth 2025-2030 (%)

10.6 Above 50 years - Market size and forecast 2025-2030

Chart on Above 50 years - Market size and forecast 2025-2030 ($ million)
Data Table on Above 50 years - Market size and forecast 2025-2030 ($ million)
Chart on Above 50 years - Year-over-year growth 2025-2030 (%)
Data Table on Above 50 years - Year-over-year growth 2025-2030 (%)

10.7 Market opportunity by Age Group

Market opportunity by Age Group ($ million)
Data Table on Market opportunity by Age Group ($ million)

11. Customer Landscape

11.1 Customer landscape overview

Analysis of price sensitivity, lifecycle, customer purchase basket, adoption rates, and purchase criteria

12. Geographic Landscape

12.1 Geographic segmentation

Chart on Market share by geography 2025-2030 (%)
Data Table on Market share by geography 2025-2030 (%)

12.2 Geographic comparison

Chart on Geographic comparison
Data Table on Geographic comparison

12.3 North America - Market size and forecast 2025-2030

Chart on North America - Market size and forecast 2025-2030 ($ million)
Data Table on North America - Market size and forecast 2025-2030 ($ million)
Chart on North America - Year-over-year growth 2025-2030 (%)
Data Table on North America - Year-over-year growth 2025-2030 (%)
Chart on Regional Comparison - North America
Data Table on Regional Comparison - North America

12.3.1 US - Market size and forecast 2025-2030

Chart on US - Market size and forecast 2025-2030 ($ million)
Data Table on US - Market size and forecast 2025-2030 ($ million)
Chart on US - Year-over-year growth 2025-2030 (%)
Data Table on US - Year-over-year growth 2025-2030 (%)

12.3.2 Canada - Market size and forecast 2025-2030

Chart on Canada - Market size and forecast 2025-2030 ($ million)
Data Table on Canada - Market size and forecast 2025-2030 ($ million)
Chart on Canada - Year-over-year growth 2025-2030 (%)
Data Table on Canada - Year-over-year growth 2025-2030 (%)

12.3.3 Mexico - Market size and forecast 2025-2030

Chart on Mexico - Market size and forecast 2025-2030 ($ million)
Data Table on Mexico - Market size and forecast 2025-2030 ($ million)
Chart on Mexico - Year-over-year growth 2025-2030 (%)
Data Table on Mexico - Year-over-year growth 2025-2030 (%)

12.4 APAC - Market size and forecast 2025-2030

Chart on APAC - Market size and forecast 2025-2030 ($ million)
Data Table on APAC - Market size and forecast 2025-2030 ($ million)
Chart on APAC - Year-over-year growth 2025-2030 (%)
Data Table on APAC - Year-over-year growth 2025-2030 (%)
Chart on Regional Comparison - APAC
Data Table on Regional Comparison - APAC

12.4.1 China - Market size and forecast 2025-2030

Chart on China - Market size and forecast 2025-2030 ($ million)
Data Table on China - Market size and forecast 2025-2030 ($ million)
Chart on China - Year-over-year growth 2025-2030 (%)
Data Table on China - Year-over-year growth 2025-2030 (%)

12.4.2 Japan - Market size and forecast 2025-2030

Chart on Japan - Market size and forecast 2025-2030 ($ million)
Data Table on Japan - Market size and forecast 2025-2030 ($ million)
Chart on Japan - Year-over-year growth 2025-2030 (%)
Data Table on Japan - Year-over-year growth 2025-2030 (%)

12.4.3 India - Market size and forecast 2025-2030

Chart on India - Market size and forecast 2025-2030 ($ million)
Data Table on India - Market size and forecast 2025-2030 ($ million)
Chart on India - Year-over-year growth 2025-2030 (%)
Data Table on India - Year-over-year growth 2025-2030 (%)

12.4.4 South Korea - Market size and forecast 2025-2030

Chart on South Korea - Market size and forecast 2025-2030 ($ million)
Data Table on South Korea - Market size and forecast 2025-2030 ($ million)
Chart on South Korea - Year-over-year growth 2025-2030 (%)
Data Table on South Korea - Year-over-year growth 2025-2030 (%)

12.4.5 Australia - Market size and forecast 2025-2030

Chart on Australia - Market size and forecast 2025-2030 ($ million)
Data Table on Australia - Market size and forecast 2025-2030 ($ million)
Chart on Australia - Year-over-year growth 2025-2030 (%)
Data Table on Australia - Year-over-year growth 2025-2030 (%)

12.4.6 Indonesia - Market size and forecast 2025-2030

Chart on Indonesia - Market size and forecast 2025-2030 ($ million)
Data Table on Indonesia - Market size and forecast 2025-2030 ($ million)
Chart on Indonesia - Year-over-year growth 2025-2030 (%)
Data Table on Indonesia - Year-over-year growth 2025-2030 (%)

12.5 Europe - Market size and forecast 2025-2030

Chart on Europe - Market size and forecast 2025-2030 ($ million)
Data Table on Europe - Market size and forecast 2025-2030 ($ million)
Chart on Europe - Year-over-year growth 2025-2030 (%)
Data Table on Europe - Year-over-year growth 2025-2030 (%)
Chart on Regional Comparison - Europe
Data Table on Regional Comparison - Europe

12.5.1 Germany - Market size and forecast 2025-2030

Chart on Germany - Market size and forecast 2025-2030 ($ million)
Data Table on Germany - Market size and forecast 2025-2030 ($ million)
Chart on Germany - Year-over-year growth 2025-2030 (%)
Data Table on Germany - Year-over-year growth 2025-2030 (%)

12.5.2 UK - Market size and forecast 2025-2030

Chart on UK - Market size and forecast 2025-2030 ($ million)
Data Table on UK - Market size and forecast 2025-2030 ($ million)
Chart on UK - Year-over-year growth 2025-2030 (%)
Data Table on UK - Year-over-year growth 2025-2030 (%)

12.5.3 France - Market size and forecast 2025-2030

Chart on France - Market size and forecast 2025-2030 ($ million)
Data Table on France - Market size and forecast 2025-2030 ($ million)
Chart on France - Year-over-year growth 2025-2030 (%)
Data Table on France - Year-over-year growth 2025-2030 (%)

12.5.4 Spain - Market size and forecast 2025-2030

Chart on Spain - Market size and forecast 2025-2030 ($ million)
Data Table on Spain - Market size and forecast 2025-2030 ($ million)
Chart on Spain - Year-over-year growth 2025-2030 (%)
Data Table on Spain - Year-over-year growth 2025-2030 (%)

12.5.5 Italy - Market size and forecast 2025-2030

Chart on Italy - Market size and forecast 2025-2030 ($ million)
Data Table on Italy - Market size and forecast 2025-2030 ($ million)
Chart on Italy - Year-over-year growth 2025-2030 (%)
Data Table on Italy - Year-over-year growth 2025-2030 (%)

12.5.6 The Netherlands - Market size and forecast 2025-2030

Chart on The Netherlands - Market size and forecast 2025-2030 ($ million)
Data Table on The Netherlands - Market size and forecast 2025-2030 ($ million)
Chart on The Netherlands - Year-over-year growth 2025-2030 (%)
Data Table on The Netherlands - Year-over-year growth 2025-2030 (%)

12.6 South America - Market size and forecast 2025-2030

Chart on South America - Market size and forecast 2025-2030 ($ million)
Data Table on South America - Market size and forecast 2025-2030 ($ million)
Chart on South America - Year-over-year growth 2025-2030 (%)
Data Table on South America - Year-over-year growth 2025-2030 (%)
Chart on Regional Comparison - South America
Data Table on Regional Comparison - South America

12.6.1 Brazil - Market size and forecast 2025-2030

Chart on Brazil - Market size and forecast 2025-2030 ($ million)
Data Table on Brazil - Market size and forecast 2025-2030 ($ million)
Chart on Brazil - Year-over-year growth 2025-2030 (%)
Data Table on Brazil - Year-over-year growth 2025-2030 (%)

12.6.2 Argentina - Market size and forecast 2025-2030

Chart on Argentina - Market size and forecast 2025-2030 ($ million)
Data Table on Argentina - Market size and forecast 2025-2030 ($ million)
Chart on Argentina - Year-over-year growth 2025-2030 (%)
Data Table on Argentina - Year-over-year growth 2025-2030 (%)

12.6.3 Chile - Market size and forecast 2025-2030

Chart on Chile - Market size and forecast 2025-2030 ($ million)
Data Table on Chile - Market size and forecast 2025-2030 ($ million)
Chart on Chile - Year-over-year growth 2025-2030 (%)
Data Table on Chile - Year-over-year growth 2025-2030 (%)

12.7 Middle East and Africa - Market size and forecast 2025-2030

Chart on Middle East and Africa - Market size and forecast 2025-2030 ($ million)
Data Table on Middle East and Africa - Market size and forecast 2025-2030 ($ million)
Chart on Middle East and Africa - Year-over-year growth 2025-2030 (%)
Data Table on Middle East and Africa - Year-over-year growth 2025-2030 (%)
Chart on Regional Comparison - Middle East and Africa
Data Table on Regional Comparison - Middle East and Africa

12.7.1 UAE - Market size and forecast 2025-2030

Chart on UAE - Market size and forecast 2025-2030 ($ million)
Data Table on UAE - Market size and forecast 2025-2030 ($ million)
Chart on UAE - Year-over-year growth 2025-2030 (%)
Data Table on UAE - Year-over-year growth 2025-2030 (%)

12.7.2 Saudi Arabia - Market size and forecast 2025-2030

Chart on Saudi Arabia - Market size and forecast 2025-2030 ($ million)
Data Table on Saudi Arabia - Market size and forecast 2025-2030 ($ million)
Chart on Saudi Arabia - Year-over-year growth 2025-2030 (%)
Data Table on Saudi Arabia - Year-over-year growth 2025-2030 (%)

12.7.3 South Africa - Market size and forecast 2025-2030

Chart on South Africa - Market size and forecast 2025-2030 ($ million)
Data Table on South Africa - Market size and forecast 2025-2030 ($ million)
Chart on South Africa - Year-over-year growth 2025-2030 (%)
Data Table on South Africa - Year-over-year growth 2025-2030 (%)

12.7.4 Egypt - Market size and forecast 2025-2030

Chart on Egypt - Market size and forecast 2025-2030 ($ million)
Data Table on Egypt - Market size and forecast 2025-2030 ($ million)
Chart on Egypt - Year-over-year growth 2025-2030 (%)
Data Table on Egypt - Year-over-year growth 2025-2030 (%)

12.7.5 Israel - Market size and forecast 2025-2030

Chart on Israel - Market size and forecast 2025-2030 ($ million)
Data Table on Israel - Market size and forecast 2025-2030 ($ million)
Chart on Israel - Year-over-year growth 2025-2030 (%)
Data Table on Israel - Year-over-year growth 2025-2030 (%)

12.8 Market opportunity by geography

Market opportunity by geography ($ million)
Data Tables on Market opportunity by geography ($ million)

13. Drivers, Challenges, and Opportunity

13.1 Market drivers

Mainstreaming of IP-based immersive storytelling and transmedia integration
Proliferation of high-fidelity IoT ecosystems and AI-driven crowd management
Evolution of mixed-use resort integration and year-round revenue diversification

13.2 Market challenges

Economic volatility and erosion of discretionary household spending
Labor scarcity and rising complexity of operational maintenance
Environmental instability and pressure for sustainable infrastructure

13.3 Impact of drivers and challenges

Impact of drivers and challenges in 2025 and 2030

13.4 Market opportunities

Integration of generative AI and hyper-personalized guest journeys
Institutionalized sustainability and eco-conscious master planning
Institutionalization of gamified attractions and meta-narrative engagement

14. Competitive Landscape

14.1 Overview

14.2

Overview on criticality of inputs and factors of differentiation

14.3 Landscape disruption

Overview on factors of disruption

14.4 Industry risks

Impact of key risks on business

15. Competitive Analysis

15.1 Companies profiled

Companies covered

15.2 Company ranking index

15.3 Market positioning of companies

Matrix on companies position and classification

15.4 Beto Carrero World

Beto Carrero World - Overview
Beto Carrero World - Product / Service
Beto Carrero World - Key offerings
SWOT

15.5 Comcast Corp.

Comcast Corp. - Overview
Comcast Corp. - Business segments
Comcast Corp. - Key news
Comcast Corp. - Key offerings
Comcast Corp. - Segment focus
SWOT

15.6 Dubai Parks and Resorts

Dubai Parks and Resorts - Overview
Dubai Parks and Resorts - Product / Service
Dubai Parks and Resorts - Key offerings
SWOT

15.7 Efteling BV

Efteling BV - Overview
Efteling BV - Product / Service
Efteling BV - Key offerings
SWOT

15.8 Europa Park GmbH and Co. KG

Europa Park GmbH and Co. KG - Overview
Europa Park GmbH and Co. KG - Product / Service
Europa Park GmbH and Co. KG - Key offerings
SWOT

15.9 Fantawild Holdings Inc.

Fantawild Holdings Inc. - Overview
Fantawild Holdings Inc. - Product / Service
Fantawild Holdings Inc. - Key offerings
SWOT

15.10 Imagicaaworld Entertainment

Imagicaaworld Entertainment - Overview
Imagicaaworld Entertainment - Product / Service
Imagicaaworld Entertainment - Key offerings
SWOT

15.11 Lotte Corp.

Lotte Corp. - Overview
Lotte Corp. - Product / Service
Lotte Corp. - Key offerings
SWOT

15.12 Miral Asset Management LLC

Miral Asset Management LLC - Overview
Miral Asset Management LLC - Product / Service
Miral Asset Management LLC - Key offerings
SWOT

15.13 Ride Entertainment Group

Ride Entertainment Group - Overview
Ride Entertainment Group - Product / Service
Ride Entertainment Group - Key offerings
SWOT

15.14 Six Flags Entertainment Corp.

Six Flags Entertainment Corp. - Overview
Six Flags Entertainment Corp. - Product / Service
Six Flags Entertainment Corp. - Key offerings
SWOT

15.15 The Walt Disney Co.

The Walt Disney Co. - Overview
The Walt Disney Co. - Business segments
The Walt Disney Co. - Key offerings
The Walt Disney Co. - Segment focus
SWOT

15.16 Tivoli AS

Tivoli AS - Overview
Tivoli AS - Business segments
Tivoli AS - Key offerings
Tivoli AS - Segment focus
SWOT

15.17 United Parks and Resorts Inc.

United Parks and Resorts Inc. - Overview
United Parks and Resorts Inc. - Product / Service
United Parks and Resorts Inc. - Key offerings
SWOT

15.18 Wonderla Amusement Park

Wonderla Amusement Park - Overview
Wonderla Amusement Park - Product / Service
Wonderla Amusement Park - Key offerings
SWOT

16. Appendix

16.1 Scope of the report

Market definition
Objectives
Notes and caveats

16.2 Inclusions and exclusions checklist

Inclusions checklist
Exclusions checklist

16.3 Currency conversion rates for US$

16.4 Research methodology

16.5 Data procurement

Information sources

16.6 Data validation

16.7 Validation techniques employed for market sizing

16.8 Data synthesis

16.9 360 degree market analysis

16.10 List of abbreviations

Research Methodology

Technavio presents a detailed picture of the market by way of study, synthesis, and summation of data from multiple sources. The analysts have presented the various facets of the market with a particular focus on identifying the key industry influencers. The data thus presented is comprehensive, reliable, and the result of extensive research, both primary and secondary.

INFORMATION SOURCES

Primary sources

  • Manufacturers and suppliers
  • Channel partners
  • Industry experts
  • Strategic decision makers

Secondary sources

  • Industry journals and periodicals
  • Government data
  • Financial reports of key industry players
  • Historical data
  • Press releases

DATA ANALYSIS

Data Synthesis

  • Collation of data
  • Estimation of key figures
  • Analysis of derived insights

Data Validation

  • Triangulation with data models
  • Reference against proprietary databases
  • Corroboration with industry experts

REPORT WRITING

Qualitative

  • Market drivers
  • Market challenges
  • Market trends
  • Five forces analysis

Quantitative

  • Market size and forecast
  • Market segmentation
  • Geographical insights
  • Competitive landscape

Interested in this report?

Get your sample now to see our research methodology and insights!

Download Now

Frequently Asked Questions

Amusement Park market growth will increase by USD 68298.7 million during 2026-2030.

The Amusement Park market is expected to grow at a CAGR of 12.9% during 2026-2030.

Amusement Park market is segmented by Type (Tickets, Hospitality, Merchandising, Others) Variant (Mechanical rides, Water rides, Others) Age group (19 to 35 years, Up to 18 years, 36 to 50 years, Above 50 years)

Beto Carrero World, Comcast Corp., Dubai Parks and Resorts, Efteling BV, Europa Park GmbH and Co. KG, Fantawild Holdings Inc., Imagicaaworld Entertainment, Lotte Corp., Merlin Entertainments Ltd., Miral Asset Management LLC, Nicco Parks and Resorts Ltd., Parques Reunidos SAU, Puy du Fou France, Ride Entertainment Group, Six Flags Entertainment Corp., The Walt Disney Co., Tivoli AS, United Parks and Resorts Inc., Wonderla Amusement Park are a few of the key vendors in the Amusement Park market.

North America will register the highest growth rate of 35.7% among the other regions. Therefore, the Amusement Park market in North America is expected to garner significant business opportunities for the vendors during the forecast period.

US, Canada, Mexico, China, Japan, India, South Korea, Australia, Indonesia, Germany, UK, France, Spain, Italy, The Netherlands, Brazil, Argentina, Chile, UAE, Saudi Arabia, South Africa, Egypt, Israel

  • Mainstreaming of IP-based immersive storytelling and transmedia integration is the driving factor this market.

The Amusement Park market vendors should focus on grabbing business opportunities from the Type segment as it accounted for the largest market share in the base year.
RIA - Research AI Assistant
Ask RIA