Data Center Mechanical Construction Market Analysis, Size, and Forecast 2025-2029: North America (US and Canada), Europe (France, Germany, Italy, UK), APAC (China, India, Japan), South America (Brazil), and Middle East and Africa

Data Center Mechanical Construction Market Analysis, Size, and Forecast 2025-2029:
North America (US and Canada), Europe (France, Germany, Italy, UK), APAC (China, India, Japan), South America (Brazil), and Middle East and Africa

Published: Apr 2025 233 Pages SKU: IRTNTR73000

Market Overview at a Glance

$22.92 B
Market Opportunity
16.1%
CAGR
13.5
YoY growth 2024-2025(%)

Data Center Mechanical Construction Market Size 2025-2029

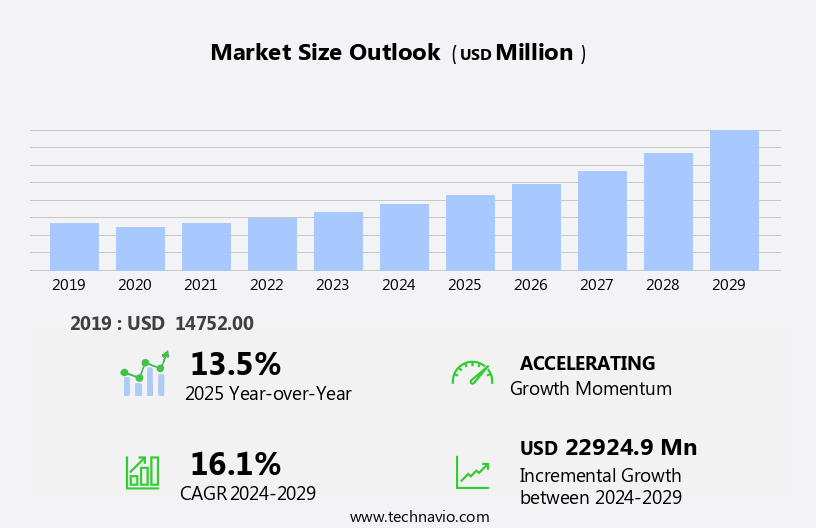
The data center mechanical construction market size is forecast to increase by USD 22.92 billion at a CAGR of 16.1% between 2024 and 2029.

  • The market is experiencing significant growth, driven by the increasing adoption of High Performance Computing (HPC) across enterprises and the subsequent expansion of hyperscale centers. This trend is fueled by the ever-growing demand for data processing and storage, particularly in industries such as finance, healthcare, and technology. However, the market is not without challenges. One of the most pressing issues is the high power consumption in data centers, which necessitates the implementation of energy-efficient solutions and the adoption of renewable energy sources. Additionally, the complexity of construction projects and the need for specialized expertise add to the market's challenges.  
  • One of the primary drivers is the increasing investments in construction, as businesses recognize the importance of digital transformation and the role play in supporting their operations. This trend is driven by the proliferation of edge computing, 5G technology, and digital transformation initiatives. Despite these hurdles, opportunities abound for companies that can navigate the intricacies of mechanical construction and provide innovative, energy-efficient solutions to meet the demands of this rapidly evolving market. By staying abreast of the latest trends and developments, companies can position themselves to capitalize on the significant growth potential in this sector.

What will be the Size of the Data Center Mechanical Construction Market during the forecast period?

Data Center Mechanical Construction Market Size

 Request Free Sample

  • The market is experiencing significant growth and innovation, driven by the increasing demand for more efficient and compliant solutions. Virtualization and consolidation are key trends, leading to the adoption of advanced technologies such as air-side economizers, glycol systems, and liquid cooling. Compliance with regulations, including emergency power and fire alarm systems, is also a major consideration. Data center expansion continues to be a priority, with variable refrigerant flow and chilled water systems gaining popularity for their energy efficiency.
  • Innovations in automation, access control, and CCTV systems are also transforming the market, while direct expansion cooling and transformer banks remain essential components. The integration of free cooling and adiabatic cooling systems is further enhancing energy savings, and circuit breakers ensure reliable power distribution. Overall, the market is dynamic and evolving, with a focus on optimizing energy usage, ensuring compliance, and improving security and efficiency.

How is this Data Center Mechanical Construction Industry segmented?

The industry research report provides comprehensive data (region-wise segment analysis), with forecasts and estimates in "USD million" for the period 2025-2029, as well as historical data from 2019-2023 for the following segments.
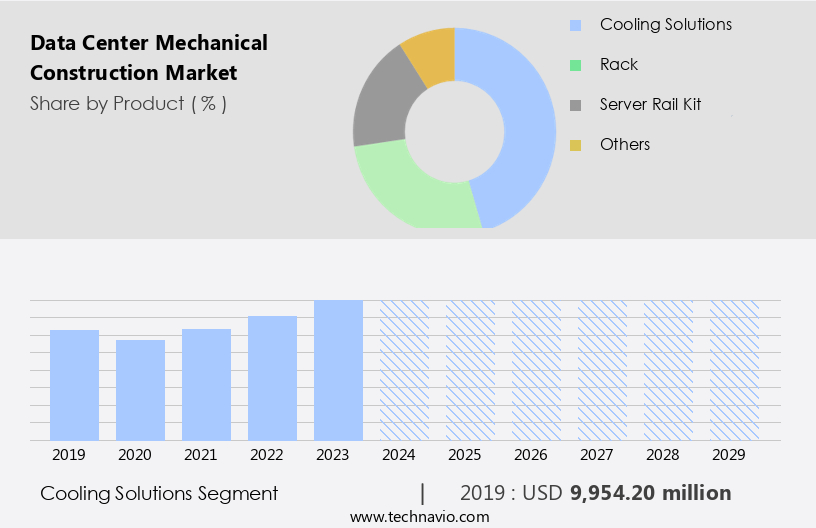
  • Product
    • Cooling solutions
    • Rack
    • Server rail kit
    • Others
  • Type
    • Air-based cooling
    • Liquid-based cooling
    • Hybrid cooling systems
  • Variant
    • Hyperscale data centers
    • Colocation data centers
    • Enterprise data centers
    • Edge data centers
  • Geography
    • North America
      • US
      • Canada
    • Europe
      • France
      • Germany
      • Italy
      • UK
    • APAC
      • China
      • India
      • Japan
    • South America
      • Brazil
    • Middle East and Africa

By Product Insights

The cooling solutions segment is estimated to witness significant growth during the forecast period. Data centers require efficient cooling solutions to manage the heat load generated by their IT equipment. Air-based cooling and liquid-based cooling are two primary cooling techniques used. Air-based cooling, a traditional method, utilizes air as a cooling medium. CRAC units, such as air conditioners, air economizers, air-based chiller units, and air-cooled self-contained systems, are commonly used in data centers for air-based cooling. HVAC systems, including air handling units and airflow management, are integral components of infrastructure that support air-based cooling. Liquid-based cooling, on the other hand, uses water or other liquids as a cooling medium.  Project management, sustainability, energy efficiency, and renewable energy sources are key considerations for these projects

This method is gaining popularity in large-scale, hyperscale centers due to its higher energy efficiency. Precision cooling, which is a type of liquid-based cooling, ensures optimal temperature and humidity levels for IT equipment. Design plays a crucial role in cooling efficiency. Construction management and project management are essential in implementing energy-efficient cooling systems during the planning and building stages. Commissioning and monitoring ensure that cooling systems function optimally. Certifications, such as LEED and Water Usage Effectiveness, encourage the adoption of energy-efficient cooling technologies. ASHRAE standards provide guidelines for cooling systems, ensuring reliability and capacity planning.

Fire suppression and security systems are integral to operations. Upgrades and migrations require careful planning and implementation to minimize downtime and ensure data security. Analytics and building automation facilitate the optimization of cooling systems, reducing energy consumption and improving overall efficiency.

Data Center Mechanical Construction Market Size

Get a glance at the market report of share of various segments Request Free Sample

The Cooling solutions segment was valued at USD 9.95 billion in 2019 and showed a gradual increase during the forecast period.

Regional Analysis

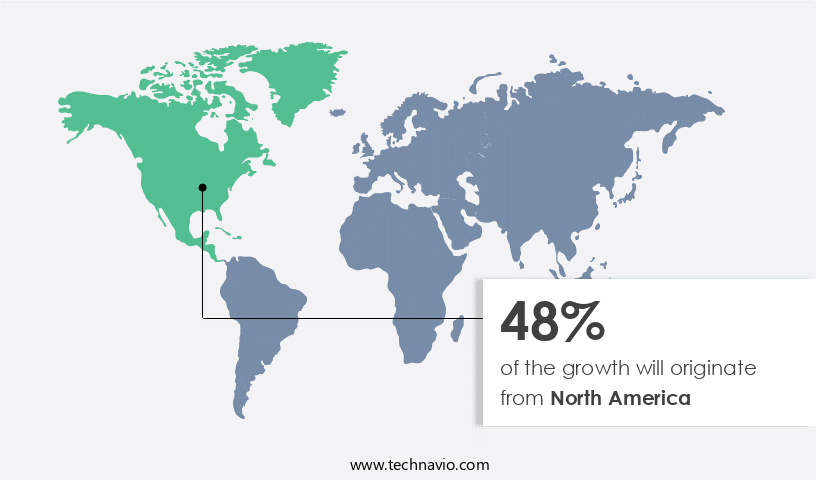
North America is estimated to contribute 48% to the growth of the global market during the forecast period. Technavio's analysts have elaborately explained the regional trends and drivers that shape the market during the forecast period.

Data Center Mechanical Construction Market Share by Geography

For more insights on the market size of various regions, Request Free Sample

In North America, the increase in establishments necessitates substantial investments in IT infrastructure and power and cooling solutions. This trend is driven by the increasing demand for Internet of Things (IoT) devices and the implementation of autonomous technologies across industries. IoT devices, with their high demand in the region due to a well-established communication network infrastructure, require efficient data processing and storage capabilities. Simultaneously, industries are adopting automation technologies to boost operational efficiency, enhance product quality, and minimize manufacturing errors. Moreover, significant investments in Artificial Intelligence (AI) in North America are fueling the development of products capable of processing vast amounts of data and facilitating M2M communication efficiently. The market is experiencing significant growth due to the increasing demand to support digital transformation and the adoption of high-performance computing (HPC) applications.

The energy efficiency is a critical concern, with Power Usage Effectiveness (PUE) and cooling technologies playing pivotal roles. Construction management, commissioning, and monitoring are essential aspects of infrastructure development. Edge computing, mechanical systems integration, and high availability HVAC systems are crucial components of design and operation. Certifications, such as LEED and ASHRAE standards, are increasingly important for sustainability and energy efficiency. Capacity planning, water conservation, and fire suppression systems are essential for optimization and resilience. Data center upgrades, security systems, and analytics are integral to maintaining and enhancing performance.

Critical power systems, UPS systems, and cloud computing are essential elements of electrical infrastructure. Precision cooling, project management, and building automation are vital for efficient operations. Air handling units and airflow management are crucial for maintaining optimal IT load and ensuring high availability. Data center decommissioning and design are essential aspects of data center lifecycle management.

Market Dynamics

Our researchers analyzed the data with 2024 as the base year, along with the key drivers, trends, and challenges. A holistic analysis of drivers will help companies refine their marketing strategies to gain a competitive advantage.

What are the key market drivers leading to the rise in the adoption of Data Center Mechanical Construction Industry?

  • Increased adoption of HPC across enterprises is the key driver of the market. The data traffic growth and the complexities of managing vast data volumes have fueled the intersection of big data and supercomputing. Commercial web applications' expansion, cloud computing advancements, and Human-Machine Interface (HMI) technology development are key factors propelling the High Performance Computing (HPC) market's expansion within the IT sector. Business and consumer applications generate massive amounts of structured and unstructured data, which enterprises store on-premises and in the cloud. These organizations leverage the data to gain insights and make critical operational and managerial decisions. To process this data more efficiently, firms are integrating HPC systems into their IT infrastructure. Traditional computing systems struggle to process such large volumes of data, making HPC integration an attractive solution for faster, more efficient data processing. This innovative design offers significant advantages in terms of flexibility, scalability, and cost-effectiveness. The construction of hyperscale data centers represents a crucial development in the realm of data management and processing. The ability to accommodate large amounts of data and provide efficient, scalable solutions makes these facilities an indispensable asset for businesses in today's data-driven world.

What are the market trends shaping the Data Center Mechanical Construction Industry?

  • Growing investment in hyperscale data centers is the upcoming market trend. Hyperscale data centers are becoming increasingly essential for organizations handling large volumes of data. These data centers feature a design that allows for a single, massive, and scalable computer, composed of interconnected nodes operating as one machine. The growing need to manage escalating data generation has led to a significant increase in the construction of hyperscale data centers. These facilities require extensive storage capabilities and, consequently, numerous racks to integrate servers, storage devices, and network equipment. Hyperscale data centers employ new server designs and wider racks to accommodate an increased number of components. The integration of these advanced technologies results in a more efficient and effective data processing and storage solution. The massive scale of hyperscale data centers necessitates a unique architecture that can cater to the demands of handling vast amounts of data. By clustering small individual servers together, organizations can benefit from the combined processing power and storage capacity of the entire system.

What challenges does the Data Center Mechanical Construction Industry face during its growth?

  • High power consumption in data centers is a key challenge affecting the industry growth. The market is experiencing significant growth due to several factors. Increasing internet penetration and the expanding use of social media are driving up data traffic, necessitating the construction of larger data centers for managing and storing vast amounts of data. Additionally, the rise of blockchain technology, automation technologies, smart city initiatives, and artificial intelligence (AI) implementation across industries are further boosting market growth. However, this growth comes with a substantial energy consumption challenge. Data centers are projected to become the largest global energy consumers by 2030, with the ICT sector accounting for approximately 23% of the world's electricity usage. Within a data center, servers and cooling solutions consume more electricity than any other infrastructure. The market is experiencing significant growth due to the increasing demand for data-intensive applications, cloud computing, and digital services.

Exclusive Customer Landscape

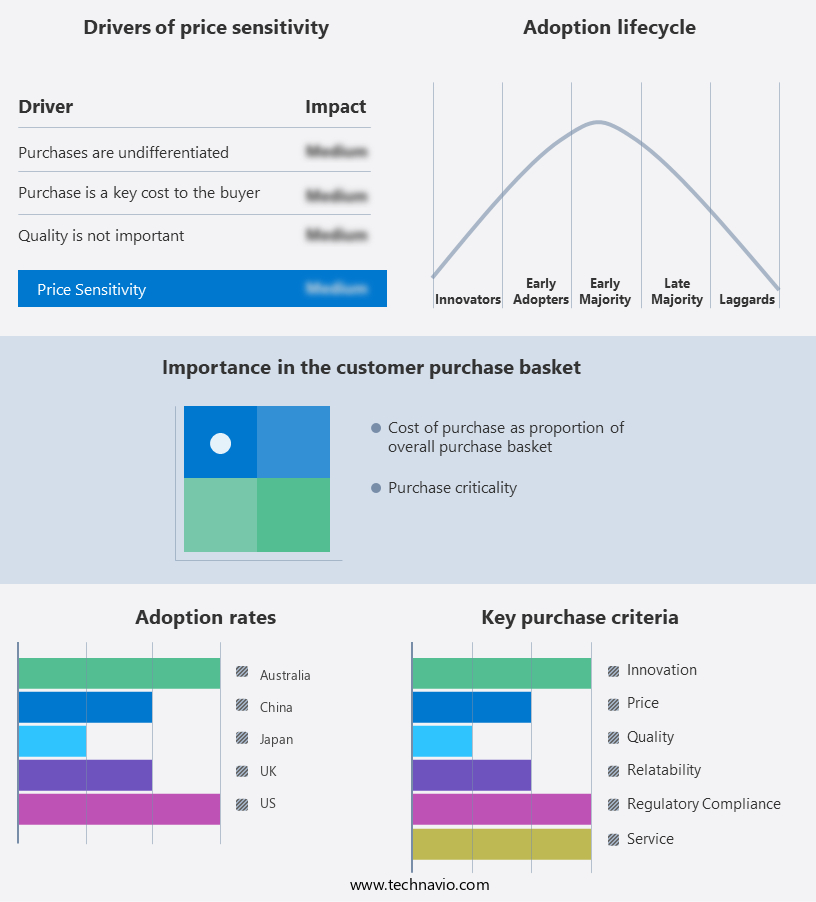
The data center mechanical construction market forecasting report includes the adoption lifecycle of the market, covering from the innovator's stage to the laggard's stage. It focuses on adoption rates in different regions based on penetration. Furthermore, the data center mechanical construction market report also includes key purchase criteria and drivers of price sensitivity to help companies evaluate and develop their market growth analysis strategies.

Data Center Mechanical Construction Market Share by Geography

 Customer Landscape

Key Companies & Market Insights

Companies are implementing various strategies, such as strategic alliances, data center mechanical construction market forecast, partnerships, mergers and acquisitions, geographical expansion, and product/service launches, to enhance their presence in the industry.

ABB Ltd. - The company specializes in constructing data centers, delivering hyperscale infrastructure solutions.

The industry research and growth report includes detailed analyses of the competitive landscape of the market and information about key companies, including:

  • ABB Ltd.
  • Black Box Corp.
  • Chatsworth Products Inc.
  • Dell Technologies Inc.
  • Delta Electronics Inc.
  • Eaton Corp. plc
  • Equinix Inc.
  • Friedhelm Loh Stiftung and Co. KG
  • Green Revolution Cooling Inc.
  • Legrand SA
  • LiquidStack BV
  • Munters Group AB
  • NetRack Enclosures Pvt. Ltd.
  • Nortek Air Solutions LLC
  • Schneider Electric SE
  • STULZ GmbH
  • Submer Technologies SL
  • Vertiv Holdings Co.

Qualitative and quantitative analysis of companies has been conducted to help clients understand the wider business environment as well as the strengths and weaknesses of key industry players. Data is qualitatively analyzed to categorize companies as pure play, category-focused, industry-focused, and diversified; it is quantitatively analyzed to categorize companies as dominant, leading, strong, tentative, and weak.

Research Analyst Overview

The market is experiencing significant growth as businesses prioritize digital transformation and the demand for data processing continues to rise. This sector encompasses various components essential to the efficient and reliable operation of data centers, including thermal management, power usage effectiveness, and mechanical systems integration. Thermal management is a critical aspect of data center design, as managing heat load is crucial to maintaining optimal operating conditions. Power usage effectiveness (PUE) is a widely adopted metric for measuring data center efficiency, with lower PUE values indicating better energy utilization. Data center relocation and the adoption of modular and smart data centers are also driving the need for advanced thermal management solutions. Data centers consume vast amounts of electricity, and cooling systems account for a significant portion of this energy usage.

Construction management plays a pivotal role in the data center infrastructure development process. Proper planning, commissioning, and monitoring are essential to ensuring data center reliability and capacity. Water conservation and optimization are increasingly important considerations, as data centers consume vast amounts of water for cooling purposes. Energy efficiency is a significant focus in the data center industry, with hyperscale data centers leading the charge. Cooling technologies, such as precision cooling and airflow management, are essential for maintaining energy efficiency and reducing heat load. Electrical infrastructure, including critical power systems and uninterruptible power supply (UPS) systems, is another crucial component of data center design.  The expanding adoption of advanced technologies, such as cloud-based services and big data analytics, by communication service providers (CSPs), government agencies, and businesses is driving the demand for data centers.

Data center security, fire suppression, and data center certifications, such as LEED and ASHRAE standards, are essential for ensuring business continuity and regulatory compliance. Capacity planning, data center optimization, and maintenance are ongoing concerns for data center operators, with edge computing and cloud computing adding complexity to the landscape. Data center upgrades and migrations, as well as the integration of building automation and HVAC systems, require careful project management. The role of IT load and high availability in data center operations is increasingly important, with data center analytics and artificial intelligence (AI) playing a growing role in optimizing performance and reducing downtime.

In the data center market, there is a constant focus on improving efficiency, reliability, and sustainability. Mechanical systems integration, including the use of CRAC units and air handling units, is a key area of innovation, with smart technologies and automation driving advancements. Data center design and optimization are ongoing concerns, with a growing emphasis on water usage effectiveness and data center resilience. The data center industry is a dynamic and complex landscape, with ongoing evolution in technology, design, and operations. Effective project management, careful planning, and a focus on energy efficiency, reliability, and sustainability are essential for success in this market.

Market Scope

Report Coverage

Details

Page number

233

Base year

2024

Historic period

2019-2023

Forecast period

2025-2029

Growth momentum & CAGR

Accelerate at a CAGR of 16.1%

Market growth 2025-2029

USD 22.92 billion

Market structure

Fragmented

YoY growth 2024-2025(%)

13.5

Key countries

US, Canada, China, Japan, India, UK, Brazil, Germany, France, and Italy

Competitive landscape

Leading Companies, Market Positioning of Companies, Competitive Strategies, and Industry Risks

Request Free Sample

What are the Key Data Covered in this Data Center Mechanical Construction Market Research and Growth Report?

  • CAGR of the Data Center Mechanical Construction industry during the forecast period
  • Detailed information on factors that will drive the growth and forecasting between 2025 and 2029
  • Precise estimation of the size of the market and its contribution of the industry in focus to the parent market
  • Accurate predictions about upcoming growth and trends and changes in consumer behaviour
  • Growth of the market across North America, Europe, APAC, South America, and Middle East and Africa
  • Thorough analysis of the market's competitive landscape and detailed information about companies
  • Comprehensive analysis of factors that will challenge the data center mechanical construction market growth and forecasting

We can help! Our analysts can customize this data center mechanical construction market research report to meet your requirements.

Get in touch

1 Executive Summary

  • 1.1 Market overview
    • Executive Summary - Chart on Market Overview
    • Executive Summary - Data Table on Market Overview
    • Executive Summary - Chart on Global Market Characteristics
    • Executive Summary - Chart on Market by Geography
    • Executive Summary - Chart on Market Segmentation by Product
    • Executive Summary - Chart on Market Segmentation by Type
    • Executive Summary - Chart on Market Segmentation by Variant
    • Executive Summary - Chart on Incremental Growth
    • Executive Summary - Data Table on Incremental Growth
    • Executive Summary - Chart on Company Market Positioning

2 Technavio Analysis

  • 2.1 Analysis of price sensitivity, lifecycle, customer purchase basket, adoption rates, and purchase criteria
    • Analysis of price sensitivity, lifecycle, customer purchase basket, adoption rates, and purchase criteria
  • 2.2 Criticality of inputs and Factors of differentiation
    • Overview on criticality of inputs and factors of differentiation
  • 2.3 Factors of disruption
    • Overview on factors of disruption
  • 2.4 Impact of drivers and challenges
    • Impact of drivers and challenges in 2024 and 2029

3 Market Landscape

  • 3.1 Market ecosystem
    • Parent Market
    • Data Table on - Parent Market
  • 3.2 Market characteristics
    • Market characteristics analysis
  • 3.3 Value chain analysis
    • Value chain analysis

4 Market Sizing

  • 4.1 Market definition
    • Offerings of companies included in the market definition
  • 4.2 Market segment analysis
    • Market segments
  • 4.3 Market size 2024
    • 4.4 Market outlook: Forecast for 2024-2029
      • Chart on Global - Market size and forecast 2024-2029 ($ million)
      • Data Table on Global - Market size and forecast 2024-2029 ($ million)
      • Chart on Global Market: Year-over-year growth 2024-2029 (%)
      • Data Table on Global Market: Year-over-year growth 2024-2029 (%)

    5 Historic Market Size

    • 5.1 Global Data Center Mechanical Construction Market 2019 - 2023
      • Historic Market Size - Data Table on Global Data Center Mechanical Construction Market 2019 - 2023 ($ million)
    • 5.2 Product segment analysis 2019 - 2023
      • Historic Market Size - Product Segment 2019 - 2023 ($ million)
    • 5.3 Type segment analysis 2019 - 2023
      • Historic Market Size - Type Segment 2019 - 2023 ($ million)
    • 5.4 Variant segment analysis 2019 - 2023
      • Historic Market Size - Variant Segment 2019 - 2023 ($ million)
    • 5.5 Geography segment analysis 2019 - 2023
      • Historic Market Size - Geography Segment 2019 - 2023 ($ million)
    • 5.6 Country segment analysis 2019 - 2023
      • Historic Market Size - Country Segment 2019 - 2023 ($ million)

    6 Qualitative Analysis

    • 6.1 Impact of AI on Global Data Center Mechanical Construction Market

      7 Five Forces Analysis

      • 7.1 Five forces summary
        • Five forces analysis - Comparison between 2024 and 2029
      • 7.2 Bargaining power of buyers
        • Bargaining power of buyers - Impact of key factors 2024 and 2029
      • 7.3 Bargaining power of suppliers
        • Bargaining power of suppliers - Impact of key factors in 2024 and 2029
      • 7.4 Threat of new entrants
        • Threat of new entrants - Impact of key factors in 2024 and 2029
      • 7.5 Threat of substitutes
        • Threat of substitutes - Impact of key factors in 2024 and 2029
      • 7.6 Threat of rivalry
        • Threat of rivalry - Impact of key factors in 2024 and 2029
      • 7.7 Market condition
        • Chart on Market condition - Five forces 2024 and 2029

      8 Market Segmentation by Product

      • 8.1 Market segments
        • Chart on Product - Market share 2024-2029 (%)
        • Data Table on Product - Market share 2024-2029 (%)
      • 8.2 Comparison by Product
        • Chart on Comparison by Product
        • Data Table on Comparison by Product
      • 8.3 Cooling solutions - Market size and forecast 2024-2029
        • Chart on Cooling solutions - Market size and forecast 2024-2029 ($ million)
        • Data Table on Cooling solutions - Market size and forecast 2024-2029 ($ million)
        • Chart on Cooling solutions - Year-over-year growth 2024-2029 (%)
        • Data Table on Cooling solutions - Year-over-year growth 2024-2029 (%)
      • 8.4 Rack - Market size and forecast 2024-2029
        • Chart on Rack - Market size and forecast 2024-2029 ($ million)
        • Data Table on Rack - Market size and forecast 2024-2029 ($ million)
        • Chart on Rack - Year-over-year growth 2024-2029 (%)
        • Data Table on Rack - Year-over-year growth 2024-2029 (%)
      • 8.5 Server rail kit - Market size and forecast 2024-2029
        • Chart on Server rail kit - Market size and forecast 2024-2029 ($ million)
        • Data Table on Server rail kit - Market size and forecast 2024-2029 ($ million)
        • Chart on Server rail kit - Year-over-year growth 2024-2029 (%)
        • Data Table on Server rail kit - Year-over-year growth 2024-2029 (%)
      • 8.6 Others - Market size and forecast 2024-2029
        • Chart on Others - Market size and forecast 2024-2029 ($ million)
        • Data Table on Others - Market size and forecast 2024-2029 ($ million)
        • Chart on Others - Year-over-year growth 2024-2029 (%)
        • Data Table on Others - Year-over-year growth 2024-2029 (%)
      • 8.7 Market opportunity by Product
        • Market opportunity by Product ($ million)
        • Data Table on Market opportunity by Product ($ million)

      9 Market Segmentation by Type

      • 9.1 Market segments
        • Chart on Type - Market share 2024-2029 (%)
        • Data Table on Type - Market share 2024-2029 (%)
      • 9.2 Comparison by Type
        • Chart on Comparison by Type
        • Data Table on Comparison by Type
      • 9.3 Air-based cooling - Market size and forecast 2024-2029
        • Chart on Air-based cooling - Market size and forecast 2024-2029 ($ million)
        • Data Table on Air-based cooling - Market size and forecast 2024-2029 ($ million)
        • Chart on Air-based cooling - Year-over-year growth 2024-2029 (%)
        • Data Table on Air-based cooling - Year-over-year growth 2024-2029 (%)
      • 9.4 Liquid-based cooling - Market size and forecast 2024-2029
        • Chart on Liquid-based cooling - Market size and forecast 2024-2029 ($ million)
        • Data Table on Liquid-based cooling - Market size and forecast 2024-2029 ($ million)
        • Chart on Liquid-based cooling - Year-over-year growth 2024-2029 (%)
        • Data Table on Liquid-based cooling - Year-over-year growth 2024-2029 (%)
      • 9.5 Hybrid cooling systems - Market size and forecast 2024-2029
        • Chart on Hybrid cooling systems - Market size and forecast 2024-2029 ($ million)
        • Data Table on Hybrid cooling systems - Market size and forecast 2024-2029 ($ million)
        • Chart on Hybrid cooling systems - Year-over-year growth 2024-2029 (%)
        • Data Table on Hybrid cooling systems - Year-over-year growth 2024-2029 (%)
      • 9.6 Market opportunity by Type
        • Market opportunity by Type ($ million)
        • Data Table on Market opportunity by Type ($ million)

      10 Market Segmentation by Variant

      • 10.1 Market segments
        • Chart on Variant - Market share 2024-2029 (%)
        • Data Table on Variant - Market share 2024-2029 (%)
      • 10.2 Comparison by Variant
        • Chart on Comparison by Variant
        • Data Table on Comparison by Variant
      • 10.3 Hyperscale data centers - Market size and forecast 2024-2029
        • Chart on Hyperscale data centers - Market size and forecast 2024-2029 ($ million)
        • Data Table on Hyperscale data centers - Market size and forecast 2024-2029 ($ million)
        • Chart on Hyperscale data centers - Year-over-year growth 2024-2029 (%)
        • Data Table on Hyperscale data centers - Year-over-year growth 2024-2029 (%)
      • 10.4 Colocation data centers - Market size and forecast 2024-2029
        • Chart on Colocation data centers - Market size and forecast 2024-2029 ($ million)
        • Data Table on Colocation data centers - Market size and forecast 2024-2029 ($ million)
        • Chart on Colocation data centers - Year-over-year growth 2024-2029 (%)
        • Data Table on Colocation data centers - Year-over-year growth 2024-2029 (%)
      • 10.5 Enterprise data centers - Market size and forecast 2024-2029
        • Chart on Enterprise data centers - Market size and forecast 2024-2029 ($ million)
        • Data Table on Enterprise data centers - Market size and forecast 2024-2029 ($ million)
        • Chart on Enterprise data centers - Year-over-year growth 2024-2029 (%)
        • Data Table on Enterprise data centers - Year-over-year growth 2024-2029 (%)
      • 10.6 Edge data centers - Market size and forecast 2024-2029
        • Chart on Edge data centers - Market size and forecast 2024-2029 ($ million)
        • Data Table on Edge data centers - Market size and forecast 2024-2029 ($ million)
        • Chart on Edge data centers - Year-over-year growth 2024-2029 (%)
        • Data Table on Edge data centers - Year-over-year growth 2024-2029 (%)
      • 10.7 Market opportunity by Variant
        • Market opportunity by Variant ($ million)
        • Data Table on Market opportunity by Variant ($ million)

      11 Customer Landscape

      • 11.1 Customer landscape overview
        • Analysis of price sensitivity, lifecycle, customer purchase basket, adoption rates, and purchase criteria

      12 Geographic Landscape

      • 12.1 Geographic segmentation
        • Chart on Market share by geography 2024-2029 (%)
        • Data Table on Market share by geography 2024-2029 (%)
      • 12.2 Geographic comparison
        • Chart on Geographic comparison
        • Data Table on Geographic comparison
      • 12.3 North America - Market size and forecast 2024-2029
        • Chart on North America - Market size and forecast 2024-2029 ($ million)
        • Data Table on North America - Market size and forecast 2024-2029 ($ million)
        • Chart on North America - Year-over-year growth 2024-2029 (%)
        • Data Table on North America - Year-over-year growth 2024-2029 (%)
      • 12.4 Europe - Market size and forecast 2024-2029
        • Chart on Europe - Market size and forecast 2024-2029 ($ million)
        • Data Table on Europe - Market size and forecast 2024-2029 ($ million)
        • Chart on Europe - Year-over-year growth 2024-2029 (%)
        • Data Table on Europe - Year-over-year growth 2024-2029 (%)
      • 12.5 APAC - Market size and forecast 2024-2029
        • Chart on APAC - Market size and forecast 2024-2029 ($ million)
        • Data Table on APAC - Market size and forecast 2024-2029 ($ million)
        • Chart on APAC - Year-over-year growth 2024-2029 (%)
        • Data Table on APAC - Year-over-year growth 2024-2029 (%)
      • 12.6 South America - Market size and forecast 2024-2029
        • Chart on South America - Market size and forecast 2024-2029 ($ million)
        • Data Table on South America - Market size and forecast 2024-2029 ($ million)
        • Chart on South America - Year-over-year growth 2024-2029 (%)
        • Data Table on South America - Year-over-year growth 2024-2029 (%)
      • 12.7 Middle East and Africa - Market size and forecast 2024-2029
        • Chart on Middle East and Africa - Market size and forecast 2024-2029 ($ million)
        • Data Table on Middle East and Africa - Market size and forecast 2024-2029 ($ million)
        • Chart on Middle East and Africa - Year-over-year growth 2024-2029 (%)
        • Data Table on Middle East and Africa - Year-over-year growth 2024-2029 (%)
      • 12.8 US - Market size and forecast 2024-2029
        • Chart on US - Market size and forecast 2024-2029 ($ million)
        • Data Table on US - Market size and forecast 2024-2029 ($ million)
        • Chart on US - Year-over-year growth 2024-2029 (%)
        • Data Table on US - Year-over-year growth 2024-2029 (%)
      • 12.9 Canada - Market size and forecast 2024-2029
        • Chart on Canada - Market size and forecast 2024-2029 ($ million)
        • Data Table on Canada - Market size and forecast 2024-2029 ($ million)
        • Chart on Canada - Year-over-year growth 2024-2029 (%)
        • Data Table on Canada - Year-over-year growth 2024-2029 (%)
      • 12.10 China - Market size and forecast 2024-2029
        • Chart on China - Market size and forecast 2024-2029 ($ million)
        • Data Table on China - Market size and forecast 2024-2029 ($ million)
        • Chart on China - Year-over-year growth 2024-2029 (%)
        • Data Table on China - Year-over-year growth 2024-2029 (%)
      • 12.11 UK - Market size and forecast 2024-2029
        • Chart on UK - Market size and forecast 2024-2029 ($ million)
        • Data Table on UK - Market size and forecast 2024-2029 ($ million)
        • Chart on UK - Year-over-year growth 2024-2029 (%)
        • Data Table on UK - Year-over-year growth 2024-2029 (%)
      • 12.12 Japan - Market size and forecast 2024-2029
        • Chart on Japan - Market size and forecast 2024-2029 ($ million)
        • Data Table on Japan - Market size and forecast 2024-2029 ($ million)
        • Chart on Japan - Year-over-year growth 2024-2029 (%)
        • Data Table on Japan - Year-over-year growth 2024-2029 (%)
      • 12.13 Germany - Market size and forecast 2024-2029
        • Chart on Germany - Market size and forecast 2024-2029 ($ million)
        • Data Table on Germany - Market size and forecast 2024-2029 ($ million)
        • Chart on Germany - Year-over-year growth 2024-2029 (%)
        • Data Table on Germany - Year-over-year growth 2024-2029 (%)
      • 12.14 India - Market size and forecast 2024-2029
        • Chart on India - Market size and forecast 2024-2029 ($ million)
        • Data Table on India - Market size and forecast 2024-2029 ($ million)
        • Chart on India - Year-over-year growth 2024-2029 (%)
        • Data Table on India - Year-over-year growth 2024-2029 (%)
      • 12.15 France - Market size and forecast 2024-2029
        • Chart on France - Market size and forecast 2024-2029 ($ million)
        • Data Table on France - Market size and forecast 2024-2029 ($ million)
        • Chart on France - Year-over-year growth 2024-2029 (%)
        • Data Table on France - Year-over-year growth 2024-2029 (%)
      • 12.16 Italy - Market size and forecast 2024-2029
        • Chart on Italy - Market size and forecast 2024-2029 ($ million)
        • Data Table on Italy - Market size and forecast 2024-2029 ($ million)
        • Chart on Italy - Year-over-year growth 2024-2029 (%)
        • Data Table on Italy - Year-over-year growth 2024-2029 (%)
      • 12.17 Brazil - Market size and forecast 2024-2029
        • Chart on Brazil - Market size and forecast 2024-2029 ($ million)
        • Data Table on Brazil - Market size and forecast 2024-2029 ($ million)
        • Chart on Brazil - Year-over-year growth 2024-2029 (%)
        • Data Table on Brazil - Year-over-year growth 2024-2029 (%)
      • 12.18 Market opportunity by geography
        • Market opportunity by geography ($ million)
        • Data Tables on Market opportunity by geography ($ million)

      13 Drivers, Challenges, and Opportunity/Restraints

      • 13.1 Market drivers
        • 13.2 Market challenges
          • 13.3 Impact of drivers and challenges
            • Impact of drivers and challenges in 2024 and 2029
          • 13.4 Market opportunities/restraints

            14 Competitive Landscape

            • 14.1 Overview
              • 14.2 Competitive Landscape
                • Overview on criticality of inputs and factors of differentiation
              • 14.3 Landscape disruption
                • Overview on factors of disruption
              • 14.4 Industry risks
                • Impact of key risks on business

              15 Competitive Analysis

              • 15.1 Companies profiled
                • Companies covered
              • 15.2 Company ranking index
                • Company ranking index
              • 15.3 Market positioning of companies
                • Matrix on companies position and classification
              • 15.4 Black Box Corp.
                • Black Box Corp. - Overview
                • Black Box Corp. - Product / Service
                • Black Box Corp. - Key offerings
                • SWOT
              • 15.5 Chatsworth Products Inc.
                • Chatsworth Products Inc. - Overview
                • Chatsworth Products Inc. - Product / Service
                • Chatsworth Products Inc. - Key offerings
                • SWOT
              • 15.6 Dell Technologies Inc.
                • Dell Technologies Inc. - Overview
                • Dell Technologies Inc. - Business segments
                • Dell Technologies Inc. - Key news
                • Dell Technologies Inc. - Key offerings
                • Dell Technologies Inc. - Segment focus
                • SWOT
              • 15.7 Delta Electronics Inc.
                • Delta Electronics Inc. - Overview
                • Delta Electronics Inc. - Product / Service
                • Delta Electronics Inc. - Key offerings
                • SWOT
              • 15.8 Eaton Corp. plc
                • Eaton Corp. plc - Overview
                • Eaton Corp. plc - Business segments
                • Eaton Corp. plc - Key news
                • Eaton Corp. plc - Key offerings
                • Eaton Corp. plc - Segment focus
                • SWOT
              • 15.9 Friedhelm Loh Stiftung and Co. KG
                • Friedhelm Loh Stiftung and Co. KG - Overview
                • Friedhelm Loh Stiftung and Co. KG - Product / Service
                • Friedhelm Loh Stiftung and Co. KG - Key offerings
                • SWOT
              • 15.10 Green Revolution Cooling Inc.
                • Green Revolution Cooling Inc. - Overview
                • Green Revolution Cooling Inc. - Product / Service
                • Green Revolution Cooling Inc. - Key offerings
                • SWOT
              • 15.11 Legrand SA
                • Legrand SA - Overview
                • Legrand SA - Business segments
                • Legrand SA - Key news
                • Legrand SA - Key offerings
                • Legrand SA - Segment focus
                • SWOT
              • 15.12 LiquidStack BV
                • LiquidStack BV - Overview
                • LiquidStack BV - Product / Service
                • LiquidStack BV - Key offerings
                • SWOT
              • 15.13 NetRack Enclosures Pvt. Ltd.
                • NetRack Enclosures Pvt. Ltd. - Overview
                • NetRack Enclosures Pvt. Ltd. - Product / Service
                • NetRack Enclosures Pvt. Ltd. - Key offerings
                • SWOT
              • 15.14 Nortek Air Solutions LLC
                • Nortek Air Solutions LLC - Overview
                • Nortek Air Solutions LLC - Product / Service
                • Nortek Air Solutions LLC - Key offerings
                • SWOT
              • 15.15 Schneider Electric SE
                • Schneider Electric SE - Overview
                • Schneider Electric SE - Business segments
                • Schneider Electric SE - Key news
                • Schneider Electric SE - Key offerings
                • Schneider Electric SE - Segment focus
                • SWOT
              • 15.16 STULZ GmbH
                • STULZ GmbH - Overview
                • STULZ GmbH - Product / Service
                • STULZ GmbH - Key offerings
                • SWOT
              • 15.17 Submer Technologies SL
                • Submer Technologies SL - Overview
                • Submer Technologies SL - Product / Service
                • Submer Technologies SL - Key offerings
                • SWOT
              • 15.18 Vertiv Holdings Co.
                • Vertiv Holdings Co. - Overview
                • Vertiv Holdings Co. - Business segments
                • Vertiv Holdings Co. - Key offerings
                • Vertiv Holdings Co. - Segment focus
                • SWOT

              16 Appendix

              • 16.1 Scope of the report
                • 16.2 Inclusions and exclusions checklist
                  • Inclusions checklist
                  • Exclusions checklist
                • 16.3 Currency conversion rates for US$
                  • Currency conversion rates for US$
                • 16.4 Research methodology
                  • Research methodology
                • 16.5 Data procurement
                  • Information sources
                • 16.6 Data validation
                  • Data validation
                • 16.7 Validation techniques employed for market sizing
                  • Validation techniques employed for market sizing
                • 16.8 Data synthesis
                  • Data synthesis
                • 16.9 360 degree market analysis
                  • 360 degree market analysis
                • 16.10 List of abbreviations
                  • List of abbreviations

                Research Methodology

                Technavio presents a detailed picture of the market by way of study, synthesis, and summation of data from multiple sources. The analysts have presented the various facets of the market with a particular focus on identifying the key industry influencers. The data thus presented is comprehensive, reliable, and the result of extensive research, both primary and secondary.

                INFORMATION SOURCES

                Primary sources

                • Manufacturers and suppliers
                • Channel partners
                • Industry experts
                • Strategic decision makers

                Secondary sources

                • Industry journals and periodicals
                • Government data
                • Financial reports of key industry players
                • Historical data
                • Press releases

                DATA ANALYSIS

                Data Synthesis

                • Collation of data
                • Estimation of key figures
                • Analysis of derived insights

                Data Validation

                • Triangulation with data models
                • Reference against proprietary databases
                • Corroboration with industry experts

                REPORT WRITING

                Qualitative

                • Market drivers
                • Market challenges
                • Market trends
                • Five forces analysis

                Quantitative

                • Market size and forecast
                • Market segmentation
                • Geographical insights
                • Competitive landscape

                Interested in this report?

                Get your sample now to see our research methodology and insights!

                Download Now

                Frequently Asked Questions

                Data Center Mechanical Construction market growth will increase by $ 22924.9 mn during 2025-2029.

                The Data Center Mechanical Construction market is expected to grow at a CAGR of 16.1% during 2025-2029.

                Data Center Mechanical Construction market is segmented by Product( Cooling solutions, Rack, Server rail kit, Others) Type( Air-based cooling, Liquid-based cooling, Hybrid cooling systems, South America, Middle East and Africa) Variant( Hyperscale data centers, Colocation data centers, Enterprise data centers, Edge data centers)

                ABB Ltd., Black Box Corp., Chatsworth Products Inc., Dell Technologies Inc., Delta Electronics Inc., Eaton Corp. plc, Equinix Inc., Friedhelm Loh Stiftung and Co. KG, Green Revolution Cooling Inc., Legrand SA, LiquidStack BV, Munters Group AB, NetRack Enclosures Pvt. Ltd., Nortek Air Solutions LLC, Schneider Electric SE, STULZ GmbH, Submer Technologies SL, Vertiv Holdings Co. are a few of the key vendors in the Data Center Mechanical Construction market.

                North America will register the highest growth rate of 48% among the other regions. Therefore, the Data Center Mechanical Construction market in North America is expected to garner significant business opportunities for the vendors during the forecast period.

                US, Canada, China, Japan, India, UK, Brazil, Germany, France, Italy

                • Increased adoption of HPC across enterprisesThe exponential growth in data traffic and the growing complexity of managing enormous amounts of data has led to the convergence of big data with supercomputing. Increased growth of commercial web applications is the driving factor this market.
                • advances in cloud computing is the driving factor this market.
                • and development of HMI technologies and solutions are driving the adoption of HPC across the IT sector. Business and consumer-based applications generate huge amounts of structured and unstructured data is the driving factor this market.
                • which are stored on-premises and cloud. Enterprises use the data to derive insights and make crucial operational and managerial decisions. They are increasingly adopting HPC systems due to the huge volume of data. The use of classical computing systems to process this data is a time-consuming task; therefore is the driving factor this market.
                • firms are using integrating HPC for their IT infrastructure to process the data much faster is the driving factor this market.
                • much quicker is the driving factor this market.
                • and with higher efficiency. China has the world fastest supercomputer Sunway TaihuLight is the driving factor this market.
                • which is the world number one fastest supercomputer. Developed by the country National Research Center of Parallel Computer Engineering and Technology is the driving factor this market.
                • Sunway TaihuLight uses a total of 40 is the driving factor this market.
                • 940 Chinese RISC processors based on the Sunway architecture. Each processor has 256 processing cores for system management. In addition is the driving factor this market.
                • the world second-largest supercomputer Tianhe-2 (Milky Way-2) is the driving factor this market.
                • is also from China. It was developed by China National University of Defense Technology.Thus is the driving factor this market.
                • a supercomputer is used to streamline a business process is the driving factor this market.
                • which includes the elimination of unnecessary steps. One of the most important abilities of supercomputing systems is their processing speed. With increasing data speed is the driving factor this market.
                • businesses can obtain information faster is the driving factor this market.
                • deliver the results to clients is the driving factor this market.
                • and gain a competitive edge over other firms. This also results in increased revenue for the businesses. Therefore is the driving factor this market.
                • enterprises are setting up HPC data centers across the world that can process data at a faster speed. Service providers are offering cloud-based HPC as a service due to the high initial costs involved in installing HPC systems. Thus is the driving factor this market.
                • growing investments in HPC data centers will increase the efficiency in number crunching and data analytics is the driving factor this market.
                • which allows IT professionals to use the information to identify gaps and deliver results. Also is the driving factor this market.
                • the increase in the adoption of high-performance data centers requires a greater number of high-availability servers and networking devices. A high-availability server is a group of systems that support server applications utilizing a minimum amount of downtime or with no downtime. The increasing number of servers and networking devices will increase the adoption of network rack and server rack. Thus is the driving factor this market.
                • the global data center mechanical construction market is expected to grow during the forecast period. is the driving factor this market.

                The Data Center Mechanical Construction market vendors should focus on grabbing business opportunities from the Cooling solutions segment as it accounted for the largest market share in the base year.
                RIA - Research AI Assistant
                Ask RIA