Renewable Electricity Generation Market Analysis APAC, Europe, North America, South America, Middle East and Africa - China, US, India, Germany, Japan, Canada, Italy, UK, Mexico, South Korea - Size and Forecast 2024-2028

Renewable Electricity Generation Market Analysis APAC, Europe, North America, South America, Middle East and Africa - China, US, India, Germany, Japan, Canada, Italy, UK, Mexico, South Korea - Size and Forecast 2024-2028

Published: Sep 2024 218 Pages SKU: IRTNTR80199

Market Overview at a Glance

$215.77 B
Market Opportunity
11.5%
CAGR
11.2
YoY growth 2023-2024(%)

Renewable Electricity Generation Market Size 2024-2028 

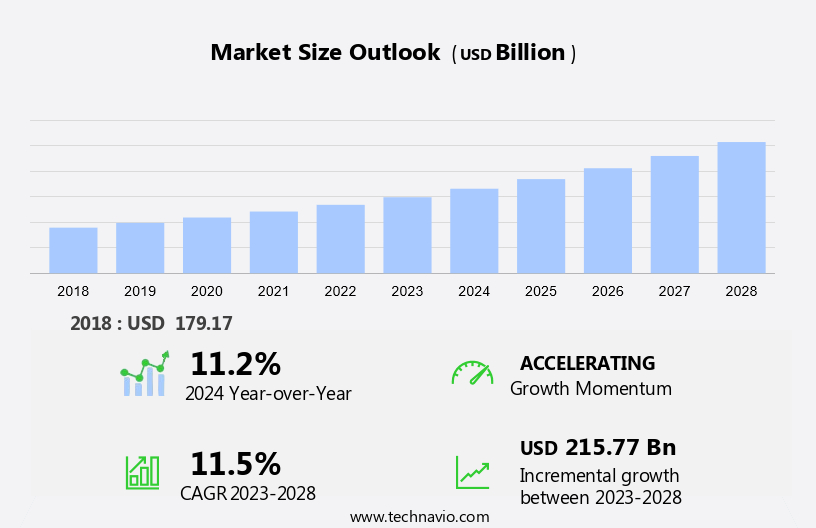
The renewable electricity generation market size is forecast to increase by USD 215.77 billion at a CAGR of 11.5% between 2023 and 2028. The market is experiencing significant growth, driven by various factors. One key trend is the implementation of tax incentives for renewable electricity generation projects, which provide financial incentives for businesses and individuals to invest in resources. Another trend is the integration of renewable energy and storage technologies, enabling the storage of excess energy for use during peak demand periods. However, the high initial cost of infrastructure and technology remains a significant challenge for market growth. Despite this, the market is expected to continue expanding due to increasing global awareness of the need to reduce greenhouse gas emissions and transition to cleaner energy sources.

What will be the Size of the Market During the Forecast Period?

Renewable Electricity Generation Market Size

 Request Free Sample

The market is witnessing significant growth due to the increasing demand for clean energy sources and the need to reduce reliance on traditional fossil fuels such as coal, oil, and natural gas. Renewable energy sources, including sunlight, wind, rain, tides, waves, geothermal heat, and biomass feedstock, are becoming increasingly popular as they produce little to no greenhouse gas (GHG) emissions during energy generation. Fossil fuel-based power generation, particularly coal-based power, is facing increasing scrutiny due to its environmental impact and the associated emissions. Renewable power sources, on the other hand, offer a more sustainable and eco-friendly alternative.

Additionally, the shift towards renewable energy is being driven by various factors, including rising electricity distribution costs, power outages, and stringent emissions regulations. Hydropower systems have been a traditional source of renewable electricity, but solar power generation and wind energy are gaining significant traction. Solar energy is becoming increasingly cost-effective and efficient, making it an attractive option for energy self-sufficiency in both residential and commercial applications. Wind energy is also becoming more competitive with traditional power sources, with advancements in technology leading to increased efficiency and lower costs. The renewable energy industry is also contributing to flood control efforts in various regions by harnessing the power of hydropower systems.

Also, the demand for renewable energy is expected to continue growing as the world transitions towards a low-carbon economy. The market is expected to experience steady growth in the coming years. Solar energy and wind energy are expected to lead the way, with geothermal heat and biomass feedstock also contributing significantly. The market is expected to face challenges, including the intermittency of renewable energy sources and the need for energy storage solutions. However, advancements in technology and government support are expected to mitigate these challenges and drive growth in the market. In conclusion, the market is an exciting and dynamic space, driven by the need for clean energy sources and the desire to reduce reliance on traditional fossil fuels.

Moreover, renewable energy sources, including solar, wind, and hydropower, are expected to continue leading the way in the market, with geothermal heat and biomass feedstock also making significant contributions. The challenges facing the market, including intermittency and energy storage, are being addressed through technological advancements and government support, making the future of renewable electricity generation bright.

Market Segmentation

The market research report provides comprehensive data (region-wise segment analysis), with forecasts and estimates in "USD billion" for the period 2024-2028, as well as historical data from 2018-2022 for the following segments.

  • Type
    • Solar
    • Wind
    • Hydropower
    • Biomass
    • Others
  • End-user
    • Residential
    • Industrial
    • Commercial
  • Geography
    • APAC
      • China
      • India
      • Japan
      • South Korea
    • Europe
      • Germany
      • UK
      • Italy
    • North America
      • Canada
      • Mexico
      • US
    • South America
    • Middle East and Africa

By Type Insights

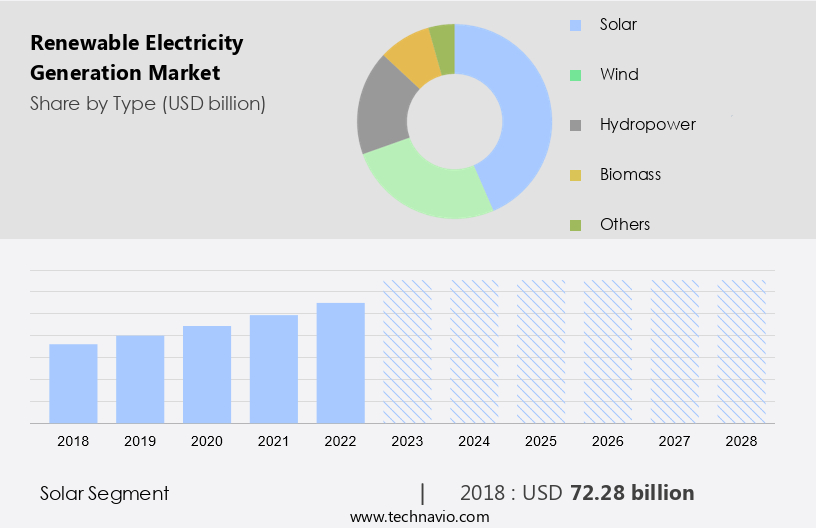
The solar segment is estimated to witness significant growth during the forecast period. The market is experiencing substantial expansion, with solar power leading the charge. Solar energy projects are gaining traction to meet the escalating demand for eco-friendly and sustainable power sources. An illustrative instance is the Green River Energy Center in Utah's east, which merges solar generation with energy storage. This expansive project boasts a 400 MW solar photovoltaic capacity and a 1,600 MWh battery storage system. Hybrid projects like this one are paving the way in the industry, ensuring a steady electricity supply by offsetting production fluctuations. The fusion of solar power with energy storage systems is essential for maintaining a consistent electricity output, which is a primary challenge for renewable energy sources.

Solar PV systems and biogas plants are among the alternative energy sources that are increasingly being adopted for industrial and commercial applications. Hydropower remains a significant contributor to renewable electricity generation. As the world shifts towards cleaner energy sources, the demand for low-cost electricity from renewable sources is on the rise. 

Renewable Electricity Generation Market Size

Get a glance at the market share of various segments Request Free Sample

The solar segment accounted for USD 72.28 billion in 2018 and showed a gradual increase during the forecast period.

Regional Insights

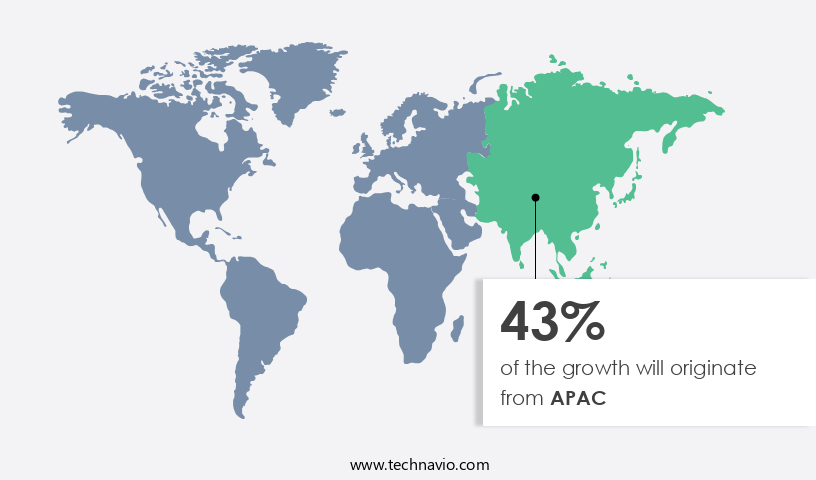
APAC is estimated to contribute 43% to the growth of the global market during the forecast period. Technavio's analysts have elaborately explained the regional trends and drivers that shape the market during the forecast period.

Renewable Electricity Generation Market Share by Geography

For more insights on the market share of various regions Request Free Sample

The Asia Pacific (APAC) region is leading the global shift towards renewable electricity generation, fueled by ambitious national goals and substantial investments in renewable energy infrastructure. Major economies, including Japan, China, India, and Australia, are driving this growth. Japan is at the vanguard of this transition, aiming to increase renewable energy's share in its electricity production to 80% by fiscal year 2035. This goal is bolstered by the expansion of battery storage capacity and strengthened collaboration between regional power grids. In 2022, renewable energy accounted for 22% of Japan's power generation, and the country intends to eliminate nuclear and coal power usage entirely.

Additionally, renewable energy sources, such as sunlight, wind, rain, tides, waves, and geothermal heat, are increasingly replacing fossil fuels, like coal and oil, due to their environmental benefits and decreasing production costs. This trend is expected to continue, making the APAC region a significant player in the global renewable electricity market.

Our researchers analyzed the data with 2023 as the base year, along with the key drivers, trends, and challenges. A holistic analysis of drivers will help companies refine their marketing strategies to gain a competitive advantage.

Market Driver

Tax incentives for renewable electricity generation projects is the key driver of the market. Tax incentives play a pivotal role in fostering the expansion of the wind power sector by making renewable energy projects more financially allureing for investors. These incentives lower the overall cost of capital investment, thereby improving the economic feasibility of wind power projects. For instance, the introduction of a renewable energy investment tax credit (ITC) in the 2023 Canadian federal budget significantly boosts the appeal of Canada as a prime destination for renewable energy investments worldwide. This ITC grants a 30% tax deduction for investments in renewable technologies until 2034. Being a refundable incentive, it directly reduces the tax liability of renewable energy projects, thereby augmenting their net present value (NPV).

Additionally, the shift towards a low-carbon economy, fueled by climate change concerns and dwindling fossil fuel reserves, has intensified the demand for renewable electricity generation. Smart grids, energy efficiency, electric vehicles (EVs), and vehicle-to-grid (V2G) technologies are key components of this transition. The US government's commitment to reducing greenhouse gas emissions and promoting energy security further bolsters the growth prospects of the market.

Market Trends

Integration of renewable energy and storage is the upcoming trend in the market. The renewable electricity generation sector is witnessing a significant shift towards integrating renewable energy plants with advanced storage solutions. This trend is crucial for addressing the intermittency challenges posed by renewable power sources like solar and wind.

For instance, the Green River Energy Center in Utah, spearheaded by Plus Energies, is a prime example of this trend. This project comprises a 400 MW solar power generation system coupled with a 1,600 MWh battery storage system. This integration ensures a consistent electricity supply by balancing production fluctuations. This approach is essential for ensuring energy self-sufficiency and reducing dependence on gas-based power and coal-based power generation. Moreover, it significantly decreases electricity distribution costs and power outages, making it a preferred choice for businesses and consumers alike.

Market Challenge

High initial cost of infrastructure and technology is a key challenge affecting the market growth. Renewable electricity generation through sources such as hydroelectric power, wind power, bioenergy, solar energy, and geothermal energy continues to gain traction as countries strive to meet their renewable energy targets. However, the high initial costs associated with these energy sources pose a significant challenge. For instance, geothermal and ocean energy projects require substantial capital investment due to the complex infrastructure and technology required. Marine energy projects, including tidal and wave energy systems, face similar challenges due to the need for specialized engineering solutions and deep-sea infrastructure. Ocean Thermal Energy Conversion (OTEC) technology, in particular, demands costly equipment and infrastructure development.

Additionally, these high upfront costs create a significant financial barrier, hindering the growth and expansion of these renewable energy sectors. Feed-in tariffs and emissions intensity regulations have been implemented to incentivize the adoption of renewable energy sources. However, the initial investment required for these projects remains a significant hurdle. Biomass feedstock, an essential component of bioenergy generation, also faces challenges related to availability and cost. Addressing these financial barriers through innovative financing mechanisms and technological advancements is crucial to accelerating the growth of the market.

Exclusive Customer Landscape

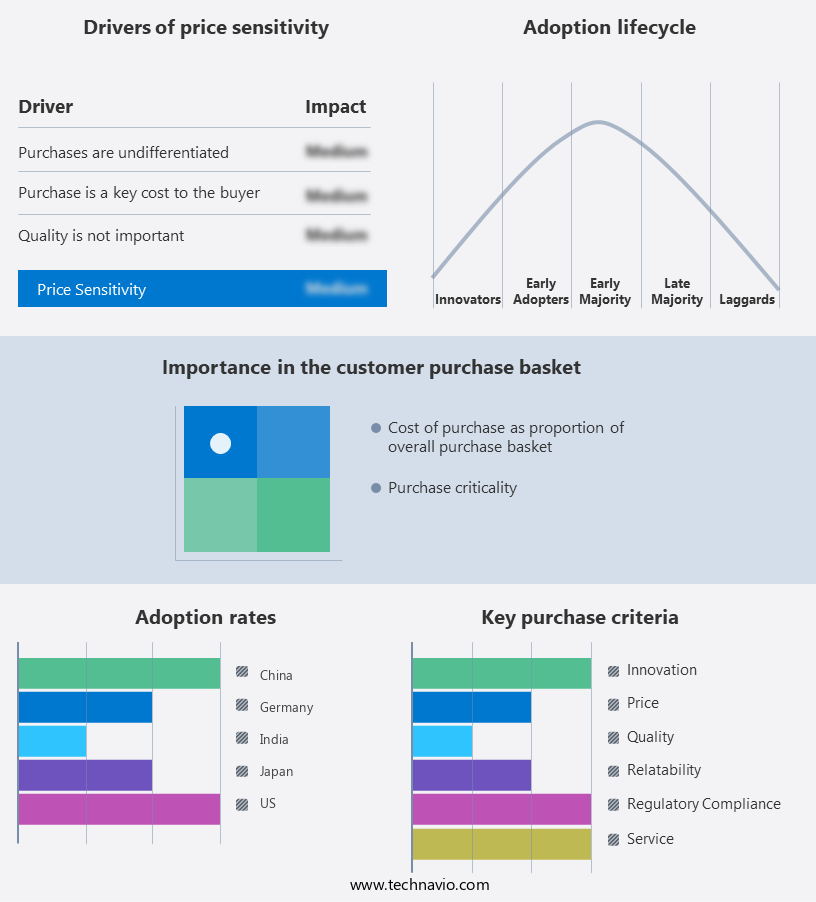
The market forecasting report includes the adoption lifecycle of the market, covering from the innovator's stage to the laggard's stage. It focuses on adoption rates in different regions based on penetration. Furthermore, the report also includes key purchase criteria and drivers of price sensitivity to help companies evaluate and develop their market growth analysis strategies.

Renewable Electricity Generation Market Share by Geography

 Customer Landscape

Key Companies & Market Insights

Companies are implementing various strategies, such as strategic alliances, partnerships, mergers and acquisitions, geographical expansion, and product/service launches, to enhance their presence in the market.

Acciona SA - The company offers renewable electricity solutions to corporations, businesses, and organizations that are intended to minimize carbon footprints and optimize energy use.

The market research and growth report includes detailed analyses of the competitive landscape of the market and information about key companies, including:

  • Adani Green Energy Ltd.
  • BP Plc
  • Brookfield Business Partners LP
  • Canadian Solar Inc.
  • Constellation Energy Corp
  • Duke Energy Corp.
  • Enbridge Inc.
  • GE Vernova Inc.
  • Iberdrola SA
  • Innergex Renewable Energy Inc.
  • Invenergy
  • Orsted AS
  • Plug Power Inc.
  • Schneider Electric SE
  • Siemens Gamesa Renewable Energy SA
  • Suzlon Energy Ltd.
  • Tata Power Renewable Energy Ltd.
  • Vestas Wind Systems AS

Qualitative and quantitative analysis of companies has been conducted to help clients understand the wider business environment as well as the strengths and weaknesses of key market players. Data is qualitatively analyzed to categorize companies as pure play, category-focused, industry-focused, and diversified; it is quantitatively analyzed to categorize companies as dominant, leading, strong, tentative, and weak.

Research Analyst Overview

Renewable electricity generation has emerged as a key solution to address the growing energy demand and reduce reliance on fossil fuels such as coal, oil, and natural gas. Renewable energy sources, including sunlight, wind, rain, tides, waves, geothermal heat, and biomass, offer environmental benefits by reducing greenhouse gas emissions and contributing to a low-carbon economy. Renewable energy targets and feed-in tariffs are driving the growth of renewable power sources, including hydroelectric power, wind power, solar energy, and geothermal energy. Renewable energy plants, such as solar PV systems, biogas plants, and hydroelectric systems, offer various advantages, including energy efficiency, energy self-sufficiency, and low-cost electricity.

In summary, these renewable power sources also provide additional benefits, such as flood control, clean drinking water, and irrigation support. The transition to renewable electricity generation is essential to mitigate climate change and reduce the carbon footprint of the energy sector. Renewable energy demand continues to grow, driven by increasing emissions regulations and the need for unconventional power generation. The solar industry, in particular, is experiencing significant growth, with solar PV installations increasing in commercial, industrial, residential, and utility projects. Renewable energy generation also offers cost savings in the long run, as the cost of renewable electricity production continues to decrease. Smart grids and vehicle-to-grid (V2G) technology are also playing a role in optimizing energy distribution and reducing electricity production costs. Overall, renewable electricity generation is a critical component of a sustainable and low-carbon energy future.

Market Scope

Report Coverage

Details

Page number

218

Base year

2023

Historic period

2018-2022

Forecast period

2024-2028

Growth momentum & CAGR

Accelerate at a CAGR of 11.5%

Market growth 2024-2028

USD 215.77 billion

Market structure

Fragmented

YoY growth 2023-2024(%)

11.2

Regional analysis

APAC, Europe, North America, South America, and Middle East and Africa

Performing market contribution

APAC at 43%

Key countries

China, US, India, Germany, Japan, Canada, Italy, UK, Mexico, and South Korea

Competitive landscape

Leading Companies, Market Positioning of Companies, Competitive Strategies, and Industry Risks

Key companies profiled

Acciona SA, Adani Green Energy Ltd., BP Plc, Brookfield Business Partners LP, Canadian Solar Inc., Constellation Energy Corp, Duke Energy Corp., Enbridge Inc., GE Vernova Inc., Iberdrola SA, Innergex Renewable Energy Inc., Invenergy, Orsted AS, Plug Power Inc., Schneider Electric SE, Siemens Gamesa Renewable Energy SA, Suzlon Energy Ltd., Tata Power Renewable Energy Ltd., and Vestas Wind Systems AS

Market dynamics

Parent market analysis, market growth inducers and obstacles, market forecast, fast-growing and slow-growing segment analysis, COVID-19 impact and recovery analysis and future consumer dynamics, market condition analysis for the forecast period

Customization purview

If our market report has not included the data that you are looking for, you can reach out to our analysts and get segments customized.

Request Free Sample

What are the Key Data Covered in this Market Research and Growth Report?

  • CAGR of the market during the forecast period
  • Detailed information on factors that will drive the market growth and forecasting between 2024 and 2028
  • Precise estimation of the size of the market  and its contribution of the market in focus to the parent market
  • Accurate predictions about upcoming market growth and trends and changes in consumer behaviour
  • Growth of the market across APAC, Europe, North America, South America, and Middle East and Africa
  • Thorough analysis of the market's competitive landscape and detailed information about companies
  • Comprehensive analysis of factors that will challenge the growth of market companies

We can help! Our analysts can customize this market research report to meet your requirements. Get in touch

1 Executive Summary

  • 1.1 Market overview
    • Executive Summary - Chart on Market Overview
    • Executive Summary - Data Table on Market Overview
    • Executive Summary - Chart on Global Market Characteristics
    • Executive Summary - Chart on Market by Geography
    • Executive Summary - Chart on Market Segmentation by Type
    • Executive Summary - Chart on Market Segmentation by End-user
    • Executive Summary - Chart on Incremental Growth
    • Executive Summary - Data Table on Incremental Growth
    • Executive Summary - Chart on Company Market Positioning

2 Technavio Analysis

  • 2.1 Analysis of price sensitivity, lifecycle, customer purchase basket, adoption rates, and purchase criteria
    • Analysis of price sensitivity, lifecycle, customer purchase basket, adoption rates, and purchase criteria
  • 2.2 Criticality of inputs and Factors of differentiation
    • Overview on criticality of inputs and factors of differentiation
  • 2.3 Factors of disruption
    • Overview on factors of disruption
  • 2.4 Impact of drivers and challenges
    • Impact of drivers and challenges in 2023 and 2028

3 Market Landscape

  • 3.1 Market ecosystem
    • Parent Market
    • Data Table on - Parent Market
  • 3.2 Market characteristics
    • Market characteristics analysis
  • 3.3 Value chain analysis
    • Value Chain Analysis

4 Market Sizing

  • 4.1 Market definition
    • Offerings of companies included in the market definition
  • 4.2 Market segment analysis
    • Market segments
  • 4.3 Market size 2023
    • 4.4 Market outlook: Forecast for 2023-2028
      • Chart on Global - Market size and forecast 2023-2028 ($ billion)
      • Data Table on Global - Market size and forecast 2023-2028 ($ billion)
      • Chart on Global Market: Year-over-year growth 2023-2028 (%)
      • Data Table on Global Market: Year-over-year growth 2023-2028 (%)

    5 Historic Market Size

    • 5.1 Global Renewable Electricity Generation Market 2018 - 2022
      • Historic Market Size - Data Table on Global Renewable Electricity Generation Market 2018 - 2022 ($ billion)
    • 5.2 Type segment analysis 2018 - 2022
      • Historic Market Size - Type Segment 2018 - 2022 ($ billion)
    • 5.3 End-user segment analysis 2018 - 2022
      • Historic Market Size - End-user Segment 2018 - 2022 ($ billion)
    • 5.4 Geography segment analysis 2018 - 2022
      • Historic Market Size - Geography Segment 2018 - 2022 ($ billion)
    • 5.5 Country segment analysis 2018 - 2022
      • Historic Market Size - Country Segment 2018 - 2022 ($ billion)

    6 Qualitative Analysis

    • 6.1 Impact of AI on the Global Renewable Electricity Generation Market

      7 Five Forces Analysis

      • 7.1 Five forces summary
        • Five forces analysis - Comparison between 2023 and 2028
      • 7.2 Bargaining power of buyers
        • Bargaining power of buyers - Impact of key factors 2023 and 2028
      • 7.3 Bargaining power of suppliers
        • Bargaining power of suppliers - Impact of key factors in 2023 and 2028
      • 7.4 Threat of new entrants
        • Threat of new entrants - Impact of key factors in 2023 and 2028
      • 7.5 Threat of substitutes
        • Threat of substitutes - Impact of key factors in 2023 and 2028
      • 7.6 Threat of rivalry
        • Threat of rivalry - Impact of key factors in 2023 and 2028
      • 7.7 Market condition
        • Chart on Market condition - Five forces 2023 and 2028

      8 Market Segmentation by Type

      • 8.1 Market segments
        • Chart on Type - Market share 2023-2028 (%)
        • Data Table on Type - Market share 2023-2028 (%)
      • 8.2 Comparison by Type
        • Chart on Comparison by Type
        • Data Table on Comparison by Type
      • 8.3 Solar - Market size and forecast 2023-2028
        • Chart on Solar - Market size and forecast 2023-2028 ($ billion)
        • Data Table on Solar - Market size and forecast 2023-2028 ($ billion)
        • Chart on Solar - Year-over-year growth 2023-2028 (%)
        • Data Table on Solar - Year-over-year growth 2023-2028 (%)
      • 8.4 Wind - Market size and forecast 2023-2028
        • Chart on Wind - Market size and forecast 2023-2028 ($ billion)
        • Data Table on Wind - Market size and forecast 2023-2028 ($ billion)
        • Chart on Wind - Year-over-year growth 2023-2028 (%)
        • Data Table on Wind - Year-over-year growth 2023-2028 (%)
      • 8.5 Hydropower - Market size and forecast 2023-2028
        • Chart on Hydropower - Market size and forecast 2023-2028 ($ billion)
        • Data Table on Hydropower - Market size and forecast 2023-2028 ($ billion)
        • Chart on Hydropower - Year-over-year growth 2023-2028 (%)
        • Data Table on Hydropower - Year-over-year growth 2023-2028 (%)
      • 8.6 Biomass - Market size and forecast 2023-2028
        • Chart on Biomass - Market size and forecast 2023-2028 ($ billion)
        • Data Table on Biomass - Market size and forecast 2023-2028 ($ billion)
        • Chart on Biomass - Year-over-year growth 2023-2028 (%)
        • Data Table on Biomass - Year-over-year growth 2023-2028 (%)
      • 8.7 Others - Market size and forecast 2023-2028
        • Chart on Others - Market size and forecast 2023-2028 ($ billion)
        • Data Table on Others - Market size and forecast 2023-2028 ($ billion)
        • Chart on Others - Year-over-year growth 2023-2028 (%)
        • Data Table on Others - Year-over-year growth 2023-2028 (%)
      • 8.8 Market opportunity by Type
        • Market opportunity by Type ($ billion)
        • Data Table on Market opportunity by Type ($ billion)

      9 Market Segmentation by End-user

      • 9.1 Market segments
        • Chart on End-user - Market share 2023-2028 (%)
        • Data Table on End-user - Market share 2023-2028 (%)
      • 9.2 Comparison by End-user
        • Chart on Comparison by End-user
        • Data Table on Comparison by End-user
      • 9.3 Residential - Market size and forecast 2023-2028
        • Chart on Residential - Market size and forecast 2023-2028 ($ billion)
        • Data Table on Residential - Market size and forecast 2023-2028 ($ billion)
        • Chart on Residential - Year-over-year growth 2023-2028 (%)
        • Data Table on Residential - Year-over-year growth 2023-2028 (%)
      • 9.4 Industrial - Market size and forecast 2023-2028
        • Chart on Industrial - Market size and forecast 2023-2028 ($ billion)
        • Data Table on Industrial - Market size and forecast 2023-2028 ($ billion)
        • Chart on Industrial - Year-over-year growth 2023-2028 (%)
        • Data Table on Industrial - Year-over-year growth 2023-2028 (%)
      • 9.5 Commercial - Market size and forecast 2023-2028
        • Chart on Commercial - Market size and forecast 2023-2028 ($ billion)
        • Data Table on Commercial - Market size and forecast 2023-2028 ($ billion)
        • Chart on Commercial - Year-over-year growth 2023-2028 (%)
        • Data Table on Commercial - Year-over-year growth 2023-2028 (%)
      • 9.6 Market opportunity by End-user
        • Market opportunity by End-user ($ billion)
        • Data Table on Market opportunity by End-user ($ billion)

      10 Customer Landscape

      • 10.1 Customer landscape overview
        • Analysis of price sensitivity, lifecycle, customer purchase basket, adoption rates, and purchase criteria

      11 Geographic Landscape

      • 11.1 Geographic segmentation
        • Chart on Market share by geography 2023-2028 (%)
        • Data Table on Market share by geography 2023-2028 (%)
      • 11.2 Geographic comparison
        • Chart on Geographic comparison
        • Data Table on Geographic comparison
      • 11.3 APAC - Market size and forecast 2023-2028
        • Chart on APAC - Market size and forecast 2023-2028 ($ billion)
        • Data Table on APAC - Market size and forecast 2023-2028 ($ billion)
        • Chart on APAC - Year-over-year growth 2023-2028 (%)
        • Data Table on APAC - Year-over-year growth 2023-2028 (%)
      • 11.4 Europe - Market size and forecast 2023-2028
        • Chart on Europe - Market size and forecast 2023-2028 ($ billion)
        • Data Table on Europe - Market size and forecast 2023-2028 ($ billion)
        • Chart on Europe - Year-over-year growth 2023-2028 (%)
        • Data Table on Europe - Year-over-year growth 2023-2028 (%)
      • 11.5 North America - Market size and forecast 2023-2028
        • Chart on North America - Market size and forecast 2023-2028 ($ billion)
        • Data Table on North America - Market size and forecast 2023-2028 ($ billion)
        • Chart on North America - Year-over-year growth 2023-2028 (%)
        • Data Table on North America - Year-over-year growth 2023-2028 (%)
      • 11.6 South America - Market size and forecast 2023-2028
        • Chart on South America - Market size and forecast 2023-2028 ($ billion)
        • Data Table on South America - Market size and forecast 2023-2028 ($ billion)
        • Chart on South America - Year-over-year growth 2023-2028 (%)
        • Data Table on South America - Year-over-year growth 2023-2028 (%)
      • 11.7 Middle East and Africa - Market size and forecast 2023-2028
        • Chart on Middle East and Africa - Market size and forecast 2023-2028 ($ billion)
        • Data Table on Middle East and Africa - Market size and forecast 2023-2028 ($ billion)
        • Chart on Middle East and Africa - Year-over-year growth 2023-2028 (%)
        • Data Table on Middle East and Africa - Year-over-year growth 2023-2028 (%)
      • 11.8 China - Market size and forecast 2023-2028
        • Chart on China - Market size and forecast 2023-2028 ($ billion)
        • Data Table on China - Market size and forecast 2023-2028 ($ billion)
        • Chart on China - Year-over-year growth 2023-2028 (%)
        • Data Table on China - Year-over-year growth 2023-2028 (%)
      • 11.9 US - Market size and forecast 2023-2028
        • Chart on US - Market size and forecast 2023-2028 ($ billion)
        • Data Table on US - Market size and forecast 2023-2028 ($ billion)
        • Chart on US - Year-over-year growth 2023-2028 (%)
        • Data Table on US - Year-over-year growth 2023-2028 (%)
      • 11.10 India - Market size and forecast 2023-2028
        • Chart on India - Market size and forecast 2023-2028 ($ billion)
        • Data Table on India - Market size and forecast 2023-2028 ($ billion)
        • Chart on India - Year-over-year growth 2023-2028 (%)
        • Data Table on India - Year-over-year growth 2023-2028 (%)
      • 11.11 Germany - Market size and forecast 2023-2028
        • Chart on Germany - Market size and forecast 2023-2028 ($ billion)
        • Data Table on Germany - Market size and forecast 2023-2028 ($ billion)
        • Chart on Germany - Year-over-year growth 2023-2028 (%)
        • Data Table on Germany - Year-over-year growth 2023-2028 (%)
      • 11.12 Japan - Market size and forecast 2023-2028
        • Chart on Japan - Market size and forecast 2023-2028 ($ billion)
        • Data Table on Japan - Market size and forecast 2023-2028 ($ billion)
        • Chart on Japan - Year-over-year growth 2023-2028 (%)
        • Data Table on Japan - Year-over-year growth 2023-2028 (%)
      • 11.13 Canada - Market size and forecast 2023-2028
        • Chart on Canada - Market size and forecast 2023-2028 ($ billion)
        • Data Table on Canada - Market size and forecast 2023-2028 ($ billion)
        • Chart on Canada - Year-over-year growth 2023-2028 (%)
        • Data Table on Canada - Year-over-year growth 2023-2028 (%)
      • 11.14 Italy - Market size and forecast 2023-2028
        • Chart on Italy - Market size and forecast 2023-2028 ($ billion)
        • Data Table on Italy - Market size and forecast 2023-2028 ($ billion)
        • Chart on Italy - Year-over-year growth 2023-2028 (%)
        • Data Table on Italy - Year-over-year growth 2023-2028 (%)
      • 11.15 UK - Market size and forecast 2023-2028
        • Chart on UK - Market size and forecast 2023-2028 ($ billion)
        • Data Table on UK - Market size and forecast 2023-2028 ($ billion)
        • Chart on UK - Year-over-year growth 2023-2028 (%)
        • Data Table on UK - Year-over-year growth 2023-2028 (%)
      • 11.16 Mexico - Market size and forecast 2023-2028
        • Chart on Mexico - Market size and forecast 2023-2028 ($ billion)
        • Data Table on Mexico - Market size and forecast 2023-2028 ($ billion)
        • Chart on Mexico - Year-over-year growth 2023-2028 (%)
        • Data Table on Mexico - Year-over-year growth 2023-2028 (%)
      • 11.17 South Korea - Market size and forecast 2023-2028
        • Chart on South Korea - Market size and forecast 2023-2028 ($ billion)
        • Data Table on South Korea - Market size and forecast 2023-2028 ($ billion)
        • Chart on South Korea - Year-over-year growth 2023-2028 (%)
        • Data Table on South Korea - Year-over-year growth 2023-2028 (%)
      • 11.18 Market opportunity by geography
        • Market opportunity by geography ($ billion)
        • Data Tables on Market opportunity by geography ($ billion)

      12 Drivers, Challenges, and Opportunity/Restraints

      • 12.1 Market drivers
        • 12.2 Market challenges
          • 12.3 Impact of drivers and challenges
            • Impact of drivers and challenges in 2023 and 2028
          • 12.4 Market opportunities/restraints

            13 Competitive Landscape

            • 13.1 Overview
              • 13.2 Competitive Landscape
                • Overview on criticality of inputs and factors of differentiation
              • 13.3 Landscape disruption
                • Overview on factors of disruption
              • 13.4 Industry risks
                • Impact of key risks on business

              14 Competitive Analysis

              • 14.1 Companies profiled
                • Companies covered
              • 14.2 Company ranking index
                • Company ranking index
              • 14.3 Market positioning of companies
                • Matrix on companies position and classification
              • 14.4 Acciona SA
                • Acciona SA - Overview
                • Acciona SA - Business segments
                • Acciona SA - Key news
                • Acciona SA - Key offerings
                • Acciona SA - Segment focus
                • SWOT
              • 14.5 BP Plc
                • BP Plc - Overview
                • BP Plc - Business segments
                • BP Plc - Key news
                • BP Plc - Key offerings
                • BP Plc - Segment focus
                • SWOT
              • 14.6 Brookfield Business Partners LP
                • Brookfield Business Partners LP - Overview
                • Brookfield Business Partners LP - Business segments
                • Brookfield Business Partners LP - Key offerings
                • Brookfield Business Partners LP - Segment focus
                • SWOT
              • 14.7 Constellation Energy Corp
                • Constellation Energy Corp - Overview
                • Constellation Energy Corp - Business segments
                • Constellation Energy Corp - Key offerings
                • Constellation Energy Corp - Segment focus
                • SWOT
              • 14.8 Enbridge Inc.
                • Enbridge Inc. - Overview
                • Enbridge Inc. - Business segments
                • Enbridge Inc. - Key news
                • Enbridge Inc. - Key offerings
                • Enbridge Inc. - Segment focus
                • SWOT
              • 14.9 GE Vernova Inc.
                • GE Vernova Inc. - Overview
                • GE Vernova Inc. - Product / Service
                • GE Vernova Inc. - Key offerings
                • SWOT
              • 14.10 Iberdrola SA
                • Iberdrola SA - Overview
                • Iberdrola SA - Business segments
                • Iberdrola SA - Key offerings
                • Iberdrola SA - Segment focus
                • SWOT
              • 14.11 Innergex Renewable Energy Inc.
                • Innergex Renewable Energy Inc. - Overview
                • Innergex Renewable Energy Inc. - Business segments
                • Innergex Renewable Energy Inc. - Key offerings
                • Innergex Renewable Energy Inc. - Segment focus
                • SWOT
              • 14.12 Invenergy
                • Invenergy - Overview
                • Invenergy - Product / Service
                • Invenergy - Key offerings
                • SWOT
              • 14.13 Plug Power Inc.
                • Plug Power Inc. - Overview
                • Plug Power Inc. - Product / Service
                • Plug Power Inc. - Key offerings
                • SWOT
              • 14.14 Schneider Electric SE
                • Schneider Electric SE - Overview
                • Schneider Electric SE - Business segments
                • Schneider Electric SE - Key news
                • Schneider Electric SE - Key offerings
                • Schneider Electric SE - Segment focus
                • SWOT
              • 14.15 Siemens Gamesa Renewable Energy SA
                • Siemens Gamesa Renewable Energy SA - Overview
                • Siemens Gamesa Renewable Energy SA - Product / Service
                • Siemens Gamesa Renewable Energy SA - Key offerings
                • SWOT
              • 14.16 Suzlon Energy Ltd.
                • Suzlon Energy Ltd. - Overview
                • Suzlon Energy Ltd. - Business segments
                • Suzlon Energy Ltd. - Key offerings
                • Suzlon Energy Ltd. - Segment focus
                • SWOT
              • 14.17 Tata Power Renewable Energy Ltd.
                • Tata Power Renewable Energy Ltd. - Overview
                • Tata Power Renewable Energy Ltd. - Product / Service
                • Tata Power Renewable Energy Ltd. - Key offerings
                • SWOT
              • 14.18 Vestas Wind Systems AS
                • Vestas Wind Systems AS - Overview
                • Vestas Wind Systems AS - Business segments
                • Vestas Wind Systems AS - Key offerings
                • Vestas Wind Systems AS - Segment focus
                • SWOT

              15 Appendix

              • 15.1 Scope of the report
                • 15.2 Inclusions and exclusions checklist
                  • Inclusions checklist
                  • Exclusions checklist
                • 15.3 Currency conversion rates for US$
                  • Currency conversion rates for US$
                • 15.4 Research methodology
                  • Research methodology
                • 15.5 Data procurement
                  • Information sources
                • 15.6 Data validation
                  • Data validation
                • 15.7 Validation techniques employed for market sizing
                  • Validation techniques employed for market sizing
                • 15.8 Data synthesis
                  • Data synthesis
                • 15.9 360 degree market analysis
                  • 360 degree market analysis
                • 15.10 List of abbreviations
                  • List of abbreviations
                  • o Strong geographic presence

                Research Methodology

                Technavio presents a detailed picture of the market by way of study, synthesis, and summation of data from multiple sources. The analysts have presented the various facets of the market with a particular focus on identifying the key industry influencers. The data thus presented is comprehensive, reliable, and the result of extensive research, both primary and secondary.

                INFORMATION SOURCES

                Primary sources

                • Manufacturers and suppliers
                • Channel partners
                • Industry experts
                • Strategic decision makers

                Secondary sources

                • Industry journals and periodicals
                • Government data
                • Financial reports of key industry players
                • Historical data
                • Press releases

                DATA ANALYSIS

                Data Synthesis

                • Collation of data
                • Estimation of key figures
                • Analysis of derived insights

                Data Validation

                • Triangulation with data models
                • Reference against proprietary databases
                • Corroboration with industry experts

                REPORT WRITING

                Qualitative

                • Market drivers
                • Market challenges
                • Market trends
                • Five forces analysis

                Quantitative

                • Market size and forecast
                • Market segmentation
                • Geographical insights
                • Competitive landscape

                Interested in this report?

                Get your sample now to see our research methodology and insights!

                Download Now

                Frequently Asked Questions

                Renewable Electricity Generation market growth will increase by $ 215.77 bn during 2024-2028 .

                The Renewable Electricity Generation market is expected to grow at a CAGR of 11.5% during 2024-2028 .

                Renewable Electricity Generation market is segmented by Type( Solar, Wind, Hydropower, Biomass, Others) End-user( Residential, Industrial, Commercial)

                Acciona SA, Adani Green Energy Ltd., BP Plc, Brookfield Business Partners LP, Canadian Solar Inc., Constellation Energy Corp, Duke Energy Corp., Enbridge Inc., GE Vernova Inc., Iberdrola SA, Innergex Renewable Energy Inc., Invenergy, Orsted AS, Plug Power Inc., Schneider Electric SE, Siemens Gamesa Renewable Energy SA, Suzlon Energy Ltd., Tata Power Renewable Energy Ltd., Vestas Wind Systems AS are a few of the key vendors in the Renewable Electricity Generation market.

                APAC will register the highest growth rate of 43% among the other regions. Therefore, the Renewable Electricity Generation market in APAC is expected to garner significant business opportunities for the vendors during the forecast period.

                China, US, India, Germany, Japan, Canada, Italy, UK, Mexico, South Korea

                • Tax incentives for renewable electricity generation projectsTax incentives play a crucial role in driving the growth of the wind power industry by making renewable energy projects more financially attractive. These incentives reduce the overall cost of capital investment is the driving factor this market.
                • thereby enhancing the economic viability of wind power projects. The introduction of a renewable energy investment tax credit (ITC) by Canada in the 2023 federal budget exemplifies the significant impact of such incentives. This ITC offers a 30% tax write-off for renewable technologies deployed through 2034 is the driving factor this market.
                • making Canada one of the most favorable environments for renewable energy investments globally. The ITC is a refundable incentive is the driving factor this market.
                • meaning it directly reduces the tax liability of renewable energy projects is the driving factor this market.
                • thereby increasing their net present value (NPV). The economic modeling by Rystad Energy indicates that these tax breaks can increase the value of some renewable energy projects by over 50% throughout their lifecycle. For instance is the driving factor this market.
                • a 250-megawatt (MW) wind power project in Canada is the driving factor this market.
                • which previously had an after-tax NPV of $131 million is the driving factor this market.
                • now boasts an NPV of $202 million due to the ITC. This substantial rise in project value is likely to spur further developments and revitalize projects that were previously deemed economically unfeasible. The strategy is the driving factor this market.
                • made in Canada is the driving factor this market.
                •  akin to the US Inflation Reduction Act is the driving factor this market.
                • emphasizes domestic production and labor is the driving factor this market.
                • further boosting the attractiveness of renewable energy projects. By prioritizing local content and workforce is the driving factor this market.
                • these policies not only enhance the economic benefits of renewable energy projects but also support local economies and job creation.Tax incentives such as the renewable energy ITC in Canada are pivotal in driving the growth of the renewable electricity generation market in the region. By significantly improving the financial returns of wind power projects is the driving factor this market.
                • these incentives encourage investment is the driving factor this market.
                • stimulate economic development is the driving factor this market.
                • and support the transition to a sustainable energy future. As countries continue to implement and expand such policies is the driving factor this market.
                • the wind power industry is poised for robust growth is the driving factor this market.
                • contributing to global renewable energy targets and climate goals. Therefore is the driving factor this market.
                • such factors are expected to drive the growth of the global renewable electricity generation market during the forecast period. is the driving factor this market.

                The Renewable Electricity Generation market vendors should focus on grabbing business opportunities from the Solar segment as it accounted for the largest market share in the base year.