Enhanced Vision System Market Analysis North America, Europe, APAC, South America, Middle East and Africa - US, Canada, China, UK, France - Size and Forecast 2024-2028

Enhanced Vision System Market Analysis North America, Europe, APAC, South America, Middle East and Africa - US, Canada, China, UK, France - Size and Forecast 2024-2028

Published: Dec 2023 163 Pages SKU: IRTNTR77176

Market Overview at a Glance

$68.32 Mn
Market Opportunity
4.52%
CAGR
4.02
YoY growth 2023-2024(%)

Enhanced Vision System Market Size 2024-2028 

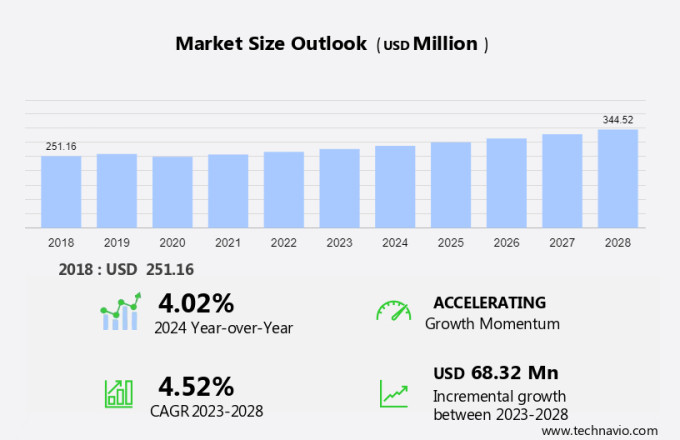
The enhanced vision system market size is forecast to increase by USD 68.32 million at a CAGR of 4.52% between 2023 and 2028. The market is experiencing significant growth due to its increasing adoption in various industries, particularly commercial airlines. This cutting-edge technology enhances situational awareness by utilizing sensor technology such as infrared imaging and multispectral imaging. EVS is particularly valuable in inclement weather conditions, enabling pilots to see runways and obstacles more clearly. The integration of artificial intelligence (AI) in EVS has further advanced its capabilities, with AI-powered image processing and object recognition enhancing the system's accuracy and reliability. The display segment of enhanced vision systems is expected to witness significant growth due to the increasing adoption of these advanced technologies in aviation. However, the increasing manufacturing costs of EVS may hinder market growth. In the maritime industry, EVS is expanding applications in navigation, while in mining and extraction, it is enhancing safety and efficiency.

Enhanced Vision System Market Size

 Request Free Sample

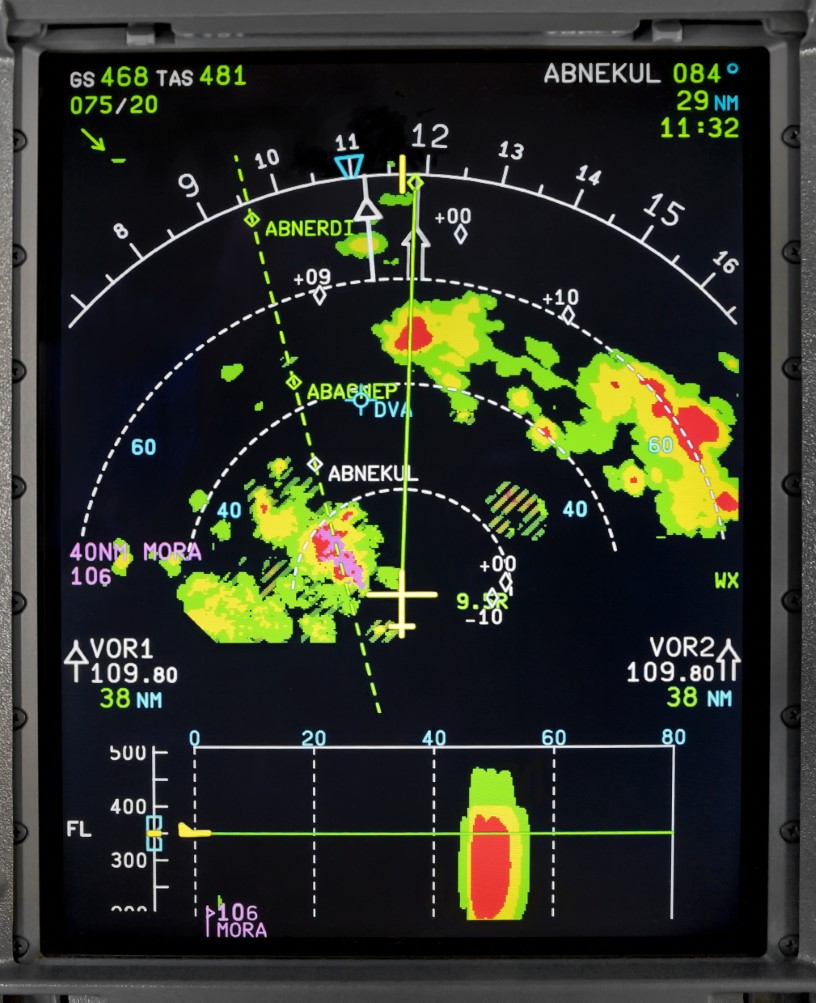
Enhanced vision systems have become essential components in the aviation industry, revolutionizing flight operations by enhancing pilots' visibility and situational awareness. These systems utilize advanced sensor technologies and imaging displays to provide real-time information about terrain features, runways, and other critical elements during takeoffs, landings, and flight operations. The core of enhanced vision systems consists of high-definition cameras and infrared sensors. These sensors capture data in various wavelengths, including infrared and visible light, to generate synthetic vision images. Synthetic vision systems process this data to create 3D representations of the environment, overlaying essential information such as runway markings and terrain contours on the displays. Augmented reality displays play a crucial role in presenting this information to pilots. These advanced displays integrate the synthetic vision data with real-world views, providing a seamless and comprehensive visual representation of the surroundings.

Further, business jet operators have been early adopters of these technologies, as they offer significant advantages in low visibility conditions and during nighttime operations. Millimeter wave radar is another technology that enhances the capabilities of enhanced vision systems. This technology can detect and display the presence of obstacles and terrain features, providing pilots with critical information for safe takeoffs and landings. Infrared imaging is another essential component of enhanced vision systems. Infrared sensors can detect heat signatures, making them ideal for identifying potential hazards, such as ice on the wings or engine components, during flight operations. Technology developers are continuously working on improving the performance and functionality of enhanced vision systems. These advancements include higher resolution displays, faster processing speeds, and more advanced algorithms for data analysis. The future of enhanced vision systems in aviation looks promising, with significant potential for enhancing safety, efficiency, and overall operational capabilities.

Market Segmentation

The market research report provides comprehensive data (region-wise segment analysis), with forecasts and estimates in "USD million" for the period 2024-2028, as well as historical data from 2018-2022 for the following segments.

  • Component
    • Display
    • Camera
    • Control electronics
    • Processing units
    • Sensors
  • Platform
    • Fixed wing
    • Rotary wing
  • Geography
    • North America
      • Canada
      • US
    • Europe
      • UK
      • France
    • APAC
      • China
    • South America
    • Middle East and Africa

By Component Insights

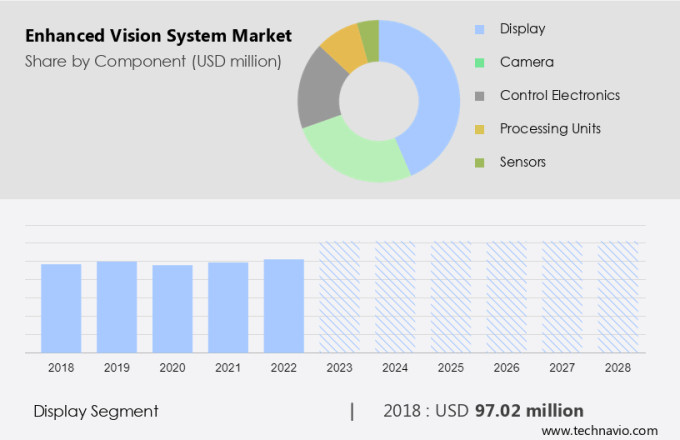
The display segment is estimated to witness significant growth during the forecast period. The Enhanced Vision System (EVS) market is experiencing notable expansion, with various sectors identified for in-depth analysis. A significant segment within this industry is the display technology segment, which is integral to providing real-time information and heightening situational awareness for aviation personnel. This segment comprises diverse devices, such as head-up displays (HUDs), head-mounted displays (HMDs), and primary flight displays (PFDs). These displays utilize sophisticated visualization techniques, presenting critical flight data, terrain, obstacles, and weather conditions in a lucid and user-friendly format.

Moreover, by keeping pilots' focus on the external environment, they minimize the necessity for frequent shifts in attention towards conventional cockpit instruments. The display segment incorporates advanced imaging technologies, including high-definition cameras and infrared sensors, which are integrated with avionics systems and augmented reality displays. These technologies contribute to enhancing the overall functionality and effectiveness of the EVS market.

Enhanced Vision System Market Size

Get a glance at the market share of various segments Request Free Sample

The display segment accounted for USD 97.02 million in 2018 and showed a gradual increase during the forecast period.

Regional Insights

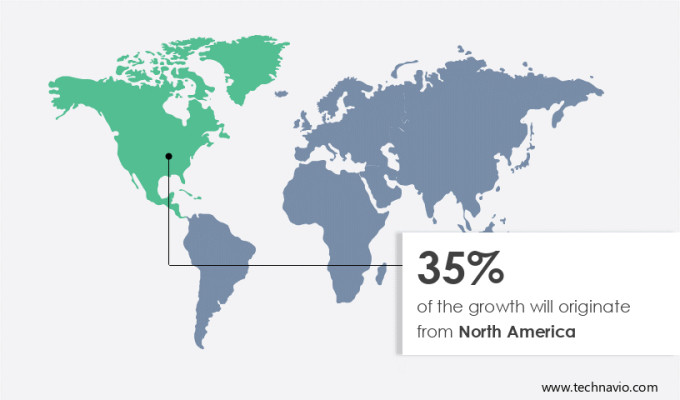
North America is estimated to contribute 35% to the growth of the global market during the forecast period. Technavio's analysts have elaborately explained the regional trends and drivers that shape the market during the forecast period.

Enhanced Vision System Market Share by Geography

For more insights on the market share of various regions Request Free Sample

In North America, the Enhanced Vision System (EVS) market has experienced notable growth due to its ability to enhance pilot situational awareness during challenging visual conditions. EVS is a technology designed to support pilots in navigating safely and efficiently during fog, darkness, or adverse weather. This system employs advanced sensor technologies, such as thermal imaging and infrared sensors, along with head-up displays, to present real-time visual data to pilots. With North America being a major player in the global aviation sector, the presence of a large number of commercial and private aircraft operators and stringent safety regulations, the demand for advanced avionics systems, including EVS, is on the rise. This trend is expected to continue, offering substantial growth opportunities for market participants in the region.

Our researchers analyzed the data with 2023 as the base year, along with the key drivers, trends, and challenges. A holistic analysis of drivers will help companies refine their marketing strategies to gain a competitive advantage.

Market Driver

Expanding applications of EVS in maritime navigation, mining and extraction, and healthcare is the key driver of the market. The Enhanced Vision System (EVS) market has seen significant growth due to its increasing adoption in various sectors beyond aviation, including maritime navigation, mining and extraction, and healthcare. In maritime navigation, EVS plays a pivotal role in enhancing the safety and efficiency of ship operations. Through the integration of advanced sensors, real-time data processing, and image enhancement technologies, EVS provides superior visibility in challenging weather conditions, low-light environments, and areas with limited visibility. This advanced vision system enables captains and crews to detect obstacles, identify navigation markers, and maneuver vessels with greater precision, thereby reducing the risk of accidents and improving overall maritime operations.

Additionally, technology developers continue to innovate and improve EVS technology to meet the evolving needs of various industries. Aviation regulatory agencies and business jet operators have been early adopters of EVS, and military aviation is also increasingly utilizing this technology for enhanced situational awareness during takeoffs, landings, and flight operations. The expansion of applications for EVS has solidified its position as a key driver in the global EVS market.

Market Trends

Integration of AI-powered image processing and object recognition is the upcoming trend in the market. The Enhanced Vision System (EVS) market is experiencing a notable shift towards incorporating machine learning algorithms and advanced technologies such as LiDAR, edge computing, and fusion. These innovations aim to enhance operational efficiency and improve the functionality of EVSs in various industries, including autonomous car navigation and aerial collision avoidance. Machine learning algorithms enable EVSs to analyze and interpret visual data in real-time, leading to more accurate object recognition. LiDAR technology provides high-resolution 3D imaging, while edge computing enables data processing at the source, reducing latency and increasing response time. The integration of these technologies is essential for safety and security applications, such as medical diagnostics and surveillance systems.

Moreover, AI-powered image processing and object recognition are crucial for enhancing the performance of EVSs, enabling them to capture, process, and interpret complex visual data with greater accuracy and speed. The adoption of these advanced technologies is expected to drive growth in the EVS market.

Market Challenge

Increased manufacturing cost of EVS is a key challenge affecting the market growth. The market in the commercial aviation sector is witnessing significant growth due to the integration of cutting-edge technology to enhance situational awareness. EVS systems utilize sensor technology, including infrared imaging and multispectral imaging, to provide real-time visuals to pilots, improving safety and reducing the risks associated with inclement weather or low-visibility environments. These systems are essential for ensuring smooth operations in challenging conditions, thereby increasing the demand for EVS in commercial airlines.

Further, artificial intelligence (AI) is also being integrated into EVS to provide enhanced image processing capabilities, further improving situational awareness for pilots. The EVS market is experiencing increased demand due to the growing focus on safety and the need for advanced technologies to support the increasing number of flights. Despite the higher manufacturing costs, the benefits of EVS far outweigh the investment, making it a worthwhile investment for commercial airlines.

Exclusive Customer Landscape

The market forecasting report includes the adoption lifecycle of the market, covering from the innovator's stage to the laggard's stage. It focuses on adoption rates in different regions based on penetration. Furthermore, the report also includes key purchase criteria and drivers of price sensitivity to help companies evaluate and develop their market growth analysis strategies.

Enhanced Vision System Market Share by Geography

 Customer Landscape

Key Companies & Market Insights

Companies are implementing various strategies, such as strategic alliances, partnerships, mergers and acquisitions, geographical expansion, and product/service launches, to enhance their presence in the market.

Astronics Corp.: The company offers dual sensor, Max Viz system, and single sensor vision systems.

The market research and growth report includes detailed analyses of the competitive landscape of the market and information about key companies, including:

  • BAE Systems Plc
  • Elbit Systems Ltd.
  • Honeywell International Inc.
  • Industrial Vision Systems Ltd.
  • Kawasaki Heavy Industries Ltd.
  • Keyence India Pvt. Ltd.
  • Konica Minolta Inc.
  • Mercury Systems Inc.
  • Raytheon Technologies Corp.
  • Robert Bosch GmbH
  • Rosenbauer International AG
  • Rotorcraft Services Group
  • Samvardhana Motherson International Ltd.
  • SOLOMON TECHNOLOGY CORP.
  • Techman Robot Inc.
  • Thales Group
  • Vision Components GmbH
  • Zebra Technologies Corp.
  • Skeyes

Qualitative and quantitative analysis of companies has been conducted to help clients understand the wider business environment as well as the strengths and weaknesses of key market players. Data is qualitatively analyzed to categorize companies as pure play, category-focused, industry-focused, and diversified; it is quantitatively analyzed to categorize companies as dominant, leading, strong, tentative, and weak.

Research Analyst Overview

Enhanced vision systems are revolutionizing the aviation industry by providing pilots with superior situational awareness during flight operations. These systems utilize advanced sensor technologies, such as high-definition cameras and infrared sensors, to capture and process real-time imaging data. Augmented reality displays then overlay this information onto the pilot's view, enhancing their vision and enabling them to better navigate terrain features, runways, and other environmental factors. Avionics systems in both business and commercial aviation are incorporating these enhanced vision systems to improve safety and operational efficiency. Infrared (IR) technology and millimeter-wave radar are key sensor technologies used in these systems. IR technology enables thermal imaging, while millimeter-wave radar provides data on the distance and size of objects.

Moreover, competing technologies, such as Lidar and artificial intelligence (AI) optimization, are also being explored for enhanced vision systems. Data security is a critical consideration for these systems, as they handle sensitive information. Regulatory agencies and business jet operators in military aviation and commercial airlines are collaborating with technology developers to integrate these systems into aircraft. These systems are not limited to aviation applications. They are also being used in maritime security and consumer applications, such as autonomous car navigation and aerial collision avoidance. Miniaturization and AI optimization are key trends in the development of these systems, enabling greater functionality and ease of use.

Market Scope

Report Coverage

Details

Page number

163

Base year

2023

Historic period

2018-2022

Forecast period

2024-2028

Growth momentum & CAGR

Accelerate at a CAGR of 4.52%

Market Growth 2024-2028

USD 68.32 million

Market structure

Fragmented

YoY growth 2023-2024(%)

4.02

Regional analysis

North America, Europe, APAC, South America, and Middle East and Africa

Performing market contribution

North America at 35%

Key countries

US, Canada, China, UK, and France

Competitive landscape

Leading Companies, Market Positioning of Companies, Competitive Strategies, and Industry Risks

Key companies profiled

Astronics Corp., BAE Systems Plc, Elbit Systems Ltd., Honeywell International Inc., Industrial Vision Systems Ltd., Kawasaki Heavy Industries Ltd., Keyence India Pvt. Ltd., Konica Minolta Inc., Mercury Systems Inc., Raytheon Technologies Corp., Robert Bosch GmbH, Rosenbauer International AG, Rotorcraft Services Group, Samvardhana Motherson International Ltd., SOLOMON TECHNOLOGY CORP., Techman Robot Inc., Thales Group, Vision Components GmbH, Zebra Technologies Corp., and Skeyes

Market dynamics

Parent market analysis, market growth inducers and obstacles, market forecast, fast-growing and slow-growing segment analysis, COVID-19 impact and recovery analysis and future consumer dynamics, market condition analysis for the forecast period

Customization purview

If our market report has not included the data that you are looking for, you can reach out to our analysts and get segments customized.

Request Free Sample

What are the Key Data Covered in this Market Research and Growth Report?

  • CAGR of the market during the forecast period
  • Detailed information on factors that will drive the market growth and forecasting between 2024 and 2028
  • Precise estimation of the size of the market  and its contribution of the market in focus to the parent market
  • Accurate predictions about upcoming market growth and trends and changes in consumer behaviour
  • Growth of the market across North America, Europe, APAC, South America, and Middle East and Africa
  • Thorough analysis of the market's competitive landscape and detailed information about companies
  • Comprehensive analysis of factors that will challenge the growth of market companies

We can help! Our analysts can customize this market research report to meet your requirements. Get in touch

1 Executive Summary

  • 1.1 Market overview
    • Exhibit 01: Executive Summary – Chart on Market Overview
    • Exhibit 02: Executive Summary – Data Table on Market Overview
    • Exhibit 03: Executive Summary – Chart on Global Market Characteristics
    • Exhibit 04: Executive Summary – Chart on Market by Geography
    • Exhibit 05: Executive Summary – Chart on Market Segmentation by Component
    • Exhibit 06: Executive Summary – Chart on Market Segmentation by Platform
    • Exhibit 07: Executive Summary – Chart on Incremental Growth
    • Exhibit 08: Executive Summary – Data Table on Incremental Growth
    • Exhibit 09: Executive Summary – Chart on Vendor Market Positioning

2 Market Landscape

  • 2.1 Market ecosystem
    • Exhibit 10: Parent market
    • Exhibit 11: Market Characteristics

3 Market Sizing

  • 3.1 Market definition
    • Exhibit 12: Offerings of vendors included in the market definition
  • 3.2 Market segment analysis
    • Exhibit 13: Market segments
  • 3.3 Market size 2023
    • 3.4 Market outlook: Forecast for 2023-2028
      • Exhibit 14: Chart on Global - Market size and forecast 2023-2028 ($ million)
      • Exhibit 15: Data Table on Global - Market size and forecast 2023-2028 ($ million)
      • Exhibit 16: Chart on Global Market: Year-over-year growth 2023-2028 (%)
      • Exhibit 17: Data Table on Global Market: Year-over-year growth 2023-2028 (%)

    4 Historic Market Size

    • 4.1 Global enhanced vision system market 2018 - 2022
      • Exhibit 18: Historic Market Size – Data Table on global enhanced vision system market 2018 - 2022 ($ million)
    • 4.2 Component Segment Analysis 2018 - 2022
      • Exhibit 19: Historic Market Size – Component Segment 2018 - 2022 ($ million)
    • 4.3 Platform Segment Analysis 2018 - 2022
      • Exhibit 20: Historic Market Size – Platform Segment 2018 - 2022 ($ million)
    • 4.4 Geography Segment Analysis 2018 - 2022
      • Exhibit 21: Historic Market Size – Geography Segment 2018 - 2022 ($ million)
    • 4.5 Country Segment Analysis 2018 - 2022
      • Exhibit 22: Historic Market Size – Country Segment 2018 - 2022 ($ million)

    5 Five Forces Analysis

    • 5.1 Five forces summary
      • Exhibit 23: Five forces analysis - Comparison between 2023 and 2028
    • 5.2 Bargaining power of buyers
      • Exhibit 24: Chart on Bargaining power of buyers – Impact of key factors 2023 and 2028
    • 5.3 Bargaining power of suppliers
      • Exhibit 25: Bargaining power of suppliers – Impact of key factors in 2023 and 2028
    • 5.4 Threat of new entrants
      • Exhibit 26: Threat of new entrants – Impact of key factors in 2023 and 2028
    • 5.5 Threat of substitutes
      • Exhibit 27: Threat of substitutes – Impact of key factors in 2023 and 2028
    • 5.6 Threat of rivalry
      • Exhibit 28: Threat of rivalry – Impact of key factors in 2023 and 2028
    • 5.7 Market condition
      • Exhibit 29: Chart on Market condition - Five forces 2023 and 2028

    6 Market Segmentation by Component

    • 6.1 Market segments
      • Exhibit 30: Chart on Component - Market share 2023-2028 (%)
      • Exhibit 31: Data Table on Component - Market share 2023-2028 (%)
    • 6.2 Comparison by Component
      • Exhibit 32: Chart on Comparison by Component
      • Exhibit 33: Data Table on Comparison by Component
    • 6.3 Display - Market size and forecast 2023-2028
      • Exhibit 34: Chart on Display - Market size and forecast 2023-2028 ($ million)
      • Exhibit 35: Data Table on Display - Market size and forecast 2023-2028 ($ million)
      • Exhibit 36: Chart on Display - Year-over-year growth 2023-2028 (%)
      • Exhibit 37: Data Table on Display - Year-over-year growth 2023-2028 (%)
    • 6.4 Camera - Market size and forecast 2023-2028
      • Exhibit 38: Chart on Camera - Market size and forecast 2023-2028 ($ million)
      • Exhibit 39: Data Table on Camera - Market size and forecast 2023-2028 ($ million)
      • Exhibit 40: Chart on Camera - Year-over-year growth 2023-2028 (%)
      • Exhibit 41: Data Table on Camera - Year-over-year growth 2023-2028 (%)
    • 6.5 Control electronics - Market size and forecast 2023-2028
      • Exhibit 42: Chart on Control electronics - Market size and forecast 2023-2028 ($ million)
      • Exhibit 43: Data Table on Control electronics - Market size and forecast 2023-2028 ($ million)
      • Exhibit 44: Chart on Control electronics - Year-over-year growth 2023-2028 (%)
      • Exhibit 45: Data Table on Control electronics - Year-over-year growth 2023-2028 (%)
    • 6.6 Processing units - Market size and forecast 2023-2028
      • Exhibit 46: Chart on Processing units - Market size and forecast 2023-2028 ($ million)
      • Exhibit 47: Data Table on Processing units - Market size and forecast 2023-2028 ($ million)
      • Exhibit 48: Chart on Processing units - Year-over-year growth 2023-2028 (%)
      • Exhibit 49: Data Table on Processing units - Year-over-year growth 2023-2028 (%)
    • 6.7 Sensors - Market size and forecast 2023-2028
      • Exhibit 50: Chart on Sensors - Market size and forecast 2023-2028 ($ million)
      • Exhibit 51: Data Table on Sensors - Market size and forecast 2023-2028 ($ million)
      • Exhibit 52: Chart on Sensors - Year-over-year growth 2023-2028 (%)
      • Exhibit 53: Data Table on Sensors - Year-over-year growth 2023-2028 (%)
    • 6.8 Market opportunity by Component
      • Exhibit 54: Market opportunity by Component ($ million)
      • Exhibit 55: Data Table on Market opportunity by Component ($ million)

    7 Market Segmentation by Platform

    • 7.1 Market segments
      • Exhibit 56: Chart on Platform - Market share 2023-2028 (%)
      • Exhibit 57: Data Table on Platform - Market share 2023-2028 (%)
    • 7.2 Comparison by Platform
      • Exhibit 58: Chart on Comparison by Platform
      • Exhibit 59: Data Table on Comparison by Platform
    • 7.3 Fixed wing - Market size and forecast 2023-2028
      • Exhibit 60: Chart on Fixed wing - Market size and forecast 2023-2028 ($ million)
      • Exhibit 61: Data Table on Fixed wing - Market size and forecast 2023-2028 ($ million)
      • Exhibit 62: Chart on Fixed wing - Year-over-year growth 2023-2028 (%)
      • Exhibit 63: Data Table on Fixed wing - Year-over-year growth 2023-2028 (%)
    • 7.4 Rotary wing - Market size and forecast 2023-2028
      • Exhibit 64: Chart on Rotary wing - Market size and forecast 2023-2028 ($ million)
      • Exhibit 65: Data Table on Rotary wing - Market size and forecast 2023-2028 ($ million)
      • Exhibit 66: Chart on Rotary wing - Year-over-year growth 2023-2028 (%)
      • Exhibit 67: Data Table on Rotary wing - Year-over-year growth 2023-2028 (%)
    • 7.5 Market opportunity by Platform
      • Exhibit 68: Market opportunity by Platform ($ million)
      • Exhibit 69: Data Table on Market opportunity by Platform ($ million)

    8 Customer Landscape

    • 8.1 Customer landscape overview
      • Exhibit 70: Analysis of price sensitivity, lifecycle, customer purchase basket, adoption rates, and purchase criteria

    9 Geographic Landscape

    • 9.1 Geographic segmentation
      • Exhibit 71: Chart on Market share by geography 2023-2028 (%)
      • Exhibit 72: Data Table on Market share by geography 2023-2028 (%)
    • 9.2 Geographic comparison
      • Exhibit 73: Chart on Geographic comparison
      • Exhibit 74: Data Table on Geographic comparison
    • 9.3 North America - Market size and forecast 2023-2028
      • Exhibit 75: Chart on North America - Market size and forecast 2023-2028 ($ million)
      • Exhibit 76: Data Table on North America - Market size and forecast 2023-2028 ($ million)
      • Exhibit 77: Chart on North America - Year-over-year growth 2023-2028 (%)
      • Exhibit 78: Data Table on North America - Year-over-year growth 2023-2028 (%)
    • 9.4 Europe - Market size and forecast 2023-2028
      • Exhibit 79: Chart on Europe - Market size and forecast 2023-2028 ($ million)
      • Exhibit 80: Data Table on Europe - Market size and forecast 2023-2028 ($ million)
      • Exhibit 81: Chart on Europe - Year-over-year growth 2023-2028 (%)
      • Exhibit 82: Data Table on Europe - Year-over-year growth 2023-2028 (%)
    • 9.5 APAC - Market size and forecast 2023-2028
      • Exhibit 83: Chart on APAC - Market size and forecast 2023-2028 ($ million)
      • Exhibit 84: Data Table on APAC - Market size and forecast 2023-2028 ($ million)
      • Exhibit 85: Chart on APAC - Year-over-year growth 2023-2028 (%)
      • Exhibit 86: Data Table on APAC - Year-over-year growth 2023-2028 (%)
    • 9.6 South America - Market size and forecast 2023-2028
      • Exhibit 87: Chart on South America - Market size and forecast 2023-2028 ($ million)
      • Exhibit 88: Data Table on South America - Market size and forecast 2023-2028 ($ million)
      • Exhibit 89: Chart on South America - Year-over-year growth 2023-2028 (%)
      • Exhibit 90: Data Table on South America - Year-over-year growth 2023-2028 (%)
    • 9.7 Middle East and Africa - Market size and forecast 2023-2028
      • Exhibit 91: Chart on Middle East and Africa - Market size and forecast 2023-2028 ($ million)
      • Exhibit 92: Data Table on Middle East and Africa - Market size and forecast 2023-2028 ($ million)
      • Exhibit 93: Chart on Middle East and Africa - Year-over-year growth 2023-2028 (%)
      • Exhibit 94: Data Table on Middle East and Africa - Year-over-year growth 2023-2028 (%)
    • 9.8 US - Market size and forecast 2023-2028
      • Exhibit 95: Chart on US - Market size and forecast 2023-2028 ($ million)
      • Exhibit 96: Data Table on US - Market size and forecast 2023-2028 ($ million)
      • Exhibit 97: Chart on US - Year-over-year growth 2023-2028 (%)
      • Exhibit 98: Data Table on US - Year-over-year growth 2023-2028 (%)
    • 9.9 China - Market size and forecast 2023-2028
      • Exhibit 99: Chart on China - Market size and forecast 2023-2028 ($ million)
      • Exhibit 100: Data Table on China - Market size and forecast 2023-2028 ($ million)
      • Exhibit 101: Chart on China - Year-over-year growth 2023-2028 (%)
      • Exhibit 102: Data Table on China - Year-over-year growth 2023-2028 (%)
    • 9.10 UK - Market size and forecast 2023-2028
      • Exhibit 103: Chart on UK - Market size and forecast 2023-2028 ($ million)
      • Exhibit 104: Data Table on UK - Market size and forecast 2023-2028 ($ million)
      • Exhibit 105: Chart on UK - Year-over-year growth 2023-2028 (%)
      • Exhibit 106: Data Table on UK - Year-over-year growth 2023-2028 (%)
    • 9.11 France - Market size and forecast 2023-2028
      • Exhibit 107: Chart on France - Market size and forecast 2023-2028 ($ million)
      • Exhibit 108: Data Table on France - Market size and forecast 2023-2028 ($ million)
      • Exhibit 109: Chart on France - Year-over-year growth 2023-2028 (%)
      • Exhibit 110: Data Table on France - Year-over-year growth 2023-2028 (%)
    • 9.12 Canada - Market size and forecast 2023-2028
      • Exhibit 111: Chart on Canada - Market size and forecast 2023-2028 ($ million)
      • Exhibit 112: Data Table on Canada - Market size and forecast 2023-2028 ($ million)
      • Exhibit 113: Chart on Canada - Year-over-year growth 2023-2028 (%)
      • Exhibit 114: Data Table on Canada - Year-over-year growth 2023-2028 (%)
    • 9.13 Market opportunity by geography
      • Exhibit 115: Market opportunity by geography ($ million)
      • Exhibit 116: Data Tables on Market opportunity by geography ($ million)

    10 Drivers, Challenges, and Trends

    • 10.1 Market drivers
      • 10.2 Market challenges
        • 10.3 Impact of drivers and challenges
          • Exhibit 117: Impact of drivers and challenges in 2023 and 2028
        • 10.4 Market trends

          11 Vendor Landscape

          • 11.1 Overview
            • 11.2 Vendor landscape
              • Exhibit 118: Overview on Criticality of inputs and Factors of differentiation
            • 11.3 Landscape disruption
              • Exhibit 119: Overview on factors of disruption
            • 11.4 Industry risks
              • Exhibit 120: Impact of key risks on business

            12 Vendor Analysis

            • 12.1 Vendors covered
              • Exhibit 121: Vendors covered
            • 12.2 Market positioning of vendors
              • Exhibit 122: Matrix on vendor position and classification
            • 12.3 Astronics Corp.
              • Exhibit 123: Astronics Corp. - Overview
              • Exhibit 124: Astronics Corp. - Business segments
              • Exhibit 125: Astronics Corp. - Key offerings
              • Exhibit 126: Astronics Corp. - Segment focus
            • 12.4 BAE Systems Plc
              • Exhibit 127: BAE Systems Plc - Overview
              • Exhibit 128: BAE Systems Plc - Business segments
              • Exhibit 129: BAE Systems Plc - Key offerings
              • Exhibit 130: BAE Systems Plc - Segment focus
            • 12.5 Elbit Systems Ltd.
              • Exhibit 131: Elbit Systems Ltd. - Overview
              • Exhibit 132: Elbit Systems Ltd. - Product / Service
              • Exhibit 133: Elbit Systems Ltd. - Key offerings
            • 12.6 Honeywell International Inc.
              • Exhibit 134: Honeywell International Inc. - Overview
              • Exhibit 135: Honeywell International Inc. - Business segments
              • Exhibit 136: Honeywell International Inc. - Key news
              • Exhibit 137: Honeywell International Inc. - Key offerings
              • Exhibit 138: Honeywell International Inc. - Segment focus
            • 12.7 Industrial Vision Systems Ltd.
              • Exhibit 139: Industrial Vision Systems Ltd. - Overview
              • Exhibit 140: Industrial Vision Systems Ltd. - Product / Service
              • Exhibit 141: Industrial Vision Systems Ltd. - Key offerings
            • 12.8 Kawasaki Heavy Industries Ltd.
              • Exhibit 142: Kawasaki Heavy Industries Ltd. - Overview
              • Exhibit 143: Kawasaki Heavy Industries Ltd. - Business segments
              • Exhibit 144: Kawasaki Heavy Industries Ltd. - Key news
              • Exhibit 145: Kawasaki Heavy Industries Ltd. - Key offerings
              • Exhibit 146: Kawasaki Heavy Industries Ltd. - Segment focus
            • 12.9 Keyence India Pvt. Ltd.
              • Exhibit 147: Keyence India Pvt. Ltd. - Overview
              • Exhibit 148: Keyence India Pvt. Ltd. - Product / Service
              • Exhibit 149: Keyence India Pvt. Ltd. - Key offerings
            • 12.10 Mercury Systems Inc.
              • Exhibit 150: Mercury Systems Inc. - Overview
              • Exhibit 151: Mercury Systems Inc. - Product / Service
              • Exhibit 152: Mercury Systems Inc. - Key offerings
            • 12.11 Raytheon Technologies Corp.
              • Exhibit 153: Raytheon Technologies Corp. - Overview
              • Exhibit 154: Raytheon Technologies Corp. - Business segments
              • Exhibit 155: Raytheon Technologies Corp. - Key news
              • Exhibit 156: Raytheon Technologies Corp. - Key offerings
              • Exhibit 157: Raytheon Technologies Corp. - Segment focus
            • 12.12 Rotorcraft Services Group
              • Exhibit 158: Rotorcraft Services Group - Overview
              • Exhibit 159: Rotorcraft Services Group - Product / Service
              • Exhibit 160: Rotorcraft Services Group - Key offerings
            • 12.13 Samvardhana Motherson International Ltd.
              • Exhibit 161: Samvardhana Motherson International Ltd. - Overview
              • Exhibit 162: Samvardhana Motherson International Ltd. - Business segments
              • Exhibit 163: Samvardhana Motherson International Ltd. - Key news
              • Exhibit 164: Samvardhana Motherson International Ltd. - Key offerings
              • Exhibit 165: Samvardhana Motherson International Ltd. - Segment focus
            • 12.14 SOLOMON TECHNOLOGY CORP.
              • Exhibit 166: SOLOMON TECHNOLOGY CORP. - Overview
              • Exhibit 167: SOLOMON TECHNOLOGY CORP. - Product / Service
              • Exhibit 168: SOLOMON TECHNOLOGY CORP. - Key offerings
            • 12.15 Techman Robot Inc.
              • Exhibit 169: Techman Robot Inc. - Overview
              • Exhibit 170: Techman Robot Inc. - Product / Service
              • Exhibit 171: Techman Robot Inc. - Key offerings
            • 12.16 Thales Group
              • Exhibit 172: Thales Group - Overview
              • Exhibit 173: Thales Group - Business segments
              • Exhibit 174: Thales Group - Key news
              • Exhibit 175: Thales Group - Key offerings
              • Exhibit 176: Thales Group - Segment focus
            • 12.17 Vision Components GmbH
              • Exhibit 177: Vision Components GmbH - Overview
              • Exhibit 178: Vision Components GmbH - Product / Service
              • Exhibit 179: Vision Components GmbH - Key offerings

            13 Appendix

            • 13.1 Scope of the report
              • 13.2 Inclusions and exclusions checklist
                • Exhibit 180: Inclusions checklist
                • Exhibit 181: Exclusions checklist
              • 13.3 Currency conversion rates for US$
                • Exhibit 182: Currency conversion rates for US$
              • 13.4 Research methodology
                • Exhibit 183: Research methodology
                • Exhibit 184: Validation techniques employed for market sizing
                • Exhibit 185: Information sources
              • 13.5 List of abbreviations
                • Exhibit 186: List of abbreviations

              Research Methodology

              Technavio presents a detailed picture of the market by way of study, synthesis, and summation of data from multiple sources. The analysts have presented the various facets of the market with a particular focus on identifying the key industry influencers. The data thus presented is comprehensive, reliable, and the result of extensive research, both primary and secondary.

              INFORMATION SOURCES

              Primary sources

              • Manufacturers and suppliers
              • Channel partners
              • Industry experts
              • Strategic decision makers

              Secondary sources

              • Industry journals and periodicals
              • Government data
              • Financial reports of key industry players
              • Historical data
              • Press releases

              DATA ANALYSIS

              Data Synthesis

              • Collation of data
              • Estimation of key figures
              • Analysis of derived insights

              Data Validation

              • Triangulation with data models
              • Reference against proprietary databases
              • Corroboration with industry experts

              REPORT WRITING

              Qualitative

              • Market drivers
              • Market challenges
              • Market trends
              • Five forces analysis

              Quantitative

              • Market size and forecast
              • Market segmentation
              • Geographical insights
              • Competitive landscape

              Interested in this report?

              Get your sample now to see our research methodology and insights!

              Download Now

              Frequently Asked Questions

              Enhanced Vision System market growth will increase by $ 68.32 mn during 2024-2028.

              The Enhanced Vision System market is expected to grow at a CAGR of 4.52% during 2024-2028.

              Enhanced Vision System market is segmented by Component( Display, Camera, Control electronics, Processing units, Sensors) Platform( Fixed wing, Rotary wing)

              Astronics Corp., BAE Systems Plc, Elbit Systems Ltd., Honeywell International Inc., Industrial Vision Systems Ltd., Kawasaki Heavy Industries Ltd., Keyence India Pvt. Ltd., Konica Minolta Inc., Mercury Systems Inc., Raytheon Technologies Corp., Robert Bosch GmbH, Rosenbauer International AG, Rotorcraft Services Group, Samvardhana Motherson International Ltd., SOLOMON TECHNOLOGY CORP., Techman Robot Inc., Thales Group, Vision Components GmbH, Zebra Technologies Corp., Skeyes are a few of the key vendors in the Enhanced Vision System market.

              North America will register the highest growth rate of 35% among the other regions. Therefore, the Enhanced Vision System market in North America is expected to garner significant business opportunities for the vendors during the forecast period.

              US, Canada, China, UK, France

              • Expanding applications of EVS in maritime navigation is the driving factor this market.
              • mining and extraction is the driving factor this market.
              • and healthcareThe application of EVSs (EVS) has extended beyond its traditional use in the aviation industry is the driving factor this market.
              • and it is now being adopted in various sectors is the driving factor this market.
              • such as maritime navigation is the driving factor this market.
              • mining and extraction is the driving factor this market.
              • and healthcare. This expansion of applications has positioned EVS as a significant driver in the global EVS market. In maritime navigation is the driving factor this market.
              • EVS plays a crucial role in improving the safety and efficiency of ship operations. By combining advanced sensors is the driving factor this market.
              • real-time data processing is the driving factor this market.
              • and image enhancement technologies is the driving factor this market.
              • EVS enables better visibility in adverse weather conditions is the driving factor this market.
              • low-light environments is the driving factor this market.
              • and areas with poor visibility. This enhanced vision aids ship captains and crews in detecting obstacles is the driving factor this market.
              • identifying navigation markers is the driving factor this market.
              • and maneuvering vessels with increased accuracy is the driving factor this market.
              • thus reducing the risk of accidents and improving overall maritime operations. Similarly is the driving factor this market.
              • the mining and extraction industry has embraced EVS as a valuable tool for enhancing operational visibility and safety in challenging environments. Mining operations often involve hazardous conditions and limited visibility due to dust is the driving factor this market.
              • smoke is the driving factor this market.
              • or darkness. EVS systems equipped with thermal imaging and infrared sensors can penetrate these obstructions is the driving factor this market.
              • providing real-time visual data to operators. This information allows them to monitor movements is the driving factor this market.
              • identify potential hazards is the driving factor this market.
              • and optimize their extraction processes is the driving factor this market.
              • leading to improved efficiency is the driving factor this market.
              • reduced downtime is the driving factor this market.
              • and enhanced worker safety. In the healthcare sector is the driving factor this market.
              • EVS has paved the way for advanced clinical applications and surgical procedures. Surgeons can utilize EVS to enhance their visual perception during complex operations by integrating real-time imaging is the driving factor this market.
              • augmented reality is the driving factor this market.
              • and data overlays. This technology provides surgeons with detailed visual guidance is the driving factor this market.
              • accurate depth perception is the driving factor this market.
              • and enhanced visualization of anatomical structures. As a result is the driving factor this market.
              • EVS-assisted surgeries enable minimally invasive procedures is the driving factor this market.
              • precise targeting is the driving factor this market.
              • and improved patient outcomes. The expanding applications of EVS in these sectors have contributed significantly to the growth of the global EVS market. The increasing demand for safety is the driving factor this market.
              • efficiency is the driving factor this market.
              • and precision across maritime navigation is the driving factor this market.
              • mining and extraction is the driving factor this market.
              • and healthcare industries has driven the adoption of EVS technologies. As a result is the driving factor this market.
              • companies specializing in EVS solutions have witnessed substantial market opportunities and have been developing innovative systems tailored to the specific needs of these industries. The maritime navigation is the driving factor this market.
              • mining and extraction is the driving factor this market.
              • and healthcare sectors have recognized the benefits of EVS in improving safety is the driving factor this market.
              • efficiency is the driving factor this market.
              • and precision is the driving factor this market.
              • which is the driving factor this market.
              • in turn is the driving factor this market.
              • will drive the growth of the global EVS market during the forecast period. is the driving factor this market.

              The Enhanced Vision System market vendors should focus on grabbing business opportunities from the Display segment as it accounted for the largest market share in the base year.