Magnetic Materials Market Analysis, Size, and Forecast 2026-2030: APAC (China, Japan, and India), North America (US, Canada, and Mexico), Europe (Germany, UK, and France), South America (Brazil and Argentina), Middle East and Africa (Saudi Arabia, UAE, and South Africa), and Rest of World (ROW)

Magnetic Materials Market Analysis, Size, and Forecast 2026-2030:
APAC (China, Japan, and India), North America (US, Canada, and Mexico), Europe (Germany, UK, and France), South America (Brazil and Argentina), Middle East and Africa (Saudi Arabia, UAE, and South Africa), and Rest of World (ROW)

Published: Apr 2026 307 Pages SKU: IRTNTR44816

Market Overview at a Glance

$16.68 B
Market Opportunity
7.1%
CAGR 2025 - 2030
48.8%
APAC Growth
$14.16 B
Automotive and transportation segment 2024

Magnetic Materials Market Size 2026-2030

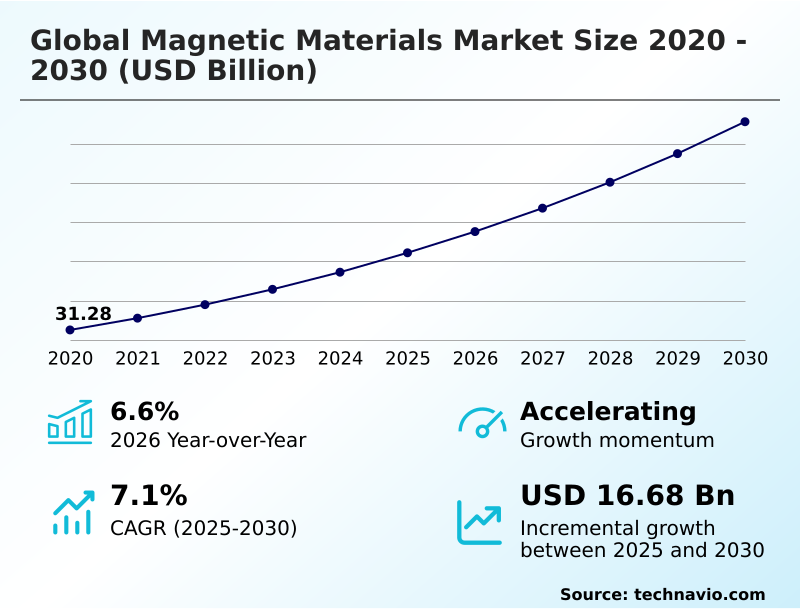
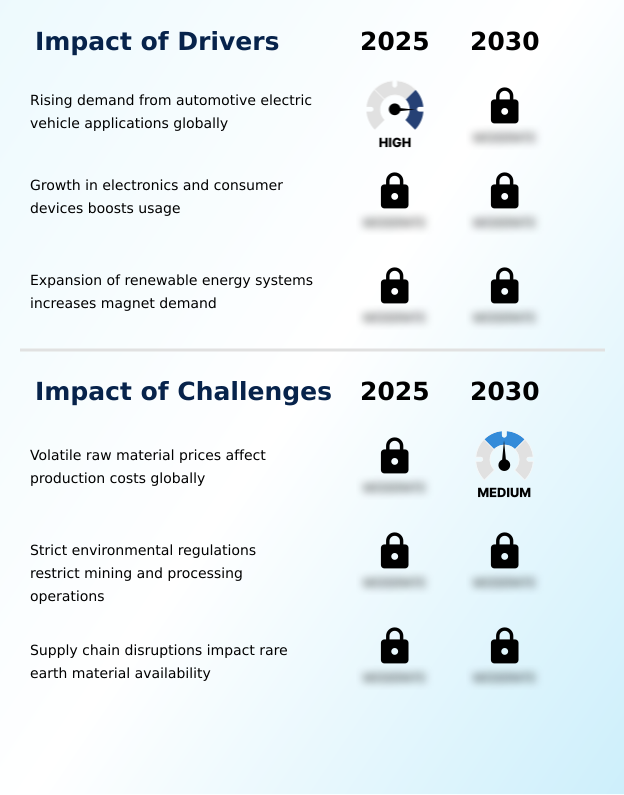
The magnetic materials market size is valued to increase by USD 16.68 billion, at a CAGR of 7.1% from 2025 to 2030. Rising demand from automotive electric vehicle applications globally will drive the magnetic materials market.

Major Market Trends & Insights

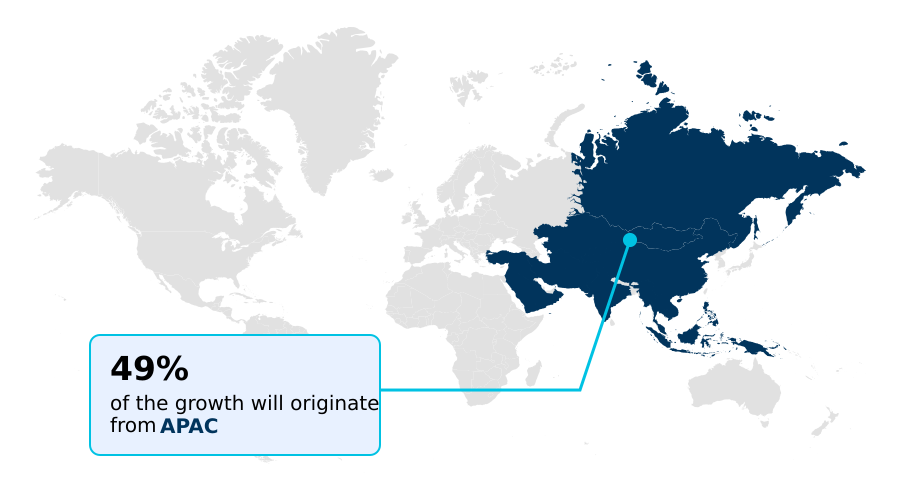
  • APAC dominated the market and accounted for a 48.8% growth during the forecast period.
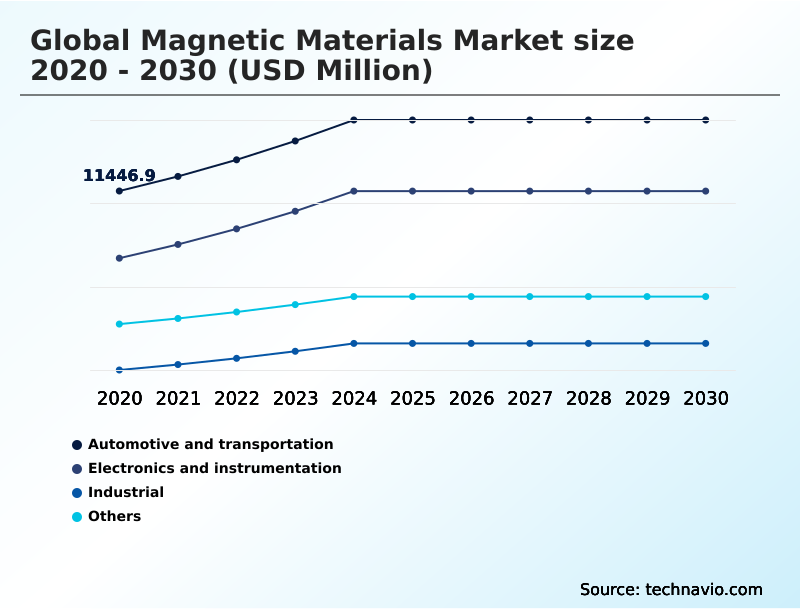
  • By Application - Automotive and transportation segment was valued at USD 14.16 billion in 2024
  • By Product - Hard magnetic materials segment accounted for the largest market revenue share in 2024

Market Size & Forecast

  • Market Opportunities: USD 26.51 billion
  • Market Future Opportunities: USD 16.68 billion
  • CAGR from 2025 to 2030 : 7.1%

Market Summary

  • The magnetic materials market is undergoing significant evolution, driven by demand from high-technology sectors. These materials are fundamental to modern engineering, enabling energy conversion, signal processing, and electromechanical functions in applications from electric vehicles to renewable energy systems. A key driver is the pursuit of higher efficiency, which relies on materials with superior magnetic permeability and low hysteresis loss.
  • Innovations in powder metallurgy processing and grain boundary engineering are leading to materials with enhanced properties. For instance, a logistics company optimizing its automated warehouse robotics can achieve operational gains by using motors with high-performance sintered magnets, reducing energy consumption per task.
  • However, the market also contends with supply chain vulnerabilities, particularly concerning rare earth elements, which are critical for high-strength permanent magnets. This dynamic pushes research toward developing alternative materials and robust recycling methods to ensure supply stability and manage costs, shaping the industry's strategic direction.

What will be the Size of the Magnetic Materials Market during the forecast period?

Get Key Insights on Market Forecast (PDF) Get Free Sample

How is the Magnetic Materials Market Segmented?

The magnetic materials industry research report provides comprehensive data (region-wise segment analysis), with forecasts and estimates in "USD million" for the period 2026-2030, as well as historical data from 2020-2024 for the following segments.

  • Application
    • Automotive and transportation
    • Electronics and instrumentation
    • Industrial
    • Others
  • Product
    • Hard magnetic materials
    • Soft magnetic materials
  • Material
    • Neodymium-iron-boron (NdFeB)
    • Ferrite
    • Samarium-cobalt (SmCo)
    • Aluminum-nickel-cobalt (AlNiCo)
    • Others
  • Geography
    • APAC
      • China
      • Japan
      • India
    • North America
      • US
      • Canada
      • Mexico
    • Europe
      • Germany
      • UK
      • France
    • South America
      • Brazil
      • Argentina
    • Middle East and Africa
      • Saudi Arabia
      • UAE
      • South Africa
    • Rest of World (ROW)

By Application Insights

The automotive and transportation segment is estimated to witness significant growth during the forecast period.

The automotive and transportation segment's demand for magnetic materials is driven by the shift toward electrification. Electric vehicle (EV) powertrains depend on high-performance permanent magnet motors for optimal efficiency and torque density.

The use of advanced hard magnetic materials like neodymium-iron-boron in traction motors is standard, as they enhance performance and enable compact designs. Beyond motors, magnetic sensor technology is essential for modern vehicle safety and control systems.

Innovations in magnetic circuit design have led to efficiency improvements, with some motor configurations achieving a 15% increase in torque density optimization.

This reliance on specialized materials like sintered magnets and advancements in powder metallurgy processing underscores the segment's critical role in the market.

Get Free Sample

The Automotive and transportation segment was valued at USD 14.16 billion in 2024 and showed a gradual increase during the forecast period.

Get Free Sample

Regional Analysis

APAC is estimated to contribute 48.8% to the growth of the global market during the forecast period.Technavio’s analysts have elaborately explained the regional trends and drivers that shape the market during the forecast period.

See How Magnetic Materials Market Demand is Rising in APAC Get Free Sample

The geographic landscape of the magnetic materials market is characterized by regional specialization and strategic importance. APAC dominates production and consumption, driven by its massive electronics and automotive manufacturing sectors, and holds 48.8% of the market's incremental growth potential.

Countries in this region are central to the supply of rare earth elements and the production of high-performance neodymium-iron-boron magnets.

North America and Europe are significant markets focused on high-value applications in aerospace, medical technology, and automotive R&D, leveraging advanced materials like samarium-cobalt for their high-temperature resilience.

Investment in these regions is geared toward securing supply chains and fostering innovation in rare earth-free permanent magnets to mitigate geopolitical risks. The development of advanced magnetic materials is a global priority, essential for a wide range of modern technologies.

Market Dynamics

Our researchers analyzed the data with 2025 as the base year, along with the key drivers, trends, and challenges. A holistic analysis of drivers will help companies refine their marketing strategies to gain a competitive advantage.

  • The global magnetic materials market 2026-2030 is defined by complex technical and economic factors. A primary concern is the impact of raw material volatility on magnet pricing, which directly influences manufacturing costs for applications ranging from consumer electronics to industrial motors.
  • Decision-makers often weigh the high-temperature performance of alnico vs smco magnets for specialized aerospace or military applications, where thermal stability is paramount. The manufacturing processes for bonded neodymium magnets are being refined to offer greater design flexibility compared to their sintered counterparts.
  • Concurrently, the role of soft magnetic composites in power electronics is expanding, enabling more compact and efficient high-frequency devices. There is also a significant push toward advancements in rare earth free permanent magnets to alleviate supply chain pressures. This has intensified focus on challenges in recycling neodymium magnets from e-waste, a critical step for a circular economy.
  • In practice, comparing sintered vs bonded magnet applications reveals trade-offs between magnetic strength and manufacturability. For instance, supply chains integrating advanced recycling methods have demonstrated the potential to recover materials at a 25% lower energy cost than primary extraction, presenting a viable path to sustainability.

What are the key market drivers leading to the rise in the adoption of Magnetic Materials Industry?

  • The rising global demand from automotive electric vehicle applications is a key driver for the magnetic materials market.

  • The market is propelled by robust demand from key industrial sectors. The global push for electric mobility is a primary driver, as EVs rely on permanent magnet motors using materials like neodymium-iron-boron for high torque density and efficiency.
  • The expansion of renewable energy, particularly wind turbines, also fuels demand for large volumes of high-performance magnets, with new designs increasing energy conversion efficiency by 5%.
  • In consumer electronics, the need for miniaturization and improved performance in devices drives the consumption of compact, high-strength magnets.
  • The use of injection molding magnets and cryocooling systems in advanced industrial and scientific equipment further underscores the market's growth, where technologies like magnetoresistive random-access memory (MRAM) and spintronic devices are becoming more prevalent.

What are the market trends shaping the Magnetic Materials Industry?

  • The increasing adoption of rare magnetic materials, driven by their superior performance in high-tech applications, is a prominent market trend.

  • Key trends are shaping the magnetic materials market, driven by technological advancements and new applications. The adoption of AI is accelerating the discovery of novel materials, with simulations enabling the design of geometries that can reduce energy loss in magnetic cores by up to 15%. This has led to the development of components like high-frequency inductors with superior performance.
  • In the biomedical field, the use of magnetic nanocrystalline particles for targeted drug delivery and hyperthermia is expanding, leveraging the magnetocaloric effect for therapeutic benefit. Furthermore, there is a growing emphasis on recycling and the use of rare-earth-free materials, driving innovation in alloys with intermediate coercivity for applications in braking systems and sensors, where demagnetization resistance is key.

What challenges does the Magnetic Materials Industry face during its growth?

  • Volatile raw material prices, which globally affect production costs, present a key challenge to the industry's growth.

  • The magnetic materials market faces significant challenges related to supply chain volatility and stringent regulations. The prices of rare earth elements are subject to sharp fluctuations, which can increase production costs for permanent magnets by over 20% in a short period, impacting manufacturers' margins. This volatility makes long-term planning difficult.
  • Furthermore, strict environmental regulations on mining and processing increase operational costs and can delay projects. For example, compliance with new waste disposal protocols can add up to 10% to a project's capital expenditure.
  • These factors create pressure to develop alternative materials and improve recycling technologies, such as those for magnetic fluid hyperthermia applications, to ensure a stable and sustainable supply chain.

Exclusive Technavio Analysis on Customer Landscape

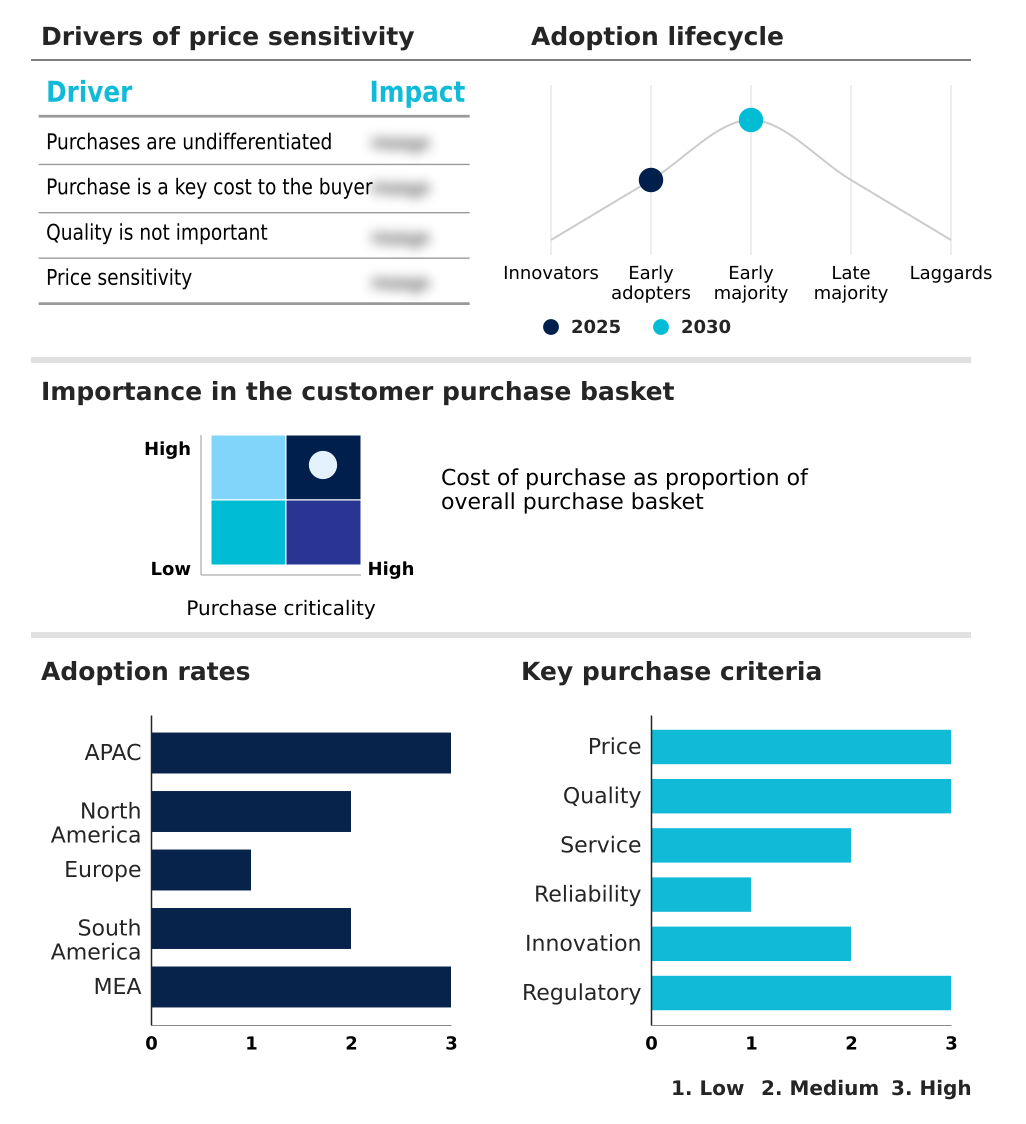
The magnetic materials market forecasting report includes the adoption lifecycle of the market, covering from the innovator’s stage to the laggard’s stage. It focuses on adoption rates in different regions based on penetration. Furthermore, the magnetic materials market report also includes key purchase criteria and drivers of price sensitivity to help companies evaluate and develop their market growth analysis strategies.

Customer Landscape of Magnetic Materials Industry

Competitive Landscape

Companies are implementing various strategies, such as strategic alliances, magnetic materials market forecast, partnerships, mergers and acquisitions, geographical expansion, and product/service launches, to enhance their presence in the industry.

Adams Magnetic Products Co. - Key offerings include high-performance rare earth, ceramic, and flexible magnetic materials, alongside custom-engineered magnetic assemblies for diverse industrial applications.

The industry research and growth report includes detailed analyses of the competitive landscape of the market and information about key companies, including:

  • Adams Magnetic Products Co.
  • Arnold Magnetic Technologies
  • Bunting Magnetics Co.
  • Daido Steel Co. Ltd.
  • Dexter Magnetic Technologies
  • Electron Energy Corp
  • Goudsmit Magnetics Groep BV
  • Hengdian Group DMEGC Magnetics
  • JL MAG Rare Earth Co. Ltd.
  • Lynas Rare Earths Ltd.
  • Mitsubishi Materials Corp.
  • Neo Performance Materials Inc.
  • Ningbo Jinji Strong Magnetic
  • Ningbo Yunsheng Co. Ltd.
  • Proterial Ltd.
  • Shin Etsu Chemical Co. Ltd.
  • TDK Corp.
  • Toshiba Materials Co. Ltd.
  • Vacuumschmelze GmbH and Co. KG

Qualitative and quantitative analysis of companies has been conducted to help clients understand the wider business environment as well as the strengths and weaknesses of key industry players. Data is qualitatively analyzed to categorize companies as pure play, category-focused, industry-focused, and diversified; it is quantitatively analyzed to categorize companies as dominant, leading, strong, tentative, and weak.

Recent Development and News in Magnetic materials market

  • In April, 2025, Tesla Inc. expanded its supply agreements for high-efficiency permanent magnets to support the increased production capacity of electric vehicles across its global manufacturing facilities.
  • In March, 2025, Siemens Gamesa Renewable Energy increased its procurement of permanent magnet materials to support the expansion of offshore wind projects across Europe and Asia.
  • In March, 2025, MP Materials reported increased input cost pressure in its supply chain update, highlighting ongoing volatility in rare earth pricing conditions affecting global magnet production economics.
  • In February, 2025, Samsung Electronics expanded its use of high-performance magnetic materials in next-generation audio and sensor systems for its premium smartphones, demonstrating a growing reliance on advanced magnet technology.

Dive into Technavio’s robust research methodology, blending expert interviews, extensive data synthesis, and validated models for unparalleled Magnetic Materials Market insights. See full methodology.

Market Scope
Page number 307
Base year 2025
Historic period 2020-2024
Forecast period 2026-2030
Growth momentum & CAGR Accelerate at a CAGR of 7.1%
Market growth 2026-2030 USD 16684.4 million
Market structure Fragmented
YoY growth 2025-2026(%) 6.6%
Key countries China, Japan, India, South Korea, Australia, Indonesia, US, Canada, Mexico, Germany, UK, France, Italy, Spain, The Netherlands, Brazil, Argentina, Chile, Saudi Arabia, UAE, South Africa, Israel and Turkey
Competitive landscape Leading Companies, Market Positioning of Companies, Competitive Strategies, and Industry Risks

Request Free Sample

Research Analyst Overview

  • The magnetic materials market is propelled by relentless innovation in material science, crucial for next-generation technologies. Core materials like neodymium-iron-boron, ferrite magnets, and samarium-cobalt are fundamental to applications demanding high performance. The industry's focus is on enhancing properties such as magnetic permeability, coercivity, and remanence while minimizing hysteresis loss and eddy current loss.
  • Advances in grain boundary engineering and the development of nanocrystalline materials are pushing performance boundaries. For boardroom considerations, the volatility of rare earth elements sourcing presents a significant strategic challenge, directly impacting product roadmaps and budgeting. Companies are mitigating this by exploring amorphous alloys and electrical steel alternatives.
  • For instance, a shift to optimized soft magnetic materials in industrial transformers has been shown to reduce energy waste by up to 12%. The development of materials with superior flux density, magnetostriction control, and high Curie temperature remains a key R&D focus, directly influencing the efficiency and viability of future products.

What are the Key Data Covered in this Magnetic Materials Market Research and Growth Report?

  • What is the expected growth of the Magnetic Materials Market between 2026 and 2030?

    • USD 16.68 billion, at a CAGR of 7.1%

  • What segmentation does the market report cover?

    • The report is segmented by Application (Automotive and transportation, Electronics and instrumentation, Industrial, and Others), Product (Hard magnetic materials, and Soft magnetic materials), Material (Neodymium-iron-boron (NdFeB), Ferrite, Samarium-cobalt (SmCo), Aluminum-nickel-cobalt (AlNiCo), and Others) and Geography (APAC, North America, Europe, South America, Middle East and Africa)

  • Which regions are analyzed in the report?

    • APAC, North America, Europe, South America and Middle East and Africa

  • What are the key growth drivers and market challenges?

    • Rising demand from automotive electric vehicle applications globally, Volatile raw material prices affect production costs globally

  • Who are the major players in the Magnetic Materials Market?

    • Adams Magnetic Products Co., Arnold Magnetic Technologies, Bunting Magnetics Co., Daido Steel Co. Ltd., Dexter Magnetic Technologies, Electron Energy Corp, Goudsmit Magnetics Groep BV, Hengdian Group DMEGC Magnetics, JL MAG Rare Earth Co. Ltd., Lynas Rare Earths Ltd., Mitsubishi Materials Corp., Neo Performance Materials Inc., Ningbo Jinji Strong Magnetic, Ningbo Yunsheng Co. Ltd., Proterial Ltd., Shin Etsu Chemical Co. Ltd., TDK Corp., Toshiba Materials Co. Ltd. and Vacuumschmelze GmbH and Co. KG

Market Research Insights

  • The market's dynamics are shaped by the dual demands of performance and efficiency, with innovations in magnetic core efficiency enabling significant operational gains. Advanced magnetic materials are integral to technologies where high-frequency inductors and effective electromagnetic shielding are critical.
  • For instance, the adoption of soft magnetic composites in power electronics has been shown to reduce core losses by up to 30%, directly impacting energy consumption. Concurrently, the use of specialized components like Hall effect sensors is growing, with some industrial automation systems reporting a 20% improvement in positional accuracy.
  • This drive for precision and efficiency highlights the market's focus on material science advancements to meet the stringent requirements of modern applications, balancing performance with sustainability and cost-effectiveness.

We can help! Our analysts can customize this magnetic materials market research report to meet your requirements.

Get in touch

1. Executive Summary

1.1 Market overview

Executive Summary - Chart on Market Overview
Executive Summary - Data Table on Market Overview
Executive Summary - Chart on Global Market Characteristics
Executive Summary - Chart on Market by Geography
Executive Summary - Chart on Market Segmentation by Application
Executive Summary - Chart on Market Segmentation by Product
Executive Summary - Chart on Market Segmentation by Material
Executive Summary - Chart on Incremental Growth
Executive Summary - Data Table on Incremental Growth
Executive Summary - Chart on Company Market Positioning

2. Technavio Analysis

2.1 Analysis of price sensitivity, lifecycle, customer purchase basket, adoption rates, and purchase criteria

2.2 Criticality of inputs and Factors of differentiation

Chart on Overview on criticality of inputs and factors of differentiation

2.3 Factors of disruption

Chart on Overview on factors of disruption

2.4 Impact of drivers and challenges

Chart on Impact of drivers and challenges in 2025 and 2030

3. Market Landscape

3.1 Market ecosystem

Chart on Parent Market
Data Table on - Parent Market

3.2 Market characteristics

Chart on Market characteristics analysis

3.3 Value chain analysis

Chart on Value chain analysis

4. Market Sizing

4.1 Market definition

Data Table on Offerings of companies included in the market definition

4.2 Market segment analysis

Market segments

4.3 Market size 2025

4.4 Market outlook: Forecast for 2025-2030

Chart on Global - Market size and forecast 2025-2030 ($ million)
Data Table on Global - Market size and forecast 2025-2030 ($ million)
Chart on Global Market: Year-over-year growth 2025-2030 (%)
Data Table on Global Market: Year-over-year growth 2025-2030 (%)

5. Historic Market Size

5.1 Global Magnetic Materials Market 2020 - 2024

Historic Market Size - Data Table on Global Magnetic Materials Market 2020 - 2024 ($ million)

5.2 Application segment analysis 2020 - 2024

Historic Market Size - Application Segment 2020 - 2024 ($ million)

5.3 Product segment analysis 2020 - 2024

Historic Market Size - Product Segment 2020 - 2024 ($ million)

5.4 Material segment analysis 2020 - 2024

Historic Market Size - Material Segment 2020 - 2024 ($ million)

5.5 Geography segment analysis 2020 - 2024

Historic Market Size - Geography Segment 2020 - 2024 ($ million)

5.6 Country segment analysis 2020 - 2024

Historic Market Size - Country Segment 2020 - 2024 ($ million)

6. Qualitative Analysis

6.1 Impact of AI in the Global Magnetic Materials Market

6.2 Impact of Geopolitical Conflicts on the Global Magnetic Materials Market

7. Five Forces Analysis

7.1 Five forces summary

Five forces analysis - Comparison between 2025 and 2030

7.2 Bargaining power of buyers

Bargaining power of buyers - Impact of key factors 2025 and 2030

7.3 Bargaining power of suppliers

Bargaining power of suppliers - Impact of key factors in 2025 and 2030

7.4 Threat of new entrants

Threat of new entrants - Impact of key factors in 2025 and 2030

7.5 Threat of substitutes

Threat of substitutes - Impact of key factors in 2025 and 2030

7.6 Threat of rivalry

Threat of rivalry - Impact of key factors in 2025 and 2030

7.7 Market condition

Chart on Market condition - Five forces 2025 and 2030

8. Market Segmentation by Application

8.1 Market segments

Chart on Application - Market share 2025-2030 (%)
Data Table on Application - Market share 2025-2030 (%)

8.2 Comparison by Application

Chart on Comparison by Application
Data Table on Comparison by Application

8.3 Automotive and transportation - Market size and forecast 2025-2030

Chart on Automotive and transportation - Market size and forecast 2025-2030 ($ million)
Data Table on Automotive and transportation - Market size and forecast 2025-2030 ($ million)
Chart on Automotive and transportation - Year-over-year growth 2025-2030 (%)
Data Table on Automotive and transportation - Year-over-year growth 2025-2030 (%)

8.4 Electronics and instrumentation - Market size and forecast 2025-2030

Chart on Electronics and instrumentation - Market size and forecast 2025-2030 ($ million)
Data Table on Electronics and instrumentation - Market size and forecast 2025-2030 ($ million)
Chart on Electronics and instrumentation - Year-over-year growth 2025-2030 (%)
Data Table on Electronics and instrumentation - Year-over-year growth 2025-2030 (%)

8.5 Industrial - Market size and forecast 2025-2030

Chart on Industrial - Market size and forecast 2025-2030 ($ million)
Data Table on Industrial - Market size and forecast 2025-2030 ($ million)
Chart on Industrial - Year-over-year growth 2025-2030 (%)
Data Table on Industrial - Year-over-year growth 2025-2030 (%)

8.6 Others - Market size and forecast 2025-2030

Chart on Others - Market size and forecast 2025-2030 ($ million)
Data Table on Others - Market size and forecast 2025-2030 ($ million)
Chart on Others - Year-over-year growth 2025-2030 (%)
Data Table on Others - Year-over-year growth 2025-2030 (%)

8.7 Market opportunity by Application

Market opportunity by Application ($ million)
Data Table on Market opportunity by Application ($ million)

9. Market Segmentation by Product

9.1 Market segments

Chart on Product - Market share 2025-2030 (%)
Data Table on Product - Market share 2025-2030 (%)

9.2 Comparison by Product

Chart on Comparison by Product
Data Table on Comparison by Product

9.3 Hard magnetic materials - Market size and forecast 2025-2030

Chart on Hard magnetic materials - Market size and forecast 2025-2030 ($ million)
Data Table on Hard magnetic materials - Market size and forecast 2025-2030 ($ million)
Chart on Hard magnetic materials - Year-over-year growth 2025-2030 (%)
Data Table on Hard magnetic materials - Year-over-year growth 2025-2030 (%)

9.4 Soft magnetic materials - Market size and forecast 2025-2030

Chart on Soft magnetic materials - Market size and forecast 2025-2030 ($ million)
Data Table on Soft magnetic materials - Market size and forecast 2025-2030 ($ million)
Chart on Soft magnetic materials - Year-over-year growth 2025-2030 (%)
Data Table on Soft magnetic materials - Year-over-year growth 2025-2030 (%)

9.5 Market opportunity by Product

Market opportunity by Product ($ million)
Data Table on Market opportunity by Product ($ million)

10. Market Segmentation by Material

10.1 Market segments

Chart on Material - Market share 2025-2030 (%)
Data Table on Material - Market share 2025-2030 (%)

10.2 Comparison by Material

Chart on Comparison by Material
Data Table on Comparison by Material

10.3 Neodymium-iron-boron (NdFeB) - Market size and forecast 2025-2030

Chart on Neodymium-iron-boron (NdFeB) - Market size and forecast 2025-2030 ($ million)
Data Table on Neodymium-iron-boron (NdFeB) - Market size and forecast 2025-2030 ($ million)
Chart on Neodymium-iron-boron (NdFeB) - Year-over-year growth 2025-2030 (%)
Data Table on Neodymium-iron-boron (NdFeB) - Year-over-year growth 2025-2030 (%)

10.4 Ferrite - Market size and forecast 2025-2030

Chart on Ferrite - Market size and forecast 2025-2030 ($ million)
Data Table on Ferrite - Market size and forecast 2025-2030 ($ million)
Chart on Ferrite - Year-over-year growth 2025-2030 (%)
Data Table on Ferrite - Year-over-year growth 2025-2030 (%)

10.5 Samarium-cobalt (SmCo) - Market size and forecast 2025-2030

Chart on Samarium-cobalt (SmCo) - Market size and forecast 2025-2030 ($ million)
Data Table on Samarium-cobalt (SmCo) - Market size and forecast 2025-2030 ($ million)
Chart on Samarium-cobalt (SmCo) - Year-over-year growth 2025-2030 (%)
Data Table on Samarium-cobalt (SmCo) - Year-over-year growth 2025-2030 (%)

10.6 Aluminum-nickel-cobalt (AlNiCo) - Market size and forecast 2025-2030

Chart on Aluminum-nickel-cobalt (AlNiCo) - Market size and forecast 2025-2030 ($ million)
Data Table on Aluminum-nickel-cobalt (AlNiCo) - Market size and forecast 2025-2030 ($ million)
Chart on Aluminum-nickel-cobalt (AlNiCo) - Year-over-year growth 2025-2030 (%)
Data Table on Aluminum-nickel-cobalt (AlNiCo) - Year-over-year growth 2025-2030 (%)

10.7 Others - Market size and forecast 2025-2030

Chart on Others - Market size and forecast 2025-2030 ($ million)
Data Table on Others - Market size and forecast 2025-2030 ($ million)
Chart on Others - Year-over-year growth 2025-2030 (%)
Data Table on Others - Year-over-year growth 2025-2030 (%)

10.8 Market opportunity by Material

Market opportunity by Material ($ million)
Data Table on Market opportunity by Material ($ million)

11. Customer Landscape

11.1 Customer landscape overview

Analysis of price sensitivity, lifecycle, customer purchase basket, adoption rates, and purchase criteria

12. Geographic Landscape

12.1 Geographic segmentation

Chart on Market share by geography 2025-2030 (%)
Data Table on Market share by geography 2025-2030 (%)

12.2 Geographic comparison

Chart on Geographic comparison
Data Table on Geographic comparison

12.3 APAC - Market size and forecast 2025-2030

Chart on APAC - Market size and forecast 2025-2030 ($ million)
Data Table on APAC - Market size and forecast 2025-2030 ($ million)
Chart on APAC - Year-over-year growth 2025-2030 (%)
Data Table on APAC - Year-over-year growth 2025-2030 (%)
Chart on Regional Comparison - APAC
Data Table on Regional Comparison - APAC

12.3.1 China - Market size and forecast 2025-2030

Chart on China - Market size and forecast 2025-2030 ($ million)
Data Table on China - Market size and forecast 2025-2030 ($ million)
Chart on China - Year-over-year growth 2025-2030 (%)
Data Table on China - Year-over-year growth 2025-2030 (%)

12.3.2 Japan - Market size and forecast 2025-2030

Chart on Japan - Market size and forecast 2025-2030 ($ million)
Data Table on Japan - Market size and forecast 2025-2030 ($ million)
Chart on Japan - Year-over-year growth 2025-2030 (%)
Data Table on Japan - Year-over-year growth 2025-2030 (%)

12.3.3 India - Market size and forecast 2025-2030

Chart on India - Market size and forecast 2025-2030 ($ million)
Data Table on India - Market size and forecast 2025-2030 ($ million)
Chart on India - Year-over-year growth 2025-2030 (%)
Data Table on India - Year-over-year growth 2025-2030 (%)

12.3.4 South Korea - Market size and forecast 2025-2030

Chart on South Korea - Market size and forecast 2025-2030 ($ million)
Data Table on South Korea - Market size and forecast 2025-2030 ($ million)
Chart on South Korea - Year-over-year growth 2025-2030 (%)
Data Table on South Korea - Year-over-year growth 2025-2030 (%)

12.3.5 Australia - Market size and forecast 2025-2030

Chart on Australia - Market size and forecast 2025-2030 ($ million)
Data Table on Australia - Market size and forecast 2025-2030 ($ million)
Chart on Australia - Year-over-year growth 2025-2030 (%)
Data Table on Australia - Year-over-year growth 2025-2030 (%)

12.3.6 Indonesia - Market size and forecast 2025-2030

Chart on Indonesia - Market size and forecast 2025-2030 ($ million)
Data Table on Indonesia - Market size and forecast 2025-2030 ($ million)
Chart on Indonesia - Year-over-year growth 2025-2030 (%)
Data Table on Indonesia - Year-over-year growth 2025-2030 (%)

12.4 North America - Market size and forecast 2025-2030

Chart on North America - Market size and forecast 2025-2030 ($ million)
Data Table on North America - Market size and forecast 2025-2030 ($ million)
Chart on North America - Year-over-year growth 2025-2030 (%)
Data Table on North America - Year-over-year growth 2025-2030 (%)
Chart on Regional Comparison - North America
Data Table on Regional Comparison - North America

12.4.1 US - Market size and forecast 2025-2030

Chart on US - Market size and forecast 2025-2030 ($ million)
Data Table on US - Market size and forecast 2025-2030 ($ million)
Chart on US - Year-over-year growth 2025-2030 (%)
Data Table on US - Year-over-year growth 2025-2030 (%)

12.4.2 Canada - Market size and forecast 2025-2030

Chart on Canada - Market size and forecast 2025-2030 ($ million)
Data Table on Canada - Market size and forecast 2025-2030 ($ million)
Chart on Canada - Year-over-year growth 2025-2030 (%)
Data Table on Canada - Year-over-year growth 2025-2030 (%)

12.4.3 Mexico - Market size and forecast 2025-2030

Chart on Mexico - Market size and forecast 2025-2030 ($ million)
Data Table on Mexico - Market size and forecast 2025-2030 ($ million)
Chart on Mexico - Year-over-year growth 2025-2030 (%)
Data Table on Mexico - Year-over-year growth 2025-2030 (%)

12.5 Europe - Market size and forecast 2025-2030

Chart on Europe - Market size and forecast 2025-2030 ($ million)
Data Table on Europe - Market size and forecast 2025-2030 ($ million)
Chart on Europe - Year-over-year growth 2025-2030 (%)
Data Table on Europe - Year-over-year growth 2025-2030 (%)
Chart on Regional Comparison - Europe
Data Table on Regional Comparison - Europe

12.5.1 Germany - Market size and forecast 2025-2030

Chart on Germany - Market size and forecast 2025-2030 ($ million)
Data Table on Germany - Market size and forecast 2025-2030 ($ million)
Chart on Germany - Year-over-year growth 2025-2030 (%)
Data Table on Germany - Year-over-year growth 2025-2030 (%)

12.5.2 UK - Market size and forecast 2025-2030

Chart on UK - Market size and forecast 2025-2030 ($ million)
Data Table on UK - Market size and forecast 2025-2030 ($ million)
Chart on UK - Year-over-year growth 2025-2030 (%)
Data Table on UK - Year-over-year growth 2025-2030 (%)

12.5.3 France - Market size and forecast 2025-2030

Chart on France - Market size and forecast 2025-2030 ($ million)
Data Table on France - Market size and forecast 2025-2030 ($ million)
Chart on France - Year-over-year growth 2025-2030 (%)
Data Table on France - Year-over-year growth 2025-2030 (%)

12.5.4 Italy - Market size and forecast 2025-2030

Chart on Italy - Market size and forecast 2025-2030 ($ million)
Data Table on Italy - Market size and forecast 2025-2030 ($ million)
Chart on Italy - Year-over-year growth 2025-2030 (%)
Data Table on Italy - Year-over-year growth 2025-2030 (%)

12.5.5 Spain - Market size and forecast 2025-2030

Chart on Spain - Market size and forecast 2025-2030 ($ million)
Data Table on Spain - Market size and forecast 2025-2030 ($ million)
Chart on Spain - Year-over-year growth 2025-2030 (%)
Data Table on Spain - Year-over-year growth 2025-2030 (%)

12.5.6 The Netherlands - Market size and forecast 2025-2030

Chart on The Netherlands - Market size and forecast 2025-2030 ($ million)
Data Table on The Netherlands - Market size and forecast 2025-2030 ($ million)
Chart on The Netherlands - Year-over-year growth 2025-2030 (%)
Data Table on The Netherlands - Year-over-year growth 2025-2030 (%)

12.6 South America - Market size and forecast 2025-2030

Chart on South America - Market size and forecast 2025-2030 ($ million)
Data Table on South America - Market size and forecast 2025-2030 ($ million)
Chart on South America - Year-over-year growth 2025-2030 (%)
Data Table on South America - Year-over-year growth 2025-2030 (%)
Chart on Regional Comparison - South America
Data Table on Regional Comparison - South America

12.6.1 Brazil - Market size and forecast 2025-2030

Chart on Brazil - Market size and forecast 2025-2030 ($ million)
Data Table on Brazil - Market size and forecast 2025-2030 ($ million)
Chart on Brazil - Year-over-year growth 2025-2030 (%)
Data Table on Brazil - Year-over-year growth 2025-2030 (%)

12.6.2 Argentina - Market size and forecast 2025-2030

Chart on Argentina - Market size and forecast 2025-2030 ($ million)
Data Table on Argentina - Market size and forecast 2025-2030 ($ million)
Chart on Argentina - Year-over-year growth 2025-2030 (%)
Data Table on Argentina - Year-over-year growth 2025-2030 (%)

12.6.3 Chile - Market size and forecast 2025-2030

Chart on Chile - Market size and forecast 2025-2030 ($ million)
Data Table on Chile - Market size and forecast 2025-2030 ($ million)
Chart on Chile - Year-over-year growth 2025-2030 (%)
Data Table on Chile - Year-over-year growth 2025-2030 (%)

12.7 Middle East and Africa - Market size and forecast 2025-2030

Chart on Middle East and Africa - Market size and forecast 2025-2030 ($ million)
Data Table on Middle East and Africa - Market size and forecast 2025-2030 ($ million)
Chart on Middle East and Africa - Year-over-year growth 2025-2030 (%)
Data Table on Middle East and Africa - Year-over-year growth 2025-2030 (%)
Chart on Regional Comparison - Middle East and Africa
Data Table on Regional Comparison - Middle East and Africa

12.7.1 Saudi Arabia - Market size and forecast 2025-2030

Chart on Saudi Arabia - Market size and forecast 2025-2030 ($ million)
Data Table on Saudi Arabia - Market size and forecast 2025-2030 ($ million)
Chart on Saudi Arabia - Year-over-year growth 2025-2030 (%)
Data Table on Saudi Arabia - Year-over-year growth 2025-2030 (%)

12.7.2 UAE - Market size and forecast 2025-2030

Chart on UAE - Market size and forecast 2025-2030 ($ million)
Data Table on UAE - Market size and forecast 2025-2030 ($ million)
Chart on UAE - Year-over-year growth 2025-2030 (%)
Data Table on UAE - Year-over-year growth 2025-2030 (%)

12.7.3 South Africa - Market size and forecast 2025-2030

Chart on South Africa - Market size and forecast 2025-2030 ($ million)
Data Table on South Africa - Market size and forecast 2025-2030 ($ million)
Chart on South Africa - Year-over-year growth 2025-2030 (%)
Data Table on South Africa - Year-over-year growth 2025-2030 (%)

12.7.4 Israel - Market size and forecast 2025-2030

Chart on Israel - Market size and forecast 2025-2030 ($ million)
Data Table on Israel - Market size and forecast 2025-2030 ($ million)
Chart on Israel - Year-over-year growth 2025-2030 (%)
Data Table on Israel - Year-over-year growth 2025-2030 (%)

12.7.5 Turkey - Market size and forecast 2025-2030

Chart on Turkey - Market size and forecast 2025-2030 ($ million)
Data Table on Turkey - Market size and forecast 2025-2030 ($ million)
Chart on Turkey - Year-over-year growth 2025-2030 (%)
Data Table on Turkey - Year-over-year growth 2025-2030 (%)

12.8 Market opportunity by geography

Market opportunity by geography ($ million)
Data Tables on Market opportunity by geography ($ million)

13. Drivers, Challenges, and Opportunity

13.1 Market drivers

Rising demand from automotive electric vehicle applications globally
Growth in electronics and consumer devices boosts usage
Expansion of renewable energy systems increases magnet demand

13.2 Market challenges

Volatile raw material prices affect production costs globally
Strict environmental regulations restrict mining and processing operations
Supply chain disruptions impact rare earth material availability

13.3 Impact of drivers and challenges

Impact of drivers and challenges in 2025 and 2030

13.4 Market opportunities

Increasing adoption of rare magnetic materials
Rising utilization of medical devices such as MRI scanners and X-ray machines,
Growing recycling and recovery of rare earth free materials

14. Competitive Landscape

14.1 Overview

14.2

Overview on criticality of inputs and factors of differentiation

14.3 Landscape disruption

Overview on factors of disruption

14.4 Industry risks

Impact of key risks on business

15. Competitive Analysis

15.1 Companies profiled

Companies covered

15.2 Company ranking index

15.3 Market positioning of companies

Matrix on companies position and classification

15.4 Adams Magnetic Products Co.

Adams Magnetic Products Co. - Overview
Adams Magnetic Products Co. - Product / Service
Adams Magnetic Products Co. - Key offerings
SWOT

15.5 Arnold Magnetic Technologies

Arnold Magnetic Technologies - Overview
Arnold Magnetic Technologies - Product / Service
Arnold Magnetic Technologies - Key offerings
SWOT

15.6 Bunting Magnetics Co.

Bunting Magnetics Co. - Overview
Bunting Magnetics Co. - Product / Service
Bunting Magnetics Co. - Key offerings
SWOT

15.7 Daido Steel Co. Ltd.

Daido Steel Co. Ltd. - Overview
Daido Steel Co. Ltd. - Business segments
Daido Steel Co. Ltd. - Key offerings
Daido Steel Co. Ltd. - Segment focus
SWOT

15.8 Goudsmit Magnetics Groep BV

Goudsmit Magnetics Groep BV - Overview
Goudsmit Magnetics Groep BV - Product / Service
Goudsmit Magnetics Groep BV - Key offerings
SWOT

15.9 Hengdian Group DMEGC Magnetics

Hengdian Group DMEGC Magnetics - Overview
Hengdian Group DMEGC Magnetics - Business segments
Hengdian Group DMEGC Magnetics - Key offerings
Hengdian Group DMEGC Magnetics - Segment focus
SWOT

15.10 JL MAG Rare Earth Co. Ltd.

JL MAG Rare Earth Co. Ltd. - Overview
JL MAG Rare Earth Co. Ltd. - Product / Service
JL MAG Rare Earth Co. Ltd. - Key offerings
SWOT

15.11 Lynas Rare Earths Ltd.

Lynas Rare Earths Ltd. - Overview
Lynas Rare Earths Ltd. - Product / Service
Lynas Rare Earths Ltd. - Key offerings
SWOT

15.12 Mitsubishi Materials Corp.

Mitsubishi Materials Corp. - Overview
Mitsubishi Materials Corp. - Business segments
Mitsubishi Materials Corp. - Key news
Mitsubishi Materials Corp. - Key offerings
Mitsubishi Materials Corp. - Segment focus
SWOT

15.13 Neo Performance Materials Inc.

Neo Performance Materials Inc. - Overview
Neo Performance Materials Inc. - Business segments
Neo Performance Materials Inc. - Key offerings
Neo Performance Materials Inc. - Segment focus
SWOT

15.14 Ningbo Yunsheng Co. Ltd.

Ningbo Yunsheng Co. Ltd. - Overview
Ningbo Yunsheng Co. Ltd. - Business segments
Ningbo Yunsheng Co. Ltd. - Key offerings
Ningbo Yunsheng Co. Ltd. - Segment focus
SWOT

15.15 Proterial Ltd.

Proterial Ltd. - Overview
Proterial Ltd. - Product / Service
Proterial Ltd. - Key offerings
SWOT

15.16 Shin Etsu Chemical Co. Ltd.

Shin Etsu Chemical Co. Ltd. - Overview
Shin Etsu Chemical Co. Ltd. - Business segments
Shin Etsu Chemical Co. Ltd. - Key offerings
Shin Etsu Chemical Co. Ltd. - Segment focus
SWOT

15.17 TDK Corp.

TDK Corp. - Overview
TDK Corp. - Business segments
TDK Corp. - Key offerings
TDK Corp. - Segment focus
SWOT

15.18 Vacuumschmelze GmbH and Co. KG

Vacuumschmelze GmbH and Co. KG - Overview
Vacuumschmelze GmbH and Co. KG - Product / Service
Vacuumschmelze GmbH and Co. KG - Key offerings
SWOT

16. Appendix

16.1 Scope of the report

Market definition
Objectives
Notes and caveats

16.2 Inclusions and exclusions checklist

Inclusions checklist
Exclusions checklist

16.3 Currency conversion rates for US$

16.4 Research methodology

16.5 Data procurement

Information sources

16.6 Data validation

16.7 Validation techniques employed for market sizing

16.8 Data synthesis

16.9 360 degree market analysis

16.10 List of abbreviations

Research Methodology

Technavio presents a detailed picture of the market by way of study, synthesis, and summation of data from multiple sources. The analysts have presented the various facets of the market with a particular focus on identifying the key industry influencers. The data thus presented is comprehensive, reliable, and the result of extensive research, both primary and secondary.

INFORMATION SOURCES

Primary sources

  • Manufacturers and suppliers
  • Channel partners
  • Industry experts
  • Strategic decision makers

Secondary sources

  • Industry journals and periodicals
  • Government data
  • Financial reports of key industry players
  • Historical data
  • Press releases

DATA ANALYSIS

Data Synthesis

  • Collation of data
  • Estimation of key figures
  • Analysis of derived insights

Data Validation

  • Triangulation with data models
  • Reference against proprietary databases
  • Corroboration with industry experts

REPORT WRITING

Qualitative

  • Market drivers
  • Market challenges
  • Market trends
  • Five forces analysis

Quantitative

  • Market size and forecast
  • Market segmentation
  • Geographical insights
  • Competitive landscape

Interested in this report?

Get your sample now to see our research methodology and insights!

Download Now

Frequently Asked Questions

Magnetic Materials market growth will increase by USD 16684.4 million during 2026-2030.

The Magnetic Materials market is expected to grow at a CAGR of 7.1% during 2026-2030.

Magnetic Materials market is segmented by Application (Automotive and transportation, Electronics and instrumentation, Industrial, Others) Product (Hard magnetic materials, Soft magnetic materials) Material (Neodymium-iron-boron (NdFeB), Ferrite, Samarium-cobalt (SmCo), Aluminum-nickel-cobalt (AlNiCo), Others)

Adams Magnetic Products Co., Arnold Magnetic Technologies, Bunting Magnetics Co., Daido Steel Co. Ltd., Dexter Magnetic Technologies, Electron Energy Corp, Goudsmit Magnetics Groep BV, Hengdian Group DMEGC Magnetics, JL MAG Rare Earth Co. Ltd., Lynas Rare Earths Ltd., Mitsubishi Materials Corp., Neo Performance Materials Inc., Ningbo Jinji Strong Magnetic, Ningbo Yunsheng Co. Ltd., Proterial Ltd., Shin Etsu Chemical Co. Ltd., TDK Corp., Toshiba Materials Co. Ltd., Vacuumschmelze GmbH and Co. KG are a few of the key vendors in the Magnetic Materials market.

APAC will register the highest growth rate of 48.8% among the other regions. Therefore, the Magnetic Materials market in APAC is expected to garner significant business opportunities for the vendors during the forecast period.

China, Japan, India, South Korea, Australia, Indonesia, US, Canada, Mexico, Germany, UK, France, Italy, Spain, The Netherlands, Brazil, Argentina, Chile, Saudi Arabia, UAE, South Africa, Israel, Turkey

  • Rising demand from automotive electric vehicle applications globally is the driving factor this market.

The Magnetic Materials market vendors should focus on grabbing business opportunities from the Application segment as it accounted for the largest market share in the base year.
RIA - Research AI Assistant
Ask RIA