Cobalt Market Size 2025-2029
The cobalt market size is forecast to increase by USD 9.17 billion at a CAGR of 12.9% between 2024 and 2029.
- The market is experiencing significant growth, driven primarily by the increasing adoption of electric vehicles (EVs) and their batteries, which rely heavily on cobalt for their production. The market is further fueled by the rising number of mining projects aimed at meeting the surging demand for this critical mineral. However, the market's growth trajectory is not without challenges. Regulatory hurdles, particularly those related to ethical sourcing and environmental concerns, impact adoption and pose a significant challenge. Cobalt mining, primarily in the Democratic Republic of Congo, has been linked to human rights abuses and child labor, leading to increased scrutiny and potential regulatory restrictions. The market is experiencing significant growth due to the expanding electric vehicle industry, which utilizes this mineral as a crucial component in lithium-ion batteries.
- Moreover, supply chain inconsistencies, including the lack of transparency and reliability, temper growth potential and add complexity to the market landscape. Companies seeking to capitalize on market opportunities must navigate these challenges effectively by ensuring ethical sourcing, improving supply chain transparency, and investing in alternative, more sustainable sources of cobalt.
What will be the Size of the Cobalt Market during the forecast period?

- The market is experiencing significant dynamics and trends, driven by the increasing demand for batteries in various industries. Cobalt, a crucial component in battery production, is under scrutiny due to sustainability concerns and the exploration of alternatives. Hydrometallurgical extraction and solvent extraction processes are gaining traction as potential cobalt supply chain solutions, while cobalt price forecasting remains a critical factor in the industry. Battery efficiency and performance are key considerations in the market, with the development of solid-state batteries and nickel-rich and manganese-rich cathodes. Recycling technologies and ethical cobalt sourcing are also essential as the industry addresses battery safety concerns and the issue of conflict minerals. Cobalt, a crucial element in various industries, has gained significant attention due to its essential role in battery production for renewable energy sources and electric vehicle.
- Cobalt reduction and substitution are ongoing efforts to mitigate sustainability issues and reduce reliance on primary mining. Cobalt purification and trading are integral to maintaining the quality and consistency of the supply chain. The future of the market hinges on the successful implementation of these trends and the continued innovation in battery technology. Cobalt-free batteries are a promising alternative, but their adoption remains limited due to battery life and consumption concerns. Leaching processes and regulatory frameworks for cobalt mining are also evolving to address sustainability and ethical sourcing issues. Overall, the market is undergoing transformative changes, driven by the need for sustainable and ethical battery production. Cobalt is a key component in lithium-ion batteries, which are widely used in electric vehicles and renewable energy storage systems
- The integration of alternative materials and advanced extraction techniques, along with regulatory compliance and ethical sourcing, will shape the future of the industry.
How is this Cobalt Industry segmented?
The cobalt industry research report provides comprehensive data (region-wise segment analysis), with forecasts and estimates in "USD million" for the period 2025-2029, as well as historical data from 2019-2023 for the following segments.
- Type
- Cobalt sulfate
- Cobalt oxide
- Cobalt metal
- Application
- Batteries and electronics
- Super alloys
- Pigments
- Hard materials
- Others
- Form Factor
- Chemical compound
- Metal
- Purchased scrap
- End-user
- Electronics
- Automotive
- Aerospace
- Medical
- Others
- Geography
- North America
- US
- Canada
- Europe
- Russia
- UK
- APAC
- Australia
- China
- India
- Japan
- South Korea
- South America
- Brazil
- Rest of World (ROW)
- North America
By Type Insights
The cobalt sulfate segment is estimated to witness significant growth during the forecast period. Cobalt, a critical component in the production of battery materials, particularly cobalt sulfate, plays a pivotal role in powering various industries. The electric vehicle sector's expansion, driven by consumer preferences for sustainable transportation and government incentives, significantly increases the demand for cobalt. Cobalt mining and mineral processing are essential for extracting this mineral, with geochemical exploration guiding mine development. However, resource scarcity and environmental regulations pose challenges to the industry. Cobalt sulfate, a primary cobalt compound used in lithium-ion batteries, is in high demand due to the growing electric vehicle market and the increasing production of consumer electronics. Additionally, cobalt-based superalloys are widely used In the aerospace and aircraft industries due to their high strength, corrosion resistance, and excellent mechanical properties.
Companies and governments are increasingly focusing on ESG considerations, driving innovation in cobalt production and supply chain management. Cobalt alloys and medical devices are other significant applications for this versatile metal. In the evolving cobalt industry landscape, stakeholders must navigate the complexities of resource extraction, supply chain management, and market dynamics. The industry's future outlook remains promising, with ongoing research and development efforts focused on improving cobalt extraction processes and exploring alternative battery technologies.
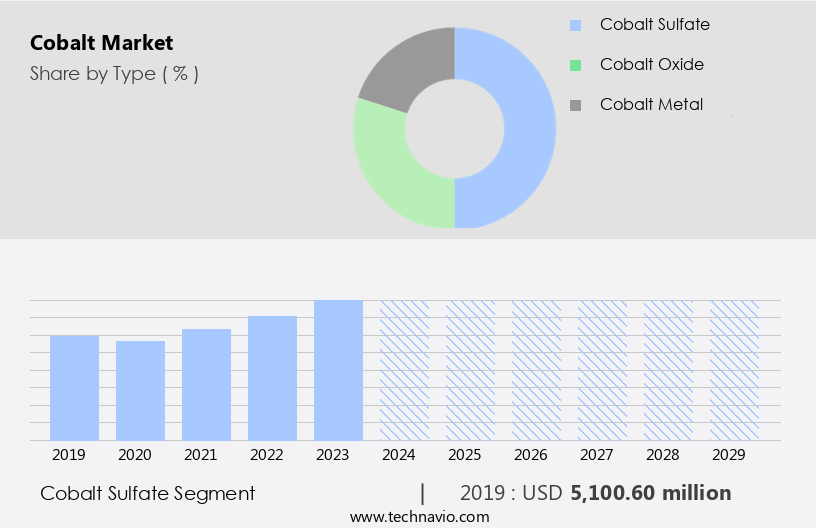
The Cobalt sulfate segment was valued at USD 5.1 billion in 2019 and showed a gradual increase during the forecast period. Infrastructure development, including transportation, construction, and urbanization, also contributes to the demand for cobalt sulfate-containing materials. Cobalt's applications extend beyond batteries, with its use in high-strength alloys, coatings, and catalysts in infrastructure components. The market experiences volatility due to price fluctuations and supply chain challenges. Responsible sourcing and recycling initiatives, such as battery recycling and hydrometallurgical processing, aim to mitigate these issues and promote a circular economy. Cobalt refining processes, including smelting and chemical processing, transform raw cobalt into battery-grade cobalt and other cobalt-based materials. Cobalt's role in sustainable technologies, such as electric vehicle batteries and renewable energy storage systems, underscores its importance in the transition towards a low-carbon economy. This strategic metal is also used in magnetic materials and high-strength alloys, coatings, and catalysts for infrastructure projects, such as transportation, construction, and urban development.
Regional Analysis
APAC is estimated to contribute 69% to the growth of the global market during the forecast period. Technavio's analysts have elaborately explained the regional trends and drivers that shape the market during the forecast period.
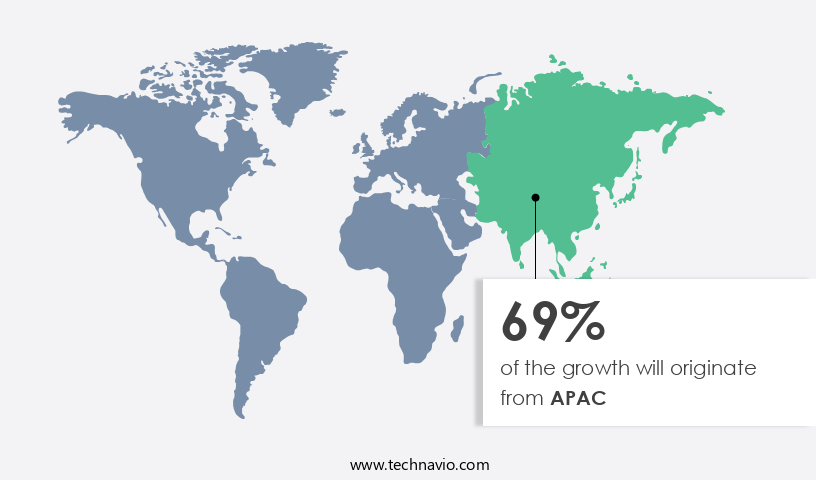
The electric vehicle (EV) production sector in the Asia Pacific (APAC) region, including countries like China, Japan, and South Korea, is witnessing a notable increase due to government incentives, environmental concerns, and technological advancements. This trend is driving up the demand for cobalt, an essential component in lithium-ion batteries used in EVs. Cobalt also finds applications in various industries such as aerospace, electronics, and construction, where it is used in super alloys and electronic devices. Additionally, cobalt is utilized in renewable energy technologies like wind turbines and solar panels as they gain popularity in APAC countries.
As these nations invest more in renewable energy to meet sustainability goals and reduce reliance on fossil fuels, the demand for cobalt continues to grow. Mining operations in countries like the Democratic Republic of Congo (DRC) and Australia are the primary sources of cobalt supply. However, resource scarcity and environmental regulations pose challenges to the mining industry. To address these concerns, responsible sourcing initiatives and mine development projects are underway. Cobalt reserves are being explored through geochemical methods, and mining companies are implementing hydrometallurgical processing and other metallurgical techniques for efficient cobalt extraction. Cobalt refining processes involve smelting and chemical processing to produce cobalt oxide and cobalt hydroxide, which are further used to manufacture cobalt cathode materials for batteries.
The battery manufacturing industry is a significant consumer of cobalt, with lithium-ion batteries being the primary application. The circular economy and ESG considerations are influencing the battery industry to focus on recycling and reusing cobalt from used batteries. Cobalt alloys and cobalt sulfate are other essential cobalt-based materials with applications in various industries. The market is known for its volatility due to factors such as supply chain management, geopolitical risks, and geological risks. The cobalt industry outlook remains positive, with ongoing research and innovation in battery technology and sustainable extraction methods.
Market Dynamics
Our researchers analyzed the data with 2024 as the base year, along with the key drivers, trends, and challenges. A holistic analysis of drivers will help companies refine their marketing strategies to gain a competitive advantage.
What are the Cobalt market drivers leading to the rise in the adoption of Industry?
- The electric vehicle industry's expansion is the primary growth driver for the market. The market is significantly influenced by the battery industry, particularly for lithium-ion batteries used in electric vehicles. The transition towards sustainable technologies, driven by consumer awareness of environmental concerns and regulatory initiatives, is propelling the demand for electric vehicles. Several countries, including China, India, Norway, France, and the UK, have announced plans to phase out the production and sale of traditional gasoline and diesel cars. For instance, the UK and France aim to ban the sale of such vehicles by 2040, while Norway targets all new passenger cars and vans to be zero-emission by 2025.
- The market's dynamics are shaped by the increasing demand for battery manufacturing. Hydrometallurgical processing is a common method used to extract cobalt from ores. This process involves the use of water and chemicals, making it a more sustainable alternative to traditional mining techniques. Additionally, the circular economy concept is gaining traction in the battery industry, with an emphasis on battery recycling to reduce the demand for primary cobalt sources. ESG considerations are increasingly important for businesses in the battery manufacturing sector. Companies are under pressure to ensure their operations are socially responsible and environmentally sustainable.
What are the Cobalt market trends shaping the Industry?
- Cobalt mining projects are experiencing a in development, reflecting the current market trend. This upward trend in the mining industry is driven by the increasing demand for cobalt in various technological applications. The market is experiencing growth due to the development of new mining projects and expansions of existing operations. This increase in supply is crucial as demand for cobalt rises in industries like electric vehicles and renewable energy storage. For example, the Santa Rita nickel-cobalt mine in Brazil is transitioning from open-pit to underground mining, extending its life and increasing annual production to 16,000 tons of nickel equivalent. This project will significantly contribute to the production of nickel and cobalt for electric car batteries.
- Metallurgical processes are essential in the cobalt industry for refining and producing battery-grade cobalt and cobalt sulfate. Cobalt research and innovation in supply chain management are also key factors driving market growth. Medical devices are another industry that relies on cobalt, highlighting the market's diverse applications. The cobalt industry outlook remains positive, with ongoing efforts in cobalt recovery and sustainability.
How does Cobalt market faces challenges face during its growth?
- The harmful effects of cobalt pose a significant challenge to the growth of the industry. Cobalt, a crucial component in various industrial applications, particularly in rechargeable batteries, has come under scrutiny due to its negative impacts on health and the environment. Exposure to cobalt can lead to respiratory issues, allergic reactions, and even cancer. Moreover, the mining of cobalt, primarily in the Democratic Republic of Congo, is associated with human rights violations and child labor. These concerns have led to increasing regulations and scrutiny, making it essential for industry players to find alternative solutions or responsible sourcing strategies to mitigate these risks and ensure sustainable growth.
- Cobalt and its compounds can pose significant health risks when exposed to inappropriate conditions. Chronic exposure to high levels of cobalt can lead to various health issues, such as respiratory problems, heart disorders, thyroid dysfunction, and neurological disorders. Prolonged exposure to cobalt dust or fumes, common in mining and metalworking industries, can result in hard metal lung disease or cobalt lung. Moreover, improper disposal of cobalt-containing waste or runoff from mining operations can lead to environmental contamination, endangering wildlife and aquatic organisms. The health and environmental risks associated with cobalt extraction necessitate stringent regulations and safety measures. Cobalt's toxicity arises from its ability to mimic essential minerals, such as iron, manganese, and copper, leading to their displacement in the body. This can result in various health issues, including sickness, dizziness, lung embolism, respiratory failure, birth defects, asthma, chronic bronchitis, allergic reactions, and heart disorders. The mining and production processes of cobalt can also contribute to environmental contamination, posing risks to ecosystems and aquatic life. It is crucial to implement responsible mining practices and proper disposal methods to mitigate these risks.
Exclusive Customer Landscape
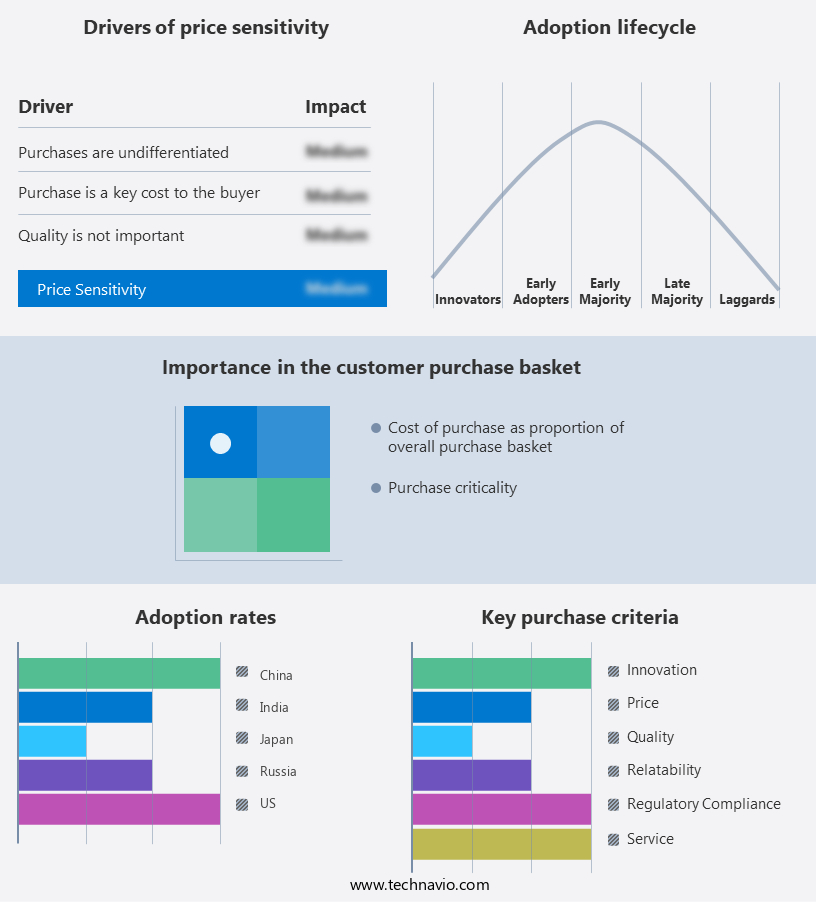
The cobalt market forecasting report includes the adoption lifecycle of the market, covering from the innovator's stage to the laggard's stage. It focuses on adoption rates in different regions based on penetration. Furthermore, the cobalt market report also includes key purchase criteria and drivers of price sensitivity to help companies evaluate and develop their market growth analysis strategies.
Customer Landscape
Key Companies & Market Insights
Companies are implementing various strategies, such as strategic alliances, cobalt market forecast, partnerships, mergers and acquisitions, geographical expansion, and product/service launches, to enhance their presence in the industry.
Ambatovy - The company specializes in the supply and application of cobalt, an essential element in various chemical, metallurgical, and industrial products.
The industry research and growth report includes detailed analyses of the competitive landscape of the market and information about key companies, including:
- Ambatovy
- Anglo American plc
- BHP Group Ltd.
- China Group Ltd.
- Electra Battery Materials Corp.
- Eramet
- Eurasian Resources Group Sarl
- European Cobalt Ltd.
- Freeport McMoRan Inc.
- Glencore Plc
- Huayou Cobalt Co. Ltd.
- Jervois Global Ltd.
- Missouri Cobalt LLC
- MMG Ltd.
- PJSC MMC Norilsk Nickel
- Red Rock Resources plc
- Sherritt International Corp.
- Sumitomo Metal Mining Co. Ltd.
- Umicore SA
- Vale SA
Qualitative and quantitative analysis of companies has been conducted to help clients understand the wider business environment as well as the strengths and weaknesses of key industry players. Data is qualitatively analyzed to categorize companies as pure play, category-focused, industry-focused, and diversified; it is quantitatively analyzed to categorize companies as dominant, leading, strong, tentative, and weak.
Recent Development and News in Cobalt Market
- In January 2024, Tesla, the leading electric vehicle manufacturer, announced a strategic partnership with Glencore, a major global mining company, to secure a long-term supply of ethically-sourced cobalt. This collaboration aimed to reduce Tesla's reliance on artisanal mining and improve transparency in the cobalt supply chain (Tesla Press Release, 2024).
- In March 2025, LG Chem, a leading global battery manufacturer, unveiled its new cobalt-free lithium-ion battery, named "Cobalt-Free XM5." This technological advancement marked a significant shift in the industry, as it aimed to reduce the environmental impact and ethical concerns associated with cobalt mining (LG Chem Press Release, 2025).
- In May 2024, China's Ministry of Industry and Information Technology issued new regulations to limit the use of cobalt in lithium-ion batteries for electric vehicles. The regulations set a target for a 30% reduction in cobalt content in batteries by 2025. This initiative aimed to reduce China's reliance on imported cobalt and promote the development of alternative battery technologies (China Ministry of Industry and Information Technology, 2024).
Research Analyst Overview
The market continues to evolve as the demand for cobalt-based materials in various sectors persists. Cobalt's role in battery metals, specifically in the production of lithium-ion batteries for electric vehicles, remains a significant driver for the market. However, resource scarcity and the complexities of cobalt extraction pose challenges to the industry. Mining operations and mineral processing techniques are continually advancing to meet the increasing demand for cobalt. Geochemical exploration and responsible sourcing initiatives are essential to ensure a sustainable supply chain. Environmental regulations and ESG considerations are increasingly influencing the cobalt industry, leading to innovations in hydrometallurgical processing and battery recycling. Additionally, it is employed in renewable energy systems like wind turbines and solar panels. Cobalt's application in superalloys for aerospace and in electronic devices like smartphones and laptops is well-known.
Cobalt's applications extend beyond battery metals, with uses in cobalt alloys, medical devices, and renewable energy technologies. The circular economy and battery manufacturing are also key areas of focus, with a growing emphasis on sustainable technologies and supply chain management. The market remains volatile due to price fluctuations and geopolitical risks. Ongoing research and development efforts in cobalt refining, cobalt oxide and hydroxide production, and cobalt cathode materials are essential to mitigating these risks and ensuring a steady supply of high-quality cobalt for various industries. The cobalt industry outlook remains positive, with continued innovation and a focus on responsible sourcing shaping its future.
Dive into Technavio's strong research methodology, blending expert interviews, extensive data synthesis, and validated models for unparalleled Cobalt Market insights. See full methodology.
|
Market Scope |
|
|
Report Coverage |
Details |
|
Page number |
249 |
|
Base year |
2024 |
|
Historic period |
2019-2023 |
|
Forecast period |
2025-2029 |
|
Growth momentum & CAGR |
Accelerate at a CAGR of 12.9% |
|
Market growth 2025-2029 |
USD 9.17 billion |
|
Market structure |
Fragmented |
|
YoY growth 2024-2025(%) |
12.5 |
|
Key countries |
China, US, Japan, Russia, India, Brazil, Australia, South Korea, Canada, and UK |
|
Competitive landscape |
Leading Companies, Market Positioning of Companies, Competitive Strategies, and Industry Risks |
What are the Key Data Covered in this Cobalt Market Research and Growth Report?
- CAGR of the Cobalt industry during the forecast period
- Detailed information on factors that will drive the growth and forecasting between 2025 and 2029
- Precise estimation of the size of the market and its contribution of the industry in focus to the parent market
- Accurate predictions about upcoming growth and trends and changes in consumer behaviour
- Growth of the market across APAC, North America, Europe, South America, and Middle East and Africa
- Thorough analysis of the market's competitive landscape and detailed information about companies
- Comprehensive analysis of factors that will challenge the cobalt market growth of industry companies
We can help! Our analysts can customize this cobalt market research report to meet your requirements.
 RIA -
RIA - 
