Mobile Augmented Reality (AR) Market Analysis, Size, and Forecast 2025-2029: North America (US and Canada), Europe (France, Germany, Italy, and UK), APAC (China, India, Japan, and South Korea), and Rest of World (ROW)

Mobile Augmented Reality (AR) Market Analysis, Size, and Forecast 2025-2029:
North America (US and Canada), Europe (France, Germany, Italy, and UK), APAC (China, India, Japan, and South Korea), and Rest of World (ROW)

Published: Apr 2025 246 Pages SKU: IRTNTR46562

Market Overview at a Glance

$507.27 B
Market Opportunity
61.7%
CAGR
37.4
YoY growth 2024-2025(%)

Mobile Augmented Reality (AR) Market Size 2025-2029

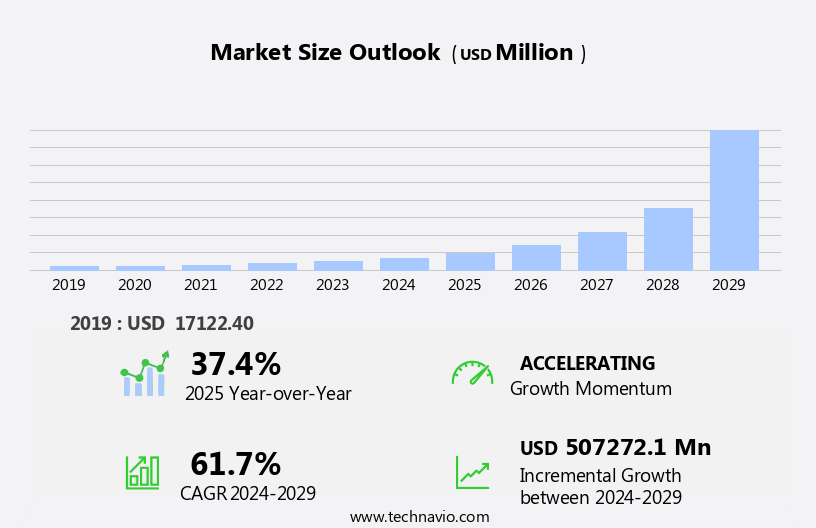
The mobile augmented reality (AR) market size is forecast to increase by USD 507.27 billion at a CAGR of 61.7% between 2024 and 2029.

  • The market is experiencing significant growth, driven by the increasing dependence on apps for various activities and the emergence of depth-sensing cameras in mobile devices. AR technology offers experiences by overlaying digital information onto the real world, revolutionizing industries such as retail, education, and entertainment. The market is experiencing significant growth due to increasing dependence on mobile applications and the proliferation of AR apps for various activities. However, the market faces constraints in hardware capabilities used in mobile AR, which can limit the quality of the user experience and hinder mass adoption. Regulatory hurdles also impact adoption, particularly in industries requiring stringent compliance, such as healthcare and transportation. To capitalize on market opportunities and navigate challenges effectively, companies must focus on addressing these constraints through technological advancements and strategic partnerships.
  • Investments in research and development, particularly in areas like miniaturization of sensors and power efficiency, will be crucial to overcome hardware limitations. Collaborations with regulatory bodies and industry associations can help navigate regulatory challenges and ensure compliance. Overall, the Mobile AR market presents substantial growth potential for companies that can effectively address these challenges and deliver innovative, high-quality AR experiences to consumers.

What will be the Size of the Mobile Augmented Reality (AR) Market during the forecast period?

Mobile Augmented Reality (AR) Market Size

 Request Free Sample

  • The market encompasses a diverse range of applications, from entertainment to industrial uses. AR for entertainment offers experiences through location-based games and interactive storytelling. AR-driven product design enables 3D object placement, allowing consumers to virtually try on items before purchase. AR in architecture and construction facilitates project visualization and planning. AR overlays enhance user experiences in healthcare, events, logistics, e-commerce, transportation, and accessibility. AR-powered product demos provide interactive and engaging ways to showcase offerings. AR in healthcare improves patient care through virtual training and diagnostic tools.
  • AR for events creates unique experiences for attendees, while AR in logistics streamlines supply chain management. AR-powered e-commerce and transportation enable virtual try-on and route planning, respectively. Overall, the AR market continues to evolve, offering innovative solutions across various industries.

How is this Mobile Augmented Reality (AR) Industry segmented?

The Mobile Augmented Reality (Ar) industry research report provides comprehensive data (region-wise segment analysis), with forecasts and estimates in "USD million" for the period 2025-2029, as well as historical data from 2019-2023 for the following segments.

  • Application
    • M and A
    • Gaming and entertainment
    • Education and learning
    • Travel and tourism
    • Others
  • End-user
    • Enterprise
    • Consumer
  • Type
    • Marker-based AR
    • Markerless AR
    • Anchor-based AR
  • Device
    • Smartphones
    • Tablets
    • Personal digital assistants (PDAs)
    • Handheld gaming consoles
    • Others
  • Geography
    • North America
      • US
      • Canada
    • Europe
      • France
      • Germany
      • Italy
      • UK
    • APAC
      • China
      • India
      • Japan
      • South Korea
    • Rest of World (ROW)

By Application Insights

The M and A segment is estimated to witness significant growth during the forecast period. AR technology has been making waves in various industries, offering innovative solutions for marketing, education, healthcare, manufacturing, and more. AR Software Development Kits (SDKs) and processors are at the core of this technology, enabling the creation of AR experiences. AR applications, powered by these tools, bring virtual objects and content to life in real-world environments. AR headsets and sensors provide the necessary hardware for these experiences, while AR Image Recognition technology adds an extra layer of interactivity. Ethical considerations are essential in the AR market, with privacy and security being key concerns. AR is being adopted in healthcare for training and simulations, enhancing the learning experience and improving patient care.

In education, AR is used to make learning more engaging and interactive, while in manufacturing, it aids in prototyping and assembly line optimization. AR rendering and interaction technologies enable users to manipulate virtual objects in real-world environments, creating a balanced blend of digital and physical worlds. AR location-based services and object recognition capabilities add a new dimension to consumer experiences, providing valuable information and enhancing the user journey. AR content creation and Data Visualization Tools are essential for developers, enabling them to build engaging and interactive AR applications. AR platforms and frameworks provide a foundation for developers to build upon, while AR cloud services offer scalability and flexibility.

AR adoption is on the rise, with marketing and advertising being early adopters. AR offers marketers innovative ways to engage with consumers and create interactive and brand experiences. AR virtual objects and content can be placed in real-world environments, allowing consumers to interact with them in a more engaging and memorable way. AR privacy and connectivity are essential considerations for marketers, ensuring that consumer data is protected while still delivering personalized and targeted content. AR is also making strides in retail, entertainment, and tourism industries, offering new ways to enhance consumer experiences. AR gaming and wearables are becoming increasingly popular, providing and interactive experiences for users.

AR regulations and standards are evolving to keep pace with this technology, ensuring that it is used ethically and responsibly. The AR market is dynamic and evolving, with various industries adopting this technology to enhance consumer experiences and drive innovation. AR offers a unique blend of digital and physical worlds, providing valuable insights and creating engaging and interactive experiences. AR's potential is vast, and its impact on various industries is only just beginning to be realized.

Mobile Augmented Reality (AR) Market Size

Request Free Sample

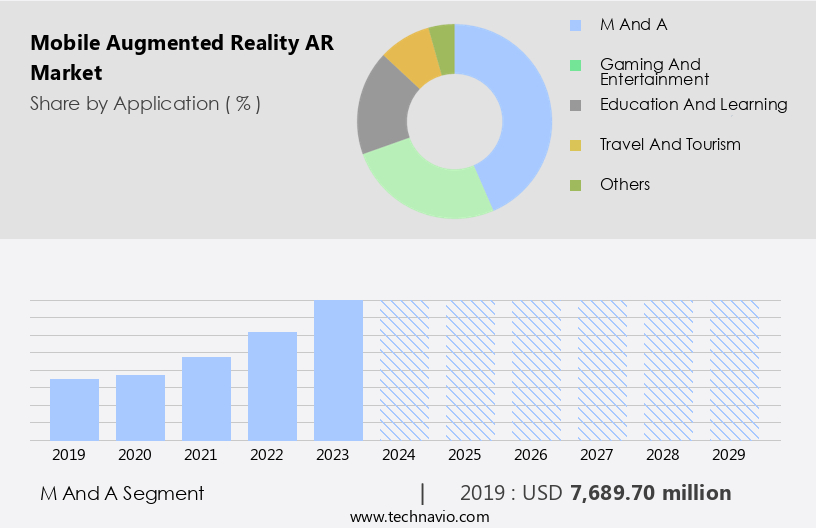
The M and A segment was valued at USD 7.69 billion in 2019 and showed a gradual increase during the forecast period.

The Mobile Augmented Reality (AR) Market is expanding rapidly, transforming industries with innovative solutions. Advanced AR platform and AR SDK empower developers to create experiences using diverse AR tools. Wearable technology like AR glasses enhances AR tracking for real-time interactions. Dynamic AR animation fosters engaging AR interaction, optimizing AR user interface for seamless usability. From AR entertainment to AR education, its impact is broad, supporting AR training, AR healthcare, and AR manufacturing. It revolutionizes AR tourism, AR design, and AR 3D modeling, utilizing precise AR sensors and high-performance AR processors. With strong AR connectivity, emphasis on AR accessibility grows, ensuring secure AR security measures. As mobile AR advances, its potential across industries continues to rise.

Regional Analysis

North America is estimated to contribute 40% to the growth of the global market during the forecast period.Technavio's analysts have elaborately explained the regional trends and drivers that shape the market during the forecast period. StartFragment The Mobile Augmented Reality (AR) Market is rapidly evolving, revolutionizing industries with experiences and augmented reality overlays. Businesses are leveraging interactive product demos to engage customers in new ways. Gaming is being redefined through location-based AR games, blending digital and real-world landscapes. In infrastructure, AR in construction enhances precision and efficiency. Inclusivity is advancing with AR for accessibility, aiding individuals with disabilities. Creators harness AR for storytelling, crafting compelling narratives. Transportation sees innovation through AR for transportation, optimizing navigation. Supply chains are streamlined with AR for logistics, improving operations.

Mobile Augmented Reality (AR) Market Share by Geography

Download Free Sample Report

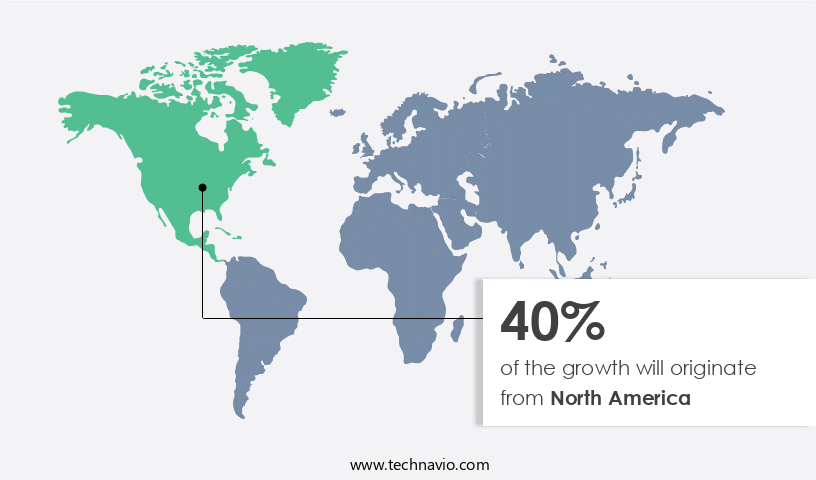
The market in North America is a significant and mature sector, driven by the region's advanced technological infrastructure and continuous innovations in mobile devices, processors, graphics, and network connectivity. These advancements facilitate and high-quality AR experiences on smartphones and tablets, leading to increased user adoption. With a large and tech-savvy mobile user base characterized by high smartphone penetration and a culture of embracing new technology, North America provides a fertile ground for the integration of AR technology into various applications. The popularity of mobile apps in the region has created an ideal environment for AR experiences in sectors such as healthcare, education, manufacturing, and retail, among others.

AR applications, including those for image recognition, object recognition, and location-based services, are increasingly being integrated into software, tools, and platforms. AR headsets and glasses, along with sensors and cameras, are also gaining traction in the market. Ethical considerations, privacy concerns, and security measures are essential aspects of AR development, ensuring balanced interaction between virtual objects and the real world. The market's evolution is further characterized by advancements in AR rendering, interaction, and spatial computing, as well as the integration of AR with wearables, cloud services, and marketing strategies. The AR market in North America continues to innovate and grow, offering opportunities for businesses to explore and capitalize on the technology's potential.

Market Dynamics

Our researchers analyzed the data with 2024 as the base year, along with the key drivers, trends, and challenges. A holistic analysis of drivers will help companies refine their marketing strategies to gain a competitive advantage.

What are the Mobile Augmented Reality (AR) market drivers leading to the rise in the adoption of Industry?

  • The escalating reliance on applications, particularly those incorporating augmented reality (AR) technology, is the primary catalyst fueling market growth in this sector.  Mobile Augmented Reality (AR) technology has seen significant advancements due to the evolution of mobile devices. Faster processors, enhanced graphics capabilities, and superior camera quality have made smartphones and tablets more capable of handling AR applications effectively. The expanding user base for these devices, coupled with the availability of affordable options, has fueled the demand for AR apps. Furthermore, the widespread adoption of high-speed internet and the expansion of 4G and 5G networks have facilitated real-time data processing, enabling seamless AR experiences. AR technology offers and interactive experiences by bridging the physical and digital worlds.
  • In industries like manufacturing, AR rendering and interaction tools have revolutionized production processes, improving efficiency and accuracy. AR object recognition and location-based services have transformed retail, enabling customers to visualize products in their homes before making a purchase. AR content, hardware, and training have also found applications in various sectors, including education, healthcare, and entertainment. AR prototyping and AR cloud have further expanded the technology's potential, offering real-time collaboration and data sharing capabilities. The ongoing development of AR standards and the integration of AR with other emerging technologies, such as virtual reality and artificial intelligence, are expected to drive the growth of the AR market.

What are the Mobile Augmented Reality (AR) market trends shaping the Industry?

  • Depth-sensing cameras are gaining increasing popularity in the market, representing an emerging trend. This technology, which enables three-dimensional sensing and analysis, is poised to revolutionize industries such as augmented reality, robotics, and autonomous vehicles. Depth-sensing cameras, also referred to as 3D cameras, offer the capability to perceive the distance of objects in the environment, leading to more advanced and Augmented Reality (AR) experiences on mobile devices. The demand for such experiences is growing among consumers and businesses, as they seek more engaging and realistic AR applications. These cameras enable the creation of AR applications that blend virtual content with the real-world environment, enhancing user immersion and interaction. Technological advancements in camera sensors and processing capabilities have made depth-sensing cameras more feasible and cost-effective for mobile device integration. As smartphone hardware continues to improve, manufacturers can incorporate these capabilities without significantly increasing the device's cost.
  • AR applications can provide various functionalities, such as AR navigation, simulations, localization, user interfaces, gaming, data visualization, and spatial computing. AR wearables, like Smart Glasses, can also benefit from depth-sensing cameras, offering a more seamless and interactive experience. AR privacy concerns are essential considerations for developers, ensuring user data is protected while using these applications. The integration of AR technology into mobile devices and the increasing availability of depth-sensing cameras are expected to drive the AR market's growth.

How does Mobile Augmented Reality (AR) market faces challenges face during its growth?

  • The limitation in mobile augmented reality (AR) hardware capabilities poses a significant challenge to the industry's growth, as it hinders the delivery of and seamless user experiences.  Augmented Reality (AR) technology offers innovative solutions for retail, entertainment, advertising, and tourism industries. AR retail enables virtual product trials and shopping experiences. In entertainment, AR provides interactive experiences in games and movies. For advertising, AR overlay ads offer engaging and personalized content. However, AR regulations and connectivity challenges pose obstacles. AR applications require substantial processing power and memory, which older or low-end devices may struggle to handle. This can lead to reduced performance and lower user satisfaction. Running AR applications can be power-intensive, leading to faster battery drain.
  • Limited battery life can restrict the duration of AR experiences and may be a concern for users, particularly in outdoor settings. AR frameworks and design platforms facilitate the creation of AR content, while AR marketing and 3D modeling offer new opportunities for businesses. Despite these challenges, AR innovation continues to advance, providing exciting possibilities for various industries.

Exclusive Customer Landscape

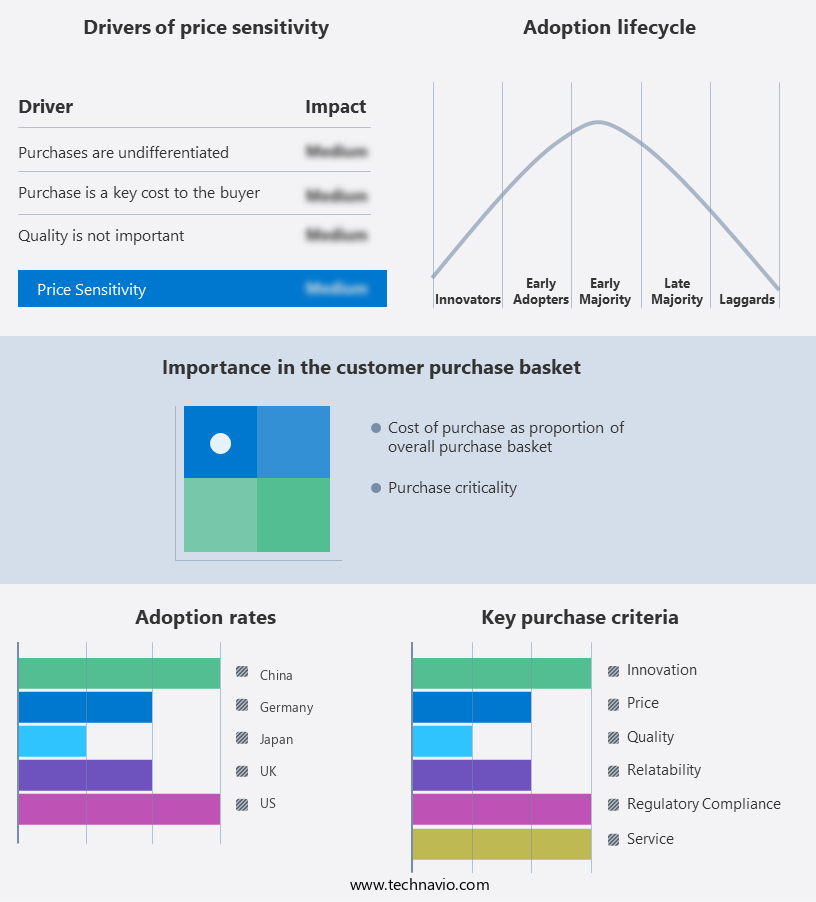
The mobile augmented reality (AR) market forecasting report includes the adoption lifecycle of the market, covering from the innovator's stage to the laggard's stage. It focuses on adoption rates in different regions based on penetration. Furthermore, the mobile augmented reality (AR) market report also includes key purchase criteria and drivers of price sensitivity to help companies evaluate and develop their market growth analysis strategies.

Mobile Augmented Reality (AR) Market Share by Geography

 Customer Landscape

Key Companies & Market Insights

Companies are implementing various strategies, such as strategic alliances, mobile augmented reality (AR) market forecast, partnerships, mergers and acquisitions, geographical expansion, and product/service launches, to enhance their presence in the industry.

Alphabet Inc. - The company offers mobile augmented reality solutions such as Google ARCore through its subsidiary Google LLC.

The industry research and growth report includes detailed analyses of the competitive landscape of the market and information about key companies, including:

  • Alphabet Inc.
  • Apple Inc.
  • Augmented Pixels Inc.
  • Blippar Ltd.
  • Independiente Communication Ltd.
  • Inglobe Technologies Srl
  • Lenovo Group Ltd.
  • Magic Leap Inc.
  • mCloud Technologies Corp.
  • Niantic Inc.
  • Plural Technology Pvt. Ltd.
  • PTC Inc.
  • QuestUpon
  • Robert Bosch GmbH
  • Seabery Augmented Technology SL group
  • Seiko Epson Corp.
  • VividWorks Oy
  • weAR Srl
  • Wikitude GmbH
  • Zugara Inc.

Qualitative and quantitative analysis of companies has been conducted to help clients understand the wider business environment as well as the strengths and weaknesses of key industry players. Data is qualitatively analyzed to categorize companies as pure play, category-focused, industry-focused, and diversified; it is quantitatively analyzed to categorize companies as dominant, leading, strong, tentative, and weak.

Recent Development and News in Mobile Augmented Reality (AR) Market

  • In February 2024, Apple unveiled its long-awaited AR headset, the "Apple Glass," during its product launch event. This new device, expected to hit the market by 2025, is set to revolutionize the mobile AR industry with its advanced features and seamless integration with iOS devices (Apple, 2024).
  • In July 2024, Google and Microsoft announced a strategic partnership to collaborate on AR technology. This alliance aims to accelerate the development and adoption of AR solutions across various industries, including education, healthcare, and retail (Microsoft, 2024).

Research Analyst Overview

The market continues to evolve, with dynamic market activities unfolding across various sectors. AR integration is revolutionizing industries, from healthcare to manufacturing, education, and retail, by overlaying virtual objects onto real-world environments. AR navigation systems are transforming transportation and logistics, while AR simulations provide training experiences. AR localization enables personalized content delivery, and AR user interfaces enhance user experience. AR gaming is gaining popularity, with AR wearables and glasses offering gaming experiences. AR spatial computing and tracking technologies are advancing, enabling more accurate and precise AR experiences. AR development tools and frameworks are becoming more accessible, enabling businesses to create custom AR applications.

AR data visualization is providing new insights, while AR privacy concerns are driving the need for ethical guidelines. AR advertising and marketing are offering innovative ways to engage consumers. AR regulations and connectivity are evolving, shaping the future of this dynamic market. AR innovation is driving growth, with AR ethics and accessibility becoming increasingly important considerations. AR hardware and software advancements are enabling new applications, from AR headsets to AR cameras and sensors. AR object recognition and image recognition technologies are enhancing AR experiences, while AR prototyping and 3D modeling are streamlining product development. AR cloud and AR rendering technologies are improving performance and reducing latency.

The market is experiencing significant growth due to the enriching user experiences it offers. The advancements in mobile device capabilities have made AR technology accessible to a wider audience. AR finds extensive applications in gaming and entertainment, where users can interact with virtual objects in the real world. Social media platforms are also integrating AR features to enhance user engagement. However, technical limitations and hardware requirements pose challenges to the market growth. Skilled designers and developers are in high demand for AR content creation, requiring expertise in UI/UX design and interactive application development. Sensors such as GPS, compass, 3D cameras, and mobile devices like smartphones, tablets, and mobile projection devices are essential hardware for AR applications. The AR market is continually unfolding, with new applications and innovations on the horizon.

Dive into Technavio's robust research methodology, blending expert interviews, extensive data synthesis, and validated models for unparalleled Mobile Augmented Reality (AR) Market insights. See full methodology.

Market Scope

Report Coverage

Details

Page number

246

Base year

2024

Historic period

2019-2023

Forecast period

2025-2029

Growth momentum & CAGR

Accelerate at a CAGR of 61.7%

Market growth 2025-2029

USD 507.27 billion

Market structure

Fragmented

YoY growth 2024-2025(%)

37.4

Key countries

US, Germany, China, Japan, Canada, UK, India, France, South Korea, and Italy

Competitive landscape

Leading Companies, Market Positioning of Companies, Competitive Strategies, and Industry Risks

Request Free Sample

What are the Key Data Covered in this Mobile Augmented Reality (AR) Market Research and Growth Report?

  • CAGR of the Mobile Augmented Reality (AR) industry during the forecast period
  • Detailed information on factors that will drive the growth and forecasting between 2025 and 2029
  • Precise estimation of the size of the market and its contribution of the industry in focus to the parent market
  • Accurate predictions about upcoming growth and trends and changes in consumer behaviour
  • Growth of the market across North America, APAC, Europe, South America, and Middle East and Africa
  • Thorough analysis of the market's competitive landscape and detailed information about companies
  • Comprehensive analysis of factors that will challenge the mobile augmented reality (AR) market growth and forecasting

We can help! Our analysts can customize this mobile augmented reality (AR) market research report to meet your requirements.

Get in touch

1 Executive Summary

  • 1.1 Market overview
    • Executive Summary - Chart on Market Overview
    • Executive Summary - Data Table on Market Overview
    • Executive Summary - Chart on Global Market Characteristics
    • Executive Summary - Chart on Market by Geography
    • Executive Summary - Chart on Market Segmentation by Application
    • Executive Summary - Chart on Market Segmentation by End-user
    • Executive Summary - Chart on Market Segmentation by Type
    • Executive Summary - Chart on Market Segmentation by Device
    • Executive Summary - Chart on Incremental Growth
    • Executive Summary - Data Table on Incremental Growth
    • Executive Summary - Chart on Company Market Positioning

2 Technavio Analysis

  • 2.1 Analysis of price sensitivity, lifecycle, customer purchase basket, adoption rates, and purchase criteria
    • Analysis of price sensitivity, lifecycle, customer purchase basket, adoption rates, and purchase criteria
  • 2.2 Criticality of inputs and Factors of differentiation
    • Overview on criticality of inputs and factors of differentiation
  • 2.3 Factors of disruption
    • Overview on factors of disruption
  • 2.4 Impact of drivers and challenges
    • Impact of drivers and challenges in 2024 and 2029

3 Market Landscape

  • 3.1 Market ecosystem
    • Parent Market
    • Data Table on - Parent Market
  • 3.2 Market characteristics
    • Market characteristics analysis
  • 3.3 Value chain analysis
    • Value chain analysis

4 Market Sizing

  • 4.1 Market definition
    • Offerings of companies included in the market definition
  • 4.2 Market segment analysis
    • Market segments
  • 4.3 Market size 2024
    • 4.4 Market outlook: Forecast for 2024-2029
      • Chart on Global - Market size and forecast 2024-2029 ($ million)
      • Data Table on Global - Market size and forecast 2024-2029 ($ million)
      • Chart on Global Market: Year-over-year growth 2024-2029 (%)
      • Data Table on Global Market: Year-over-year growth 2024-2029 (%)

    5 Historic Market Size

    • 5.1 Global Mobile Augmented Reality (AR) Market 2019 - 2023
      • Historic Market Size - Data Table on Global Mobile Augmented Reality (AR) Market 2019 - 2023 ($ million)
    • 5.2 Application segment analysis 2019 - 2023
      • Historic Market Size - Application Segment 2019 - 2023 ($ million)
    • 5.3 End-user segment analysis 2019 - 2023
      • Historic Market Size - End-user Segment 2019 - 2023 ($ million)
    • 5.4 Type segment analysis 2019 - 2023
      • Historic Market Size - Type Segment 2019 - 2023 ($ million)
    • 5.5 Device segment analysis 2019 - 2023
      • Historic Market Size - Device Segment 2019 - 2023 ($ million)
    • 5.6 Geography segment analysis 2019 - 2023
      • Historic Market Size - Geography Segment 2019 - 2023 ($ million)
    • 5.7 Country segment analysis 2019 - 2023
      • Historic Market Size - Country Segment 2019 - 2023 ($ million)

    6 Qualitative Analysis

    • 6.1 Impact of AI on Global Mobile Augmented Reality (AR) Market

      7 Five Forces Analysis

      • 7.1 Five forces summary
        • Five forces analysis - Comparison between 2024 and 2029
      • 7.2 Bargaining power of buyers
        • Bargaining power of buyers - Impact of key factors 2024 and 2029
      • 7.3 Bargaining power of suppliers
        • Bargaining power of suppliers - Impact of key factors in 2024 and 2029
      • 7.4 Threat of new entrants
        • Threat of new entrants - Impact of key factors in 2024 and 2029
      • 7.5 Threat of substitutes
        • Threat of substitutes - Impact of key factors in 2024 and 2029
      • 7.6 Threat of rivalry
        • Threat of rivalry - Impact of key factors in 2024 and 2029
      • 7.7 Market condition
        • Chart on Market condition - Five forces 2024 and 2029

      8 Market Segmentation by Application

      • 8.1 Market segments
        • Chart on Application - Market share 2024-2029 (%)
        • Data Table on Application - Market share 2024-2029 (%)
      • 8.2 Comparison by Application
        • Chart on Comparison by Application
        • Data Table on Comparison by Application
      • 8.3 M and A - Market size and forecast 2024-2029
        • Chart on M and A - Market size and forecast 2024-2029 ($ million)
        • Data Table on M and A - Market size and forecast 2024-2029 ($ million)
        • Chart on M and A - Year-over-year growth 2024-2029 (%)
        • Data Table on M and A - Year-over-year growth 2024-2029 (%)
      • 8.4 Gaming and entertainment - Market size and forecast 2024-2029
        • Chart on Gaming and entertainment - Market size and forecast 2024-2029 ($ million)
        • Data Table on Gaming and entertainment - Market size and forecast 2024-2029 ($ million)
        • Chart on Gaming and entertainment - Year-over-year growth 2024-2029 (%)
        • Data Table on Gaming and entertainment - Year-over-year growth 2024-2029 (%)
      • 8.5 Education and learning - Market size and forecast 2024-2029
        • Chart on Education and learning - Market size and forecast 2024-2029 ($ million)
        • Data Table on Education and learning - Market size and forecast 2024-2029 ($ million)
        • Chart on Education and learning - Year-over-year growth 2024-2029 (%)
        • Data Table on Education and learning - Year-over-year growth 2024-2029 (%)
      • 8.6 Travel and tourism - Market size and forecast 2024-2029
        • Chart on Travel and tourism - Market size and forecast 2024-2029 ($ million)
        • Data Table on Travel and tourism - Market size and forecast 2024-2029 ($ million)
        • Chart on Travel and tourism - Year-over-year growth 2024-2029 (%)
        • Data Table on Travel and tourism - Year-over-year growth 2024-2029 (%)
      • 8.7 Others - Market size and forecast 2024-2029
        • Chart on Others - Market size and forecast 2024-2029 ($ million)
        • Data Table on Others - Market size and forecast 2024-2029 ($ million)
        • Chart on Others - Year-over-year growth 2024-2029 (%)
        • Data Table on Others - Year-over-year growth 2024-2029 (%)
      • 8.8 Market opportunity by Application
        • Market opportunity by Application ($ million)
        • Data Table on Market opportunity by Application ($ million)

      9 Market Segmentation by End-user

      • 9.1 Market segments
        • Chart on End-user - Market share 2024-2029 (%)
        • Data Table on End-user - Market share 2024-2029 (%)
      • 9.2 Comparison by End-user
        • Chart on Comparison by End-user
        • Data Table on Comparison by End-user
      • 9.3 Enterprise - Market size and forecast 2024-2029
        • Chart on Enterprise - Market size and forecast 2024-2029 ($ million)
        • Data Table on Enterprise - Market size and forecast 2024-2029 ($ million)
        • Chart on Enterprise - Year-over-year growth 2024-2029 (%)
        • Data Table on Enterprise - Year-over-year growth 2024-2029 (%)
      • 9.4 Consumer - Market size and forecast 2024-2029
        • Chart on Consumer - Market size and forecast 2024-2029 ($ million)
        • Data Table on Consumer - Market size and forecast 2024-2029 ($ million)
        • Chart on Consumer - Year-over-year growth 2024-2029 (%)
        • Data Table on Consumer - Year-over-year growth 2024-2029 (%)
      • 9.5 Market opportunity by End-user
        • Market opportunity by End-user ($ million)
        • Data Table on Market opportunity by End-user ($ million)

      10 Market Segmentation by Type

      • 10.1 Market segments
        • Chart on Type - Market share 2024-2029 (%)
        • Data Table on Type - Market share 2024-2029 (%)
      • 10.2 Comparison by Type
        • Chart on Comparison by Type
        • Data Table on Comparison by Type
      • 10.3 Marker-based AR - Market size and forecast 2024-2029
        • Chart on Marker-based AR - Market size and forecast 2024-2029 ($ million)
        • Data Table on Marker-based AR - Market size and forecast 2024-2029 ($ million)
        • Chart on Marker-based AR - Year-over-year growth 2024-2029 (%)
        • Data Table on Marker-based AR - Year-over-year growth 2024-2029 (%)
      • 10.4 Markerless AR - Market size and forecast 2024-2029
        • Chart on Markerless AR - Market size and forecast 2024-2029 ($ million)
        • Data Table on Markerless AR - Market size and forecast 2024-2029 ($ million)
        • Chart on Markerless AR - Year-over-year growth 2024-2029 (%)
        • Data Table on Markerless AR - Year-over-year growth 2024-2029 (%)
      • 10.5 Anchor-based AR - Market size and forecast 2024-2029
        • Chart on Anchor-based AR - Market size and forecast 2024-2029 ($ million)
        • Data Table on Anchor-based AR - Market size and forecast 2024-2029 ($ million)
        • Chart on Anchor-based AR - Year-over-year growth 2024-2029 (%)
        • Data Table on Anchor-based AR - Year-over-year growth 2024-2029 (%)
      • 10.6 Market opportunity by Type
        • Market opportunity by Type ($ million)
        • Data Table on Market opportunity by Type ($ million)

      11 Market Segmentation by Device

      • 11.1 Market segments
        • Chart on Device - Market share 2024-2029 (%)
        • Data Table on Device - Market share 2024-2029 (%)
      • 11.2 Comparison by Device
        • Chart on Comparison by Device
        • Data Table on Comparison by Device
      • 11.3 Smartphones - Market size and forecast 2024-2029
        • Chart on Smartphones - Market size and forecast 2024-2029 ($ million)
        • Data Table on Smartphones - Market size and forecast 2024-2029 ($ million)
        • Chart on Smartphones - Year-over-year growth 2024-2029 (%)
        • Data Table on Smartphones - Year-over-year growth 2024-2029 (%)
      • 11.4 Tablets - Market size and forecast 2024-2029
        • Chart on Tablets - Market size and forecast 2024-2029 ($ million)
        • Data Table on Tablets - Market size and forecast 2024-2029 ($ million)
        • Chart on Tablets - Year-over-year growth 2024-2029 (%)
        • Data Table on Tablets - Year-over-year growth 2024-2029 (%)
      • 11.5 Personal digital assistants (PDAs) - Market size and forecast 2024-2029
        • Chart on Personal digital assistants (PDAs) - Market size and forecast 2024-2029 ($ million)
        • Data Table on Personal digital assistants (PDAs) - Market size and forecast 2024-2029 ($ million)
        • Chart on Personal digital assistants (PDAs) - Year-over-year growth 2024-2029 (%)
        • Data Table on Personal digital assistants (PDAs) - Year-over-year growth 2024-2029 (%)
      • 11.6 Handheld gaming consoles - Market size and forecast 2024-2029
        • Chart on Handheld gaming consoles - Market size and forecast 2024-2029 ($ million)
        • Data Table on Handheld gaming consoles - Market size and forecast 2024-2029 ($ million)
        • Chart on Handheld gaming consoles - Year-over-year growth 2024-2029 (%)
        • Data Table on Handheld gaming consoles - Year-over-year growth 2024-2029 (%)
      • 11.7 Others - Market size and forecast 2024-2029
        • Chart on Others - Market size and forecast 2024-2029 ($ million)
        • Data Table on Others - Market size and forecast 2024-2029 ($ million)
        • Chart on Others - Year-over-year growth 2024-2029 (%)
        • Data Table on Others - Year-over-year growth 2024-2029 (%)
      • 11.8 Market opportunity by Device
        • Market opportunity by Device ($ million)
        • Data Table on Market opportunity by Device ($ million)

      12 Customer Landscape

      • 12.1 Customer landscape overview
        • Analysis of price sensitivity, lifecycle, customer purchase basket, adoption rates, and purchase criteria

      13 Geographic Landscape

      • 13.1 Geographic segmentation
        • Chart on Market share by geography 2024-2029 (%)
        • Data Table on Market share by geography 2024-2029 (%)
      • 13.2 Geographic comparison
        • Chart on Geographic comparison
        • Data Table on Geographic comparison
      • 13.3 North America - Market size and forecast 2024-2029
        • Chart on North America - Market size and forecast 2024-2029 ($ million)
        • Data Table on North America - Market size and forecast 2024-2029 ($ million)
        • Chart on North America - Year-over-year growth 2024-2029 (%)
        • Data Table on North America - Year-over-year growth 2024-2029 (%)
      • 13.4 APAC - Market size and forecast 2024-2029
        • Chart on APAC - Market size and forecast 2024-2029 ($ million)
        • Data Table on APAC - Market size and forecast 2024-2029 ($ million)
        • Chart on APAC - Year-over-year growth 2024-2029 (%)
        • Data Table on APAC - Year-over-year growth 2024-2029 (%)
      • 13.5 Europe - Market size and forecast 2024-2029
        • Chart on Europe - Market size and forecast 2024-2029 ($ million)
        • Data Table on Europe - Market size and forecast 2024-2029 ($ million)
        • Chart on Europe - Year-over-year growth 2024-2029 (%)
        • Data Table on Europe - Year-over-year growth 2024-2029 (%)
      • 13.6 South America - Market size and forecast 2024-2029
        • Chart on South America - Market size and forecast 2024-2029 ($ million)
        • Data Table on South America - Market size and forecast 2024-2029 ($ million)
        • Chart on South America - Year-over-year growth 2024-2029 (%)
        • Data Table on South America - Year-over-year growth 2024-2029 (%)
      • 13.7 Middle East and Africa - Market size and forecast 2024-2029
        • Chart on Middle East and Africa - Market size and forecast 2024-2029 ($ million)
        • Data Table on Middle East and Africa - Market size and forecast 2024-2029 ($ million)
        • Chart on Middle East and Africa - Year-over-year growth 2024-2029 (%)
        • Data Table on Middle East and Africa - Year-over-year growth 2024-2029 (%)
      • 13.8 US - Market size and forecast 2024-2029
        • Chart on US - Market size and forecast 2024-2029 ($ million)
        • Data Table on US - Market size and forecast 2024-2029 ($ million)
        • Chart on US - Year-over-year growth 2024-2029 (%)
        • Data Table on US - Year-over-year growth 2024-2029 (%)
      • 13.9 China - Market size and forecast 2024-2029
        • Chart on China - Market size and forecast 2024-2029 ($ million)
        • Data Table on China - Market size and forecast 2024-2029 ($ million)
        • Chart on China - Year-over-year growth 2024-2029 (%)
        • Data Table on China - Year-over-year growth 2024-2029 (%)
      • 13.10 Germany - Market size and forecast 2024-2029
        • Chart on Germany - Market size and forecast 2024-2029 ($ million)
        • Data Table on Germany - Market size and forecast 2024-2029 ($ million)
        • Chart on Germany - Year-over-year growth 2024-2029 (%)
        • Data Table on Germany - Year-over-year growth 2024-2029 (%)
      • 13.11 Japan - Market size and forecast 2024-2029
        • Chart on Japan - Market size and forecast 2024-2029 ($ million)
        • Data Table on Japan - Market size and forecast 2024-2029 ($ million)
        • Chart on Japan - Year-over-year growth 2024-2029 (%)
        • Data Table on Japan - Year-over-year growth 2024-2029 (%)
      • 13.12 Canada - Market size and forecast 2024-2029
        • Chart on Canada - Market size and forecast 2024-2029 ($ million)
        • Data Table on Canada - Market size and forecast 2024-2029 ($ million)
        • Chart on Canada - Year-over-year growth 2024-2029 (%)
        • Data Table on Canada - Year-over-year growth 2024-2029 (%)
      • 13.13 India - Market size and forecast 2024-2029
        • Chart on India - Market size and forecast 2024-2029 ($ million)
        • Data Table on India - Market size and forecast 2024-2029 ($ million)
        • Chart on India - Year-over-year growth 2024-2029 (%)
        • Data Table on India - Year-over-year growth 2024-2029 (%)
      • 13.14 UK - Market size and forecast 2024-2029
        • Chart on UK - Market size and forecast 2024-2029 ($ million)
        • Data Table on UK - Market size and forecast 2024-2029 ($ million)
        • Chart on UK - Year-over-year growth 2024-2029 (%)
        • Data Table on UK - Year-over-year growth 2024-2029 (%)
      • 13.15 France - Market size and forecast 2024-2029
        • Chart on France - Market size and forecast 2024-2029 ($ million)
        • Data Table on France - Market size and forecast 2024-2029 ($ million)
        • Chart on France - Year-over-year growth 2024-2029 (%)
        • Data Table on France - Year-over-year growth 2024-2029 (%)
      • 13.16 South Korea - Market size and forecast 2024-2029
        • Chart on South Korea - Market size and forecast 2024-2029 ($ million)
        • Data Table on South Korea - Market size and forecast 2024-2029 ($ million)
        • Chart on South Korea - Year-over-year growth 2024-2029 (%)
        • Data Table on South Korea - Year-over-year growth 2024-2029 (%)
      • 13.17 Italy - Market size and forecast 2024-2029
        • Chart on Italy - Market size and forecast 2024-2029 ($ million)
        • Data Table on Italy - Market size and forecast 2024-2029 ($ million)
        • Chart on Italy - Year-over-year growth 2024-2029 (%)
        • Data Table on Italy - Year-over-year growth 2024-2029 (%)
      • 13.18 Market opportunity by geography
        • Market opportunity by geography ($ million)
        • Data Tables on Market opportunity by geography ($ million)

      14 Drivers, Challenges, and Opportunity/Restraints

      • 14.1 Market drivers
        • 14.2 Market challenges
          • 14.3 Impact of drivers and challenges
            • Impact of drivers and challenges in 2024 and 2029
          • 14.4 Market opportunities/restraints

            15 Competitive Landscape

            • 15.1 Overview
              • 15.2 Competitive Landscape
                • Overview on criticality of inputs and factors of differentiation
              • 15.3 Landscape disruption
                • Overview on factors of disruption
              • 15.4 Industry risks
                • Impact of key risks on business

              16 Competitive Analysis

              • 16.1 Companies profiled
                • Companies covered
              • 16.2 Company ranking index
                • Company ranking index
              • 16.3 Market positioning of companies
                • Matrix on companies position and classification
              • 16.4 Alphabet Inc.
                • Alphabet Inc. - Overview
                • Alphabet Inc. - Business segments
                • Alphabet Inc. - Key offerings
                • Alphabet Inc. - Segment focus
                • SWOT
              • 16.5 Apple Inc.
                • Apple Inc. - Overview
                • Apple Inc. - Business segments
                • Apple Inc. - Key news
                • Apple Inc. - Key offerings
                • Apple Inc. - Segment focus
                • SWOT
              • 16.6 Augmented Pixels Inc.
                • Augmented Pixels Inc. - Overview
                • Augmented Pixels Inc. - Product / Service
                • Augmented Pixels Inc. - Key offerings
                • SWOT
              • 16.7 Blippar Ltd.
                • Blippar Ltd. - Overview
                • Blippar Ltd. - Product / Service
                • Blippar Ltd. - Key offerings
                • SWOT
              • 16.8 Independiente Communication Ltd.
                • Independiente Communication Ltd. - Overview
                • Independiente Communication Ltd. - Product / Service
                • Independiente Communication Ltd. - Key offerings
                • SWOT
              • 16.9 Inglobe Technologies Srl
                • Inglobe Technologies Srl - Overview
                • Inglobe Technologies Srl - Product / Service
                • Inglobe Technologies Srl - Key offerings
                • SWOT
              • 16.10 Lenovo Group Ltd.
                • Lenovo Group Ltd. - Overview
                • Lenovo Group Ltd. - Business segments
                • Lenovo Group Ltd. - Key news
                • Lenovo Group Ltd. - Key offerings
                • Lenovo Group Ltd. - Segment focus
                • SWOT
              • 16.11 Magic Leap Inc.
                • Magic Leap Inc. - Overview
                • Magic Leap Inc. - Product / Service
                • Magic Leap Inc. - Key offerings
                • SWOT
              • 16.12 mCloud Technologies Corp.
                • mCloud Technologies Corp. - Overview
                • mCloud Technologies Corp. - Product / Service
                • mCloud Technologies Corp. - Key news
                • mCloud Technologies Corp. - Key offerings
                • SWOT
              • 16.13 Plural Technology Pvt. Ltd.
                • Plural Technology Pvt. Ltd. - Overview
                • Plural Technology Pvt. Ltd. - Product / Service
                • Plural Technology Pvt. Ltd. - Key offerings
                • SWOT
              • 16.14 PTC Inc.
                • PTC Inc. - Overview
                • PTC Inc. - Business segments
                • PTC Inc. - Key news
                • PTC Inc. - Key offerings
                • PTC Inc. - Segment focus
                • SWOT
              • 16.15 QuestUpon
                • QuestUpon - Overview
                • QuestUpon - Product / Service
                • QuestUpon - Key offerings
                • SWOT
              • 16.16 Robert Bosch GmbH
                • Robert Bosch GmbH - Overview
                • Robert Bosch GmbH - Product / Service
                • Robert Bosch GmbH - Key news
                • Robert Bosch GmbH - Key offerings
                • SWOT
              • 16.17 Seabery Augmented Technology SL group
                • Seabery Augmented Technology SL group - Overview
                • Seabery Augmented Technology SL group - Product / Service
                • Seabery Augmented Technology SL group - Key offerings
                • SWOT
              • 16.18 Zugara Inc.
                • Zugara Inc. - Overview
                • Zugara Inc. - Product / Service
                • Zugara Inc. - Key offerings
                • SWOT

              17 Appendix

              • 17.1 Scope of the report
                • 17.2 Inclusions and exclusions checklist
                  • Inclusions checklist
                  • Exclusions checklist
                • 17.3 Currency conversion rates for US$
                  • Currency conversion rates for US$
                • 17.4 Research methodology
                  • Research methodology
                • 17.5 Data procurement
                  • Information sources
                • 17.6 Data validation
                  • Data validation
                • 17.7 Validation techniques employed for market sizing
                  • Validation techniques employed for market sizing
                • 17.8 Data synthesis
                  • Data synthesis
                • 17.9 360 degree market analysis
                  • 360 degree market analysis
                • 17.10 List of abbreviations
                  • List of abbreviations

                Research Methodology

                Technavio presents a detailed picture of the market by way of study, synthesis, and summation of data from multiple sources. The analysts have presented the various facets of the market with a particular focus on identifying the key industry influencers. The data thus presented is comprehensive, reliable, and the result of extensive research, both primary and secondary.

                INFORMATION SOURCES

                Primary sources

                • Manufacturers and suppliers
                • Channel partners
                • Industry experts
                • Strategic decision makers

                Secondary sources

                • Industry journals and periodicals
                • Government data
                • Financial reports of key industry players
                • Historical data
                • Press releases

                DATA ANALYSIS

                Data Synthesis

                • Collation of data
                • Estimation of key figures
                • Analysis of derived insights

                Data Validation

                • Triangulation with data models
                • Reference against proprietary databases
                • Corroboration with industry experts

                REPORT WRITING

                Qualitative

                • Market drivers
                • Market challenges
                • Market trends
                • Five forces analysis

                Quantitative

                • Market size and forecast
                • Market segmentation
                • Geographical insights
                • Competitive landscape

                Interested in this report?

                Get your sample now to see our research methodology and insights!

                Download Now

                Frequently Asked Questions

                Mobile Augmented Reality (Ar) market growth will increase by $ 507272.1 mn during 2025-2029.

                The Mobile Augmented Reality (Ar) market is expected to grow at a CAGR of 61.7% during 2025-2029.

                Mobile Augmented Reality (Ar) market is segmented by Application( M and A, Gaming and entertainment, Education and learning, Travel and tourism, Others) End-user( Enterprise, Consumer, Beam rider guidance system, Inertial and GPS guidance system) Type( Marker-based AR, Markerless AR, Anchor-based AR, South America, Middle East and Africa)

                Alphabet Inc., Apple Inc., Augmented Pixels Inc., Blippar Ltd., Independiente Communication Ltd., Inglobe Technologies Srl, Lenovo Group Ltd., Magic Leap Inc., mCloud Technologies Corp., Niantic Inc., Plural Technology Pvt. Ltd., PTC Inc., QuestUpon, Robert Bosch GmbH, Seabery Augmented Technology SL group, Seiko Epson Corp., VividWorks Oy, weAR Srl, Wikitude GmbH, Zugara Inc. are a few of the key vendors in the Mobile Augmented Reality (Ar) market.

                North America will register the highest growth rate of 40% among the other regions. Therefore, the Mobile Augmented Reality (Ar) market in North America is expected to garner significant business opportunities for the vendors during the forecast period.

                US, Germany, China, Japan, Canada, UK, India, France, South Korea, Italy

                • Increasing dependence on apps and the proliferation of AR apps for numerous activitiesAdvancements in mobile device technologies is the driving factor this market.
                • such as faster processors is the driving factor this market.
                • improved graphics capabilities is the driving factor this market.
                • and better camera quality is the driving factor this market.
                • have made smartphones and tablets more capable of handling AR applications effectively. The widespread adoption of smartphones and the increasing availability of affordable mobile devices have expanded the potential user base for AR apps is the driving factor this market.
                • driving their demand and usage. The availability of high-speed internet and the expansion of 4G and 5G networks have facilitated real-time data processing is the driving factor this market.
                • enabling seamless AR experiences that require constant data exchange. AR apps offer enhanced user experiences by bridging the physical and digital worlds is the driving factor this market.
                • making interactions more engaging is the driving factor this market.
                • immersive is the driving factor this market.
                • and interactive. The entertainment and gaming sectors have been early adopters of AR technology is the driving factor this market.
                • driving innovation and investment in AR app development and expanding consumer awareness of ARs capabilities. AR apps are increasingly integrated into e-commerce platforms is the driving factor this market.
                • allowing customers to virtually try products before making purchasing decisions is the driving factor this market.
                • enhancing the overall shopping experience. AR apps are employed in real estate and architecture to provide virtual property tours is the driving factor this market.
                • visualize architectural designs is the driving factor this market.
                • and overlay virtual objects on physical spaces. AR is used in enterprise settings for maintenance is the driving factor this market.
                • repair is the driving factor this market.
                • and training purposes is the driving factor this market.
                • enhancing worker productivity and efficiency. Companies that adopt AR technology early can gain a competitive edge is the driving factor this market.
                • offering unique and innovative services to attract and retain customers. Such factors are expected to drive the growth of the global mobile augmented reality (AR) market during the forecast period. is the driving factor this market.

                The Mobile Augmented Reality (Ar) market vendors should focus on grabbing business opportunities from the M and A segment as it accounted for the largest market share in the base year.